Ryerson University
Digital Commons @ Ryerson
Geography Publications and Research Geography
5-2-2013
Modelling Innovation Support Systems for
Development
Eric Vaz
Ryerson University, [email protected]
Teresa Noronha
University of the Algarve, [email protected]
Purificación Galindo
University of Salamanca, [email protected]
Peter Nijkamp
Free University of Amsterdam, [email protected]
Follow this and additional works at:http://digitalcommons.ryerson.ca/geography Part of theManagement Information Systems Commons,Management Sciences and
Quantitative Methods Commons, and theStrategic Management Policy Commons
This Working Paper is brought to you for free and open access by the Geography at Digital Commons @ Ryerson. It has been accepted for inclusion in Geography Publications and Research by an authorized administrator of Digital Commons @ Ryerson. For more information, please contact [email protected].
Recommended Citation
Vaz, Eric; Noronha, Teresa; Galindo, Purificación; and Nijkamp, Peter, "Modelling Innovation Support Systems for Development" (2013). Geography Publications and Research. Paper 51.
Modelling Innovation Support Systems for Development
Eric Vaz1, Teresa de Noronha Vaz2, Purificación Vicente Galindo3 and Peter Nijkamp4
Abstract
The present article offers a concise theoretical conceptualization on the contribution of innovation to regional development. These concepts are closely related to geographical proximity, knowledge diffusion and filters, and clustering. Institutional innovation profiles and regional patterns of innovation are two mutually linked, novel conceptual elements in this article. Next to a theoretical framing, the paper offers also a new methodology to analyse institutional innovation profiles. Our case study addresses three Portuguese regions and their institutions, included in a web-based inventory of innovation agencies which offered the foundation for an extensive data base. This data set was analyzed by means of a recently developed Principal Coordinates Analysis followed by a Logistic Biplot approach (leading to a Voronoi mapping) to design a systemic typology of innovation structures where each institution is individually represented. There appears to be a significant difference in the regional innovation patterns resulting from the diverse institutional innovation profiles concerned. These profiles appear to be region-specific. Our conclusion highlights the main advantages in the use of the method used for policy-makers and business companies.
Key words: modelling innovation, entrepreneurship, regional development, regional
innovation systems, principal coordinates analysis, logistic biplot, Voronoi mapping, public policy.
1 Ryerson University, Department of Geography, Toronto, Canada
2 Faculty of Economics and Research Centre for Spatial and Organizational Dynamics (CIEO), University of the
Algarve, Faro, Portugal
3 Department of Statistics, University of Salamanca, Spain, and Research Centre for Spatial and Organizational
Dynamics (CIEO), University of the Algarve, Faro, Portugal
1
1. Introduction
Despite the undeniable importance of innovation, in the relevant literature there is quite some ambiguity in the measurement and modelling of the drivers and impacts of innovation. The present paper provides an operational analytical method to empirically understand the determinants of an innovation process of companies, based inter alia on Logistic Biplots. Compared to classical innovation measurement and modelling methods, this novel method allows the identification of individual institutional
innovation profiles characterized by a quantifiable combination of relevant attributes
that are graphically represented. This approach also allows for a visual understanding of the companies’ innovation management choices.
The main goal of this article is to provide an analytical tool that helps to identify the critical links used by innovation institutions. Once such interactions are traced and the institutions’ locations are identified, the method also allows detecting the conditions of each institution to innovate and, therefore, to participate in successful regional innovativeness strategies. From this perspective, the institutional innovation profiles are able to identify important characteristics of regional innovation systems or, in general,
regional innovation patterns.
The results obtained also open the possibility to assess and evaluate public innovation support systems – a topic which is nowadays very relevant in the context of limited public financial support to regional development.
In this paper, the above goal is explored from two different perspectives: (i) it is conceptually framed by employing notions from endogenous growth theory, regional innovation systems approaches and enterpreneurship theory, to obtain new advances in a search for the identification of the individual firm performance to innovate and to offer a contribution to regional innovation patterns; (ii) it invests analytically whether and how innovation institutions are favouring combinations of appropriate attributes to innovate. The different combinations of attributes in this process (such as ‘promoting R&D’, ‘new product development’ or ‘knowledge transfer’ and ‘application of external technologies’) can be detected in the regional innovation patterns, for which these innovation institutions act as potential key constructors of regional development.
Methodologically, our empirical application is based on information obtained from observations on a sample of more than 600 Portuguese innovation institutions, systematically selected from internet sites using Portuguese key words directly related
2
to innovation. To construct our database, their web-published text with explicit descriptions concerning innovation was investigated, content analyses were applied, and next codified into empirical attributes (such as knowledge promotion, strategic management, R&D promotion, knowledge transfer, partnership and cooperation support and governmental orientation, skills development, etc.). After the application of what is called ‘principal coordinates analysis’, a Logistic Biplot application to these attributes allowed an exact classification of innovation profiles. Next, a Voronoi mapping approach was used to show each institution’s innovative performance. This method was then applied at a regional scale in Portugal, in such a way that the regional determinants of innovative performance in the form of regional innovation patterns could also be identified.
Our analysis framework enables us to present two types of research issues: (i) a comparative analysis of the institutions’ innovation performance in different regions based on a visualized three-dimensional representation of the variables considered as key attributes (or determinants) of innovative patterns, by region, level of importance for general innovative processes, and relative proximity of each firm to the nearest significant determinants; and (ii) the presentation of relevant empirical results that call for an intensive implementation of tailor-made public support actions, in view of an efficient use of these support systems and given the observed highly diversified contexts and the multiplicity of the institutional innovation profiles identified. Clearly, policy makers need to accept and integrate differentiated and distinct policy measures regarding innovation and entrepreneurship in their regional domain. Because of the demanding efforts required to put in practice such policy lessons, the quantitative methodology presented in our study may provide a new and relevant contribution to regional innovation and policy analysis.
2. Theoretical Framing of Research Issues
2.1. Institutional innovation profiles and regional innovation patterns
Economic theory has achieved significant milestones regarding the contribution of growth theory to a better understanding of the social impacts of technological change. The seminal contributions were provided in particular by Solow (1956) – later improved by Arrow (1962) – by introducing learning-by-doing as a determinant of technological development, or by Lucas (1988) by including the growth rate of human capital as a
3
factor of technical change and long-run growth, and by Romer (1986 and 1990) by highlighting that technical change is endogenously determined by research. The spillover effects resulting from such improvements, more generally defined as innovation, were presented in particular in the Marshall-Arrow-Romer model, as discussed by Acs and Audretsch (1984) and Acs (2002). This endogenous growth interpretation offered a major contribution since technological innovation turned out to be a product of knowledge generating inputs. When Porter (1990) explained how the competitive advantage of companies was strongly co-determined by geographical proximity among business actors by promoting business links and enhancing a clustering tendency, economic growth theory was gradually offering a transition from a macroeconomic approach to the theory of the individual firm, thereby using the microeconomic instruments necessary to better understand institutional decision-making in a risky and uncertain environment (Williamson 1985).
In this vein, a great variety of studies on spatial clustering have been
instrumental in describing how – though not so much why – organizations and
institutions get together to face and respond to competitive challenges (see, e.g., Porter 1998). Similar attempts however, can be found to explain why different entities join efforts to collaborate (see Putnam 2000, or Westlund and Bolton 2006). In a cluster, managers and decision makers share a great number of cognitive references and experiences that help to establish connections that follow the same pattern of organizational behaviour. Nonetheless, in addition to general positive economies of scope and agglomeration externalities, one may also point to negative consequences: because all actors participate in the same organizational culture, they may induce a strategic myopia to the process, thereby reinforcing imitating and non-innovative behaviours (Karlsson et al. 2005).
Much has been written about the importance of companies, in particular about the small and medium-sized firms embedded in local or external networks of trade, marketing, information, knowledge, partnership, eventually tending towards innovation. The consequent positive externalities, when pooled to local economic conditions, tend to boost internal business performance and, eventually, to generate external regional advantages (Lechner and Dowling 2003 or Noronha Vaz 2004).
The contribution of cluster theory to outline and shape the bilateral influences of companies and related regional prosperity has been noteworthy, although it was theoretically missing an important complement, viz. the dynamic concept of knowledge.
4
Indeed, much progress has resulted from the generalized recognition of knowledge as a key factor to generate growth and its consequences in shaping new spatial-economic activity (Fischer 2006).
In this context, Gordon and McCann (2005) have focused on the role of agglomeration economies in fostering localized learning processes such as informational spillovers or other information transfers as benefits to regional localized companies resulting from the development of new products and new processes. Next, as highlighted by Audretsch and Lehmann (2006), – although the marginal cost of informational and capital flows decreased massively with globalization – the comparative advantage of localization shifted from a capital base to a knowledge base. This shift in the relative cost of knowledge (tacit and not explicit) justified the increasing value of geographical proximity, pulling most of the theoretical arguments to the limits of location theory. Location analysis was increasingly centred on the advantages of proximity for knowledge creation areas5 or on the importance of knowledge diffusion circuits (or its spillovers) as pointed out by Stough and Nijkamp (2009).
Among many other significant contributions, one outstanding study is particularly interesting to our study. Heidenreich (2008) discussed extensively the dynamic concept of industrial complementarities (proposed by Robertson and Patel in 2007) in the case of low- and medium-technology industries, so important for countries such as Portugal. The author explains that complementarities have two distinct types: (i) those based on traded interdependencies such as economic transactions, facilitating the diffusion of codified knowledge and (ii) those based on untraded interdependencies such as conventions, informal rules or habits, that coordinate the economic actors under uncertainty and facilitate the diffusion of tacit knowledge.
The previous arguments demonstrate that, in a globalizing world, where distance friction seems almost non-significant, local proximity to knowledge sources emerges as a tool able to confer significant advantages to institutional and regional competitiveness. Nevertheless, there is still a missing connection between the concept of knowledge, as a source of growth, and regional clusters, as organized local institutional productive nests. Audretsch et al. (2006) have identified such a missing link under the heading of a
knowledge filter framed by the knowledge spillover theory of entrepreneurship. They
5 The regional approach is then substituted by the concept of proximity and locational choice. Later on in
our study, the region is studied in a predefined geographic context. Admittedly, our investigation does not include issues related to governance systems.
5
explained that, when pursuing an entrepreneurial opportunity, the knowledge filter is the gap between the new knowledge and the commercialized knowledge, similar to the concept of Arrow (1962). Understood within a broad institutional context including risk and uncertainty, the fundamental decision to be made by the institutions for knowledge creation, acquisition and eventually innovative behaviour is then shifted from firms to individuals, a situation that may induce a higher knowledge filter. The higher it is, the greater the divergences in the valuation of new ideas across economic agents and their decision-making hierarchies. This is an exceptionally convincing argument to theoretically frame gaps among institutions, to challenge the definition of institutional
innovation profiles and, consequently, to identify regional patterns of innovation, where
frequently bottlenecks to regional prosperity can be observed.
Given the above mentioned conceptual context, we now define our first research question: In light of the different absorption capacities (Fischer 2006) or different
knowledge filters – through which institutions have individual innovation profiles, – is it
possible to identify each one of these profiles, map them out and relate them to a set of profiles of other nearby located companies (in the same country, region or cluster)? And if so, what can such a static comparative analysis tell us?
To enrich the debate on the spatial clustering phenomena, the concept of Regional Innovation Systems (RIS) has been presented as a network of organizations, institutions and individuals, within which the creation, dissemination, and exploitation of new knowledge and innovation occurs (Cooke et al. 2004). The RIS concept was introduced to describe how the industrial and institutional structure of a given national or regional economy tends to guide technological and industrial development along certain trajectories, facilitating actions from a public policy perspective. The link between ‘clusters’ and ‘regional innovation systems’ is that – within these spatial systems - groups of similar and related companies (e.g. large and small companies, suppliers, service providers, customers, rivals, etc.) comprise the core of the cluster, while academic and research organizations, policy institutions, government authorities, financial actors and various institutions for collaboration and networks make up the innovation system of which the cluster is a part (Teigland and Schenkel 2006). It has been shown by Arthurs et al. (2009) that the patterns of close and remote relationships (including those taking place within a cluster) vary, at least, by industry, ownership status, market orientation, as well as in conformity with the growth phase and size of the cluster.
6
In the same vein, Davis (2008) adds a major contribution, demonstrating that besides the variation in the form of relationship - and even in relatively small regional innovation clusters – different structures of interaction and different innovation
pathways can be detected. Taking the IT sector in New Brunswick as a case study, he
was able to identify a variety of significant structural relationships, for example, with the companies that supply business services, innovation support services, investments, and business partners or with those providing local technical infrastructure and the use of public/private knowledge-based business services (Davis and Schaefer 2003).
Given the policy implications resulting from clustering at a regional level and the different structures that they may take, we assume that the possibility to detect individual institutional profiles towards innovation allows us to address our second research question: Is it possible to quantitatively estimate the major characteristics of regional innovation systems or, if they do not exist, quantitatively define regional innovation patterns as bases of such structures of innovation interaction?
2.2. Modelling innovation
Birchall et al. (2004) have published a study on the complexity of innovation performance measurements. This report was one of the first responses, coming from the side of practitioners of innovation, to the solutions presented for innovation measurement and modelling. Notwithstanding the significant effort developed on the topic by researchers, policy makers and other stakeholders, most studies suggest that there remains a serious gap between what companies are hoping for and what they are receiving from their investments in innovation. The conventional approaches to performance measurements may be very useful regarding the information related to the companies’ cost and efficiency, but they tend not to have a strong impact in the area of innovation management.
It seems plausible to state that innovation is intangible and, at least in part, dependent on serendipitous occurrences in the innovation environment. Consequently, the measurement of innovation performance is, despite its importance, a somewhat controversial topic that is still in its infancy. Traditional approaches to performance measurement typically inform about ‘what’ has happened, but do not address the ‘why’, thus leading many managers to view the innovation process as a ‘black box’ that defies rational managerial analysis.
7
In a similar vein, Nauwalers and Wintjes (2008) discuss the opportunity of measuring and monitoring innovation policy in Europe. The multiplicity of indicators of innovation (Innovation Scorecards, etc.) is so broad that the resulting studies seem to have little direct impact on the policy-making community. The authors mention that the more is learnt about indicators, the higher the level of incoherence achieved. Researchers realize that much is still to be learnt on what concerns the relationship between innovation policies and innovation performances.
Clearly, the literature on the measurement and modelling of innovation is rich, but has not yet convincingly contributed to identifying the most successful ways of policy making and decision-taking processes. Recalling Schumpeter’s observations on the tendency of innovations to cluster, the use of innovation as an instrument of public policy in order to promote fast economic development requires profound empirical attention. This argument has recently motivated some researchers to address more explicitly the drivers of innovation, including their institutional settings and spatial contexts.
Various efforts to better understand these drivers have stimulated researchers to adopt the resource-based view of the firm (see Noronha Vaz and Cesário 2008). These authors take for granted the heterogeneous character of companies and their unique choices related to strategic behaviour (Knudsen 1995; Kaleka 2002). In this context, knowledge is recognized as a key resource for companies and other economic agents (Albino et al. 1999; Nooteboom 1999). In addition, some authors have stressed the key role of ‘good communication’ between industry and research institutes for the successful transfer of technological knowledge (Kaiser 2002).
An interesting extension of this literature can be found in the Triple Helix concept, whereby the triangular interaction between the research community, governments and industries is seen as key to successful innovation (see Etzkovitz and Leydesdorff 1998). Doloreaux (2002) adds that knowledge is socially embedded, created, and reproduced through social interaction.
The previous empirical observations have inspired our research goals and the method hereby presented. The choice of the explanatory variables follows then out research orientation.
8
3. Empirical Approach and Analysis
3.1. Relevance of the Portuguese case
The reason why Portugal is used as an illustrative case in this study stems from the fact that over the past decade there has been an increasing awareness that innovation is a key element for competitiveness. The successive Portuguese governments – and in particularly those in office since March 2005 – had a clear vision on technological change as a major determinant for the development of the country. For example, main policy goals were formulated in the Technological Plan to fulfil the so-called Lisbon Strategy of the EU (renewed in a subsequent Integrated Plan) and the PNACES (Plano Nacional de Acção para o Crescimento e Emprego 2005-8). Both plans demonstrated the ambition to increase the competitiveness of the Portuguese economy through an intensive use of information and communication technologies. After a significant rise in financial means to achieve these targets and a serious recession to which only a few companies have been able to respond, it is now a timely question how successful this strategy has been. A further justification is provided by the ‘Strategies for Collective Efficiency (2009) based on Clusters and the Economic Valorization of Endogenous Resources’; see for more information www.pofc.qren.pt/PresentationLayer/conteudo.
As time goes by, it is progressively better understood that the management of knowledge transfer is not only a task of academic and research organizations, but also, and essentially, of decision makers, financial actors, and large and small institutions charged with the task to promote innovation. Also in Portugal, the awareness has grown that an improved understanding of how knowledge transfers take place will facilitate relevant innovation actors to cope with many obstacles and challenges while enhancing their ability to create and sustain knowledge-based competitive advantages. In the country, most European support programmes for the modernization of economic activity have given priority to people and the enhancement of networking of institutional systems. The Portuguese scientific and tertiary educational system illustrates nowadays such major strategic governmental tasks, based on three drivers: (i) the view that innovation should be considered together with competence building and advanced training; (ii) the need for expansion of the social basis for knowledge activities; and (iii) the intensification of social networks to enhance the mobility of users to stimulate innovation.
9
According to Heitor and Bravo (2010), the country experienced the highest growth rate in Europe in private R&D expenditures between 2005 and 2008, jumping from 0.3 per cent of GDP in 2005 to 0.8 per cent of GDP in 2008, mainly as a result of the PRIME programme – a programme that supported industrial activity in Portugal from 2000 to 2006. Vicente-Galindo and Noronha Vaz (2009) have investigated the degree of effectiveness of this programme at both locational and sectoral levels. They reviewed the financing of 14,910 projects granted by PRIME. but their overall finding was not positive: PRIME appeared to have accentuated also the socio-economic asymmetries in Portugal, thereby reducing many efforts made by previous regional policies.
In conclusion, effective results of recent development policies in Portugal remain unclear, so that a follow-up strategy concerning regional innovation patterns and on the analysis of institutional profiles from a more individual perspective is essential. This will be the scope of the present contribution.
3.2. Data base
Our investigation uses an extensive set of private institutions and public organizations located in Portugal, evaluated by their Webpage contents on innovation. The data was obtained by means of a careful and extensive observation of 820 Internet sites of Portuguese institutions, classified into different groups of actors. These sites, collected in 2006, were found by means of a broadly covered sample including all organizational sites that included the following keywords – inovação, inovador and inovada/do – on their sites6. Finally, after a careful filtering, 623 institutions could be traced, and these were classified into nine groups, each characterized by ten variables. The selection of the variables was based on earlier developed research (see for more details Noronha Vaz and Nijkamp 2009 on the theoretical basis, and Galindo et al. 2010, for the measurement methods). The latter two publications suggest and identify relevant
6 Some more detailed explanation may help to better understand the method used to obtain the variables
representing how companies combine different predefined attributes to achieve innovation. In order to be able to apply the advanced statistical methods used, all data should ideally be observed in the shortest possible period of time – time being a crucial factor for change in the relationships among companies and their respective attributes. From a dynamic perspective, no value of an attribute over a set of companies stays static over time. And, as relationships change, vectors showing the Biplot representation – the technical tool used in our research – will also alter.
With this in mind, and because this paper is an attempt to use a static view of the methodology, the experiment calls for a fast gathering of the data set. Unfortunately, such a fast approach is difficult to accommodate within the standard application of survey questionnaires to individual companies.
10
variables as plausible determining innovation indicators and patterns. In this vein, Caraça et al. (2009) have recently emphasized that science is a driver for knowledge creation and therefore one of the first steps in the process for innovation. In addition, these authors clearly recognize the multi-player dimension of innovation and its wider institutional setting.
The various characteristics referred to above should be plausible descriptors of innovation patterns, and will, therefore, be called attributes of innovation. Information on these attributes was extracted after a careful content analysis and review of the various web pages. These attributes are: Promoting knowledge (PK); Studying processes (SP); Managing (Mg); Promoting R&D (PRD); Knowledge transfer (KT); Support to entrepreneurship (SE); New product development (NPD); Promoting partnership and cooperation (PPC); Application of external technologies (AET); and Orientation towards innovativeness (Or). Clearly, these indicators are not completely independent, but such multi-collinearity problems are taken care of in the Principal Coordinates Analysis.
As important agents or stakeholders in the sample, the following institutions or actors of innovation have been considered: governmental agencies, associations, technological parks and science centres, R&D organizations, entrepreneurship-supporting entities, technological schools, university interfaces, financial institutes – as well as venture capitalists or high risk investors and, finally, other institutions7.
7 These agents are described in more detail as follows: 1) Governmental agencies: all entities which pertain to the sphere of governmental power, and which exercise regulatory functions in political terms, as far as innovation is concerned. Furthermore, they play an important role in the promotion, administration, financing, and evaluation of creativity and innovation processes in the country; 2) Associations: this category includes all agencies with a legal status which, depending on the interests of their associates, influence creativity and innovation. Examples of the activities of such associative entities include: sectoral or regional cooperation, knowledge transfer management, support to value creation (e.g. certification), regional partnerships; 3) Technological parks and science centres: in this category one can find institutions which offer technical, technological or other type of support to organizations in the same economic or industrial sector. These entities contribute to creativity and innovation processes in numerous ways: technology transfer, partnerships, and certification; 4) R&D organizations: organizations which direct their main activities to R&D, and which concentrate on broad economic and industrial applications (this category does not include private and public institutions whose main activity is not R&D, though such institutions may have large investments in R&D activities); 5) Entrepreneurship-supporting entities: this category refers to institutions or organizations which aim to stimulate creative and entrepreneurial activity; 6) Technological schools: these are concerned with entities which aim to provide technological and professional training and education in innovation-related areas; 7) University interfaces: these include structures, units, or university associations, operating in a particular university, and which aim to act as an interface between the university and private and public institutions; 8) Institutions: these are public and private organizations involved in innovation and/or with investments in innovation activity. 9) Financial institutes, as well as venture capitalists or high risk investors have also been classified in this category; 10) Other: these are other entities with a role in creativity and innovation and which have not been included in any of the previous categories.
11
3.3. The regional perspective
One of the objectives of this paper is to identify and map the innovation institutions in Portugal within a geometric space, based on each individual innovative performance defined as a profile. Clearly, the institutions’ geographical location leads them to act distinctly, and therefore, a further research question is raised: What is the institutions’ associated behaviour and is there a regional pattern involved? At this stage it is noteworthy that already quite some time ago Posner (1961), Krugman (1979) and Fagerberg (1987, 1988) argued that in cross-country or cross-regional analyses, the presence or lack of innovation may ‘affect differential growth rates’. In particular, an imitative or innovative modus operandi may explain different levels of development among countries or regions, for example, the ‘technology gap’ or even the ‘north-south’ asymmetry.
In order to respond to such questions, the model developed by us was applied at a regional level of the country8, as an additional observation dimension. In our database, a filter of the whole sample allowed the institutions to be grouped by region. The model application was able to detect regional innovation patterns or, in other words, the way the various attributes integrated in geographical space were able to identify and represent regional structures of innovation.
The five standard NUTS-II Portuguese regions were used for our analytical purposes: Norte; Lisboa and Vale do Tejo; Centro; Alentejo; and Algarve (see Figure 1).
Figure 1: NUTS-II classification for Portugal
8 The regional level was thus chosen as a separate dimension, next to other attributes such as: the country or the cluster concerned.
12
3.4. Methodology and practical interpretation rules
The information for our statistical model is organized in an I x J binary data matrix obtained from several innovation attributes, in which the I rows correspond to 623 entities or units (18 Governmental entities, 297 Companies, 70 Associations, 20 Technological parks and centres, 58 R&D organizations, 48 Entrepreneurship support entities, 12 Technological schools, 80 University interfaces, and 14 Other entities), and the J columns to 10 binary innovation attributes coded as present (1) or absent (0), (comprising Promoting knowledge, Studying process, Managing, Promoting R&D, Knowledge transfer, Support to entrepreneurship, New product development, Promoting partnership and cooperation, Application of external technologies, Orientation).
As a statistical tool to obtain the main innovation gradients9, of the entities (institutions) and their relation to the observed attributes, we apply a novel algorithm, recently proposed by Demey et al. (2008) that combines Principal Coordinates Analysis (PCoA) and Logistic Regression (LR) to construct an External Logistic Biplot (ELB).
The algorithm starts with a PCoA, as a technique for ordering the units, in Euclidean space, on the latent gradients. The second step of the algorithm is applying a logistic regression model for each variable by using the latent gradients as independent variables. Geometrically, the principal coordinate scores can be represented as points on the map, and the regression coefficients are the vectors that show the directions which best predict the probability of presence of each attribute.
To search for the variables associated with the ordering obtained in PCoA, we look for the directions in the ordering diagram which best predict the probability of the presence of each unit. Consequently, the second step of the algorithm consists of adjusting a logistic regression model for each variable by using the latent gradients as independent variables. According to the geometry of the Linear Biplot for binary data (Vicente-Villardón et al. 2006), in which the responses along the dimensions are logistic (Logistic Biplots, LB), each variable is represented as a direction through the origin.
For each attribute, the ordination diagram can be divided into two separate regions predicting presence or absence, while the two regions are separated by a line that is perpendicular to the attribute vector in the Biplot and cuts the vector at the point
9 There are two gradients, each representing the values of the abscis and the ordinate corresponding to the geometrical location of each institution as a point in the corresponding plane. Together, they show the joint value of the determinants for each institution.
13
predicting 0.5. The attributes associated with the configuration are those that predict the respective presences adequately.
Measures of the quality of the representation of units, and variables related to the graphical representation, are also calculated in this framework. The quality of representation of a unit is measured as the percentage of its variability accounted for by the reduced dimension solution, and is calculated as the squared cosine of the angle between the point/vector in the multidimensional space and its projection onto the low dimensional solution. As the representation is centred at the origin, the variability of each unit is measured by its squared distance to the centre, so that the quality of representation can be measured by the ratio between the squared distance in the reduced dimension and the squared distance in the complete space. The quality of representation of a variable is measured as a combination of three indexes: the p-value of the logistic regression, in order to test the relation of the solution and each variable (using the deviance); the Nagelkerke-R squared; and the percentage of correct classifications, using 0.5 as a cut-off point for the expected probability. As a way to identify which gradient (dimension) is mostly related to each variable, the cosine of the angle of the vector representing the variable and the dimension is calculated. The variable is more related to a particular gradient when the absolute value of the cosine is higher than the cosine for other gradients. Then, to produce an elegant solution, a Voronoi diagram of the geometrical relationships is presented; that is, a special decomposition of a metric space determined by distances to a specified discrete set of points: these are centroids from a k-means cluster analysis of the ELB coordinates10
.
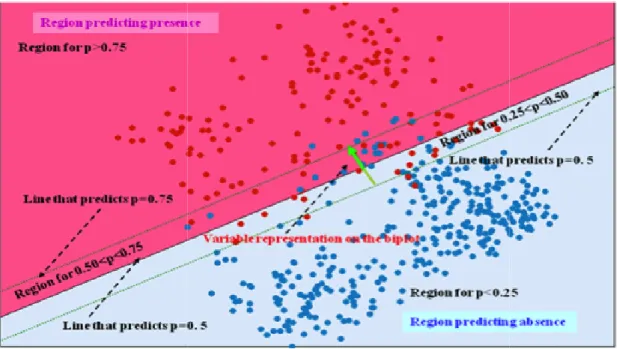
Figure 2 shows the biplot representation of one of the variables. The small arrow is the graphical representation of the variable on the biplot and shows the direction in the space spanned by the first two dimensions that better predicts the expected probabilities projecting each unit (circles in the graph) onto that direction. All the points in the graph that predict the same probability lie on a straight line perpendicular to the prediction direction. In the graph we have identified two lines predicting probabilities of 0.5 and 0.75. The first of these lines is important, because it splits the map of points into two regions: the region predicting presence (πij> 0.5), and the region predicting absence
(πij< 0.5). The coloured red circles are the regions with observed presence, and the blue
circles the regions with observed absence. Note that most of the observed presences are
10 A computer program, based on Matlab code, for implementing these methods is available and can be obtained from the website: http://biplot.usal.es.
on the region predicting presence, most of the observed absences are on the region predicting absence, and that the wrong predictions have expected probabili
0.5. This means that the variable is apparently correctly summarized on the graph as shown also by the high values of the quality of the representation indexes (R2 = 0.92, with p = 0).
Figure 2: Interpretation of the relationship between un
4. Interpretation of results
4.1. Graphical representation of the
Principal Coordinates Analysis on the Russel and Rao coefficient. It
Table 1: Eigenvalues, percentage of accounted variance Eigenvalue
37.49 6.78 5.85
The first principal plane (two
of the variability. The first eigenvalue is significantly higher than the second one, meaning that, even if the two innovation gradients are considered, the first (horizontal) dimension accounts for most of the information.
on the region predicting presence, most of the observed absences are on the region predicting absence, and that the wrong predictions have expected probabili
0.5. This means that the variable is apparently correctly summarized on the graph as shown also by the high values of the quality of the representation indexes (R2 = 0.92,
Figure 2: Interpretation of the relationship between units and variables
results
representation of the national determinants of innovation
Analysis (PCA) was applied to the dissimilarities matrix, based Russel and Rao coefficient. It produced the following results (see Table 1):
Table 1: Eigenvalues, percentage of accounted variance % of variance Cumulative %
57.99 57.99
10.49 68.49
9.05 77.53
first principal plane (two-dimensional solutions) accounts for
of the variability. The first eigenvalue is significantly higher than the second one, meaning that, even if the two innovation gradients are considered, the first (horizontal) dimension accounts for most of the information.
14
on the region predicting presence, most of the observed absences are on the region predicting absence, and that the wrong predictions have expected probabilities close to 0.5. This means that the variable is apparently correctly summarized on the graph as shown also by the high values of the quality of the representation indexes (R2 = 0.92,
its and variables
national determinants of innovation
the dissimilarities matrix, based the following results (see Table 1): Table 1: Eigenvalues, percentage of accounted variance
Cumulative %
dimensional solutions) accounts for 77.53 per cent of the variability. The first eigenvalue is significantly higher than the second one, meaning that, even if the two innovation gradients are considered, the first (horizontal)
15
In Figure 3 below a complex representation of the patterns of the main determinants of dynamic innovation according to the ten considered variables can be observed: Promoting knowledge (PK); Studying process (SP); Managing (Mg); Promoting R&D (PRD); Knowledge transfer (KT); Support to entrepreneurship (SE); New product development (NPD); Promoting partnership and cooperation (PPC); Application of external technologies (AET); Orientation (Or). Each institution has a particular location on the graph and is represented by a different symbol. The distance between any two institutions (points of the configuration) serves to approximate, as closely as possible, the dissimilarity between them.
Figure 3: Determinants of innovations by attributes
Each attribute is represented as a direction through the origin. The projection of a point representing a unit onto an attribute direction predicts the probability of the presence of that attribute, i.e. the expected probability of having that attribute for an entity with the same combination of variables (innovation pattern). A vector joining the points for 0.5 and 0.75 is drawn; this shows the cut-off point for the prediction of the presence and the direction of increasing probabilities. The length of the vector can be interpreted as an inverse measure of the discriminatory power of the attributes, in the
16
sense that shorter vectors correspond to attributes that better differentiate between units. Two attributes pointing in the same direction are highly correlated, while two attributes pointing in opposite directions are negatively correlated, and two attributes forming an angle close to 90º are almost uncorrelated. The variability of each unit is measured by its squared distance to the centre.
The global goodness of fit (quality of representation) as a percentage of correct classifications in the Biplot appears to be 90.43 per cent. The goodness of fit indexes for each variable (attribute) are shown in Table 2. All R-squared values are higher than 0.6, and therefore all variables are closely related to the two dimensional PCoA solution.
Table 2: Goodness-of-fit of the variables/attributes
Variable Deviance p-value R2 % Correct
Promoting knowledge 674.94 <0.0001 0.88 93.42 Studying process 418.70 <0.0001 0.68 82.50 Managing 906.68 <0.0001 0.92 92.29 R&D 549.93 <0.0001 0.77 89.08 Knowledge transfer 763.53 <0.0001 0.90 92.67 Support to entrepreneurship 267.13 <0.0001 0.60 90.69 New product development 723.74 <0.0001 0.94 97.27 Promoting partnership & cooperation 733.39 <0.0001 0.92 95.19 Application of external technologies 822.17 <0.0001 0.93 95.02
Orientation 544.62 <0.0001 0.77 83.95
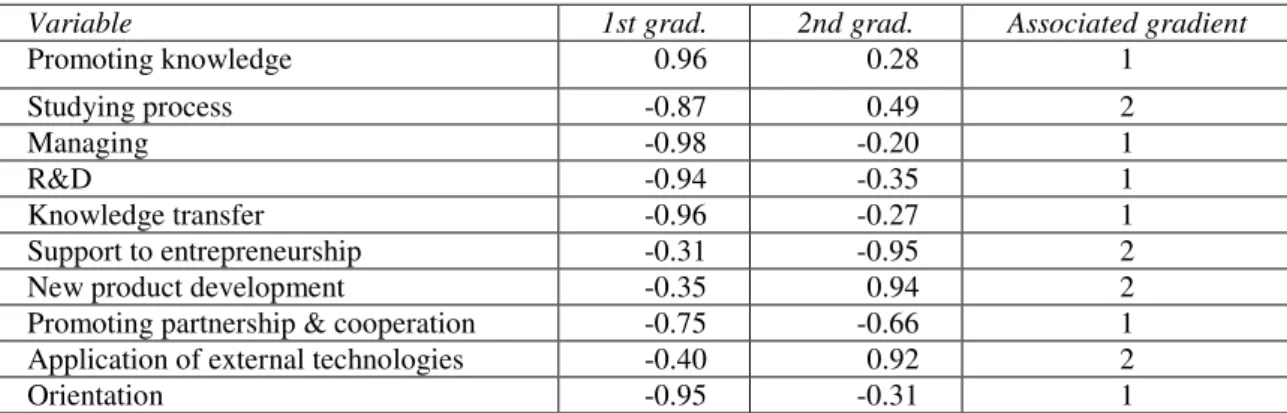
Next, Table 3 contains the cosines of the angles of the variables with their respective dimensions. It has to be pointed out that any direction in the two-dimensional solution, and not just the main dimensions, can be considered as innovation gradients. The graph can help us to look for the most interpretable directions.
Table 3: Cosines of the angles
Variable 1st grad. 2nd grad. Associated gradient
Promoting knowledge 0.96 0.28 1 Studying process -0.87 0.49 2 Managing -0.98 -0.20 1 R&D -0.94 -0.35 1 Knowledge transfer -0.96 -0.27 1 Support to entrepreneurship -0.31 -0.95 2
New product development -0.35 0.94 2
Promoting partnership & cooperation -0.75 -0.66 1 Application of external technologies -0.40 0.92 2
Orientation -0.95 -0.31 1
An analysis of the cosines’ value in the graph identifies two main directions for innovation gradients. A third column has been added to Table 3 showing which
17
variables are most related to each direction. The first gradient is almost parallel to dimension 1 (horizontal) and the second to dimension 2 (vertical). Although the variable ‘Promoting knowledge’ has a higher cosine with the first dimension, it has been assigned to the second gradient after inspecting the graph.
From the graph and the quality indexes, we can conclude that the first innovation gradient is mainly represented by a combination of the following variables/attributes: Promoting knowledge (PK); Managing (Mg); Promoting R&D (PRD); Knowledge transfer (KT); Promoting partnership and cooperation (PPC); Orientation (Or).
Observing the directions of the vectors, in Figure 3, relative to the first latent attribute, it can be concluded that the presence of all those attributes tends to show up together. The graphical representation corroborates the interpretation of the innovation gradients in terms of their relations to the variables. It can also be concluded from the graph that there is a high correlation between Promoting knowledge, Studying processes, Managing, Promoting R&D, Knowledge transfer and Orientation. This is because they have small angles pointing in the same direction.
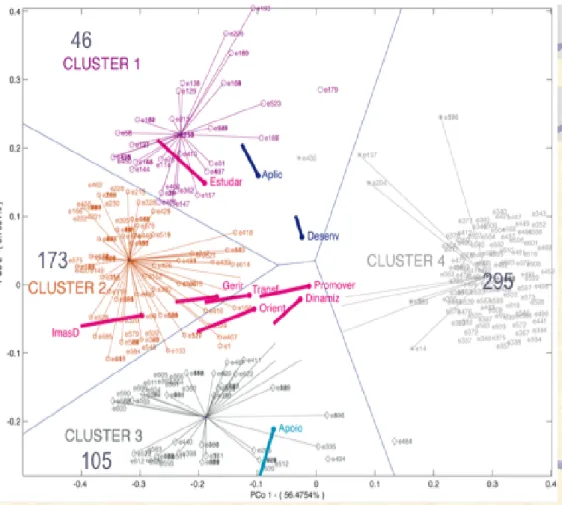
A Voronoi diagram of the geometrical relationships is represented in Figure 411. By analysing our Voronoi diagram and relating it to the clusters, it is possible to find four groups of entities (institutions) with homogeneous patterns along the two gradients considered.
The 295 institutions positioned in Cluster 4 answered “NO” to all variables that concerned innovation12. The 46 institutions of Cluster 1 reported the presence of all variables, except the variable Support. The 173 institutions of Cluster 2 reported a different a pattern. All of them have the presence of Promoting knowledge (PK); a high percentage have the presence Managing (Mg); and just a few of them have Promoting R&D (PRD). Cluster 3 comprises 105 institutions which have the presence of the variables Promoting knowledge (PK) and Promoting partnership and cooperation (PPC) but lack Studying process (SP), New product development (NPD), Application of external technologies (AET) and for the rest of the indexes there is no general pattern.
11 In this case, a set of points is given in the plane: the centroids from a k-means cluster analysis onto the ELB coordinates, which are the Voronoi sites. Each site has a Voronoi cell, consisting of all points closer to a centroid than to any other site. The segments of the Voronoi diagram are all the points on the plane that are equidistant to the two nearest sites. The Voronoi nodes are the points equidistant to three (or more) sites. Two points are adjacent on the convex hull if and only if their Voronoi cells share an infinitely long side.
12 These institutions, and those of the next cluster 4, are considered to have no innovations at all. It should be added that some companies did not provide the precise data matching the attributes reflecting innovation, so that the classification may not exactly match the real conditions.
The entities (institutions) positioned on the left side of the graph have a higher capacity to innovate dynamically
variables (attributes) (Cluster 2), while the entities (institutions) positioned on the right side lack most (or all) of such attributes (
variables on the first gradient can be ordered to obtain the sequence of attributes that define the degree of innovation. The most innovative institutions have all
and then they are followed by those entities that have all of them, except Promoting R&D (PRD) whose score is situated to the left of the graph. The next group would have all the attributes, except Promoting R&D and Managing (Mg), and so
Figure 4: The structure of
The second innovation gradient is a combination of Studying process (SP); New product development (NPD); Application of external technologies (AET) pointing in the positive direction; and Support to entrepreneurship (SE) pointing in the opposite direction. This secondary gradient is not correlated with the first one and summarizes an aspect of innovation independent from the main dynamic pattern. The institutions The entities (institutions) positioned on the left side of the graph have a higher dynamically, because they tend to aggregate higher values of those luster 2), while the entities (institutions) positioned on the right side lack most (or all) of such attributes (Cluster 4). Using this method, the scores of the the first gradient can be ordered to obtain the sequence of attributes that define the degree of innovation. The most innovative institutions have all
and then they are followed by those entities that have all of them, except Promoting (PRD) whose score is situated to the left of the graph. The next group would have all the attributes, except Promoting R&D and Managing (Mg), and so forth
Figure 4: The structure of an innovation system with clustering effect Portugal
The second innovation gradient is a combination of Studying process (SP); New product development (NPD); Application of external technologies (AET) pointing in the positive direction; and Support to entrepreneurship (SE) pointing in the opposite This secondary gradient is not correlated with the first one and summarizes an aspect of innovation independent from the main dynamic pattern. The institutions
18
The entities (institutions) positioned on the left side of the graph have a higher , because they tend to aggregate higher values of those luster 2), while the entities (institutions) positioned on the right luster 4). Using this method, the scores of the the first gradient can be ordered to obtain the sequence of attributes that define the degree of innovation. The most innovative institutions have all the attributes, and then they are followed by those entities that have all of them, except Promoting (PRD) whose score is situated to the left of the graph. The next group would have
forth.
innovation system with clustering effects in
The second innovation gradient is a combination of Studying process (SP); New product development (NPD); Application of external technologies (AET) pointing in the positive direction; and Support to entrepreneurship (SE) pointing in the opposite This secondary gradient is not correlated with the first one and summarizes an aspect of innovation independent from the main dynamic pattern. The institutions
19
situated on the top (Cluster 1) of the graph would combine the first three attributes listed above and the last is absent, while the institutions situated at the bottom (Cluster 3) have the last one but the first three attributes listed above are absent.
4.2. Graphical representation of the regional determinants of innovation in Portugal
It should be noted that in each graph (Figures 5-7) the individual institution profile of each region is represented in such a way that one can identify its relative position in the general innovation profile – the vectors link each one the institutions (located in the graph as a consequence of their use of attributes and identified by a code) to the centroid of the cluster.
After having mapped each firm’s innovative performance, the same analyses may now be applied at regional level, so that the regional determinants for innovative performance – as regional innovation profiles – can be recognized and a comparative analysis is possible. It should be added that the regions of Algarve and Alejento offered data that appeared to be rather incomplete, and hence not very suitable for a further regional statistical analysis. Therefore, these two regions will not be further investigated in our study. We will only concentrate on the three remaining areas (see Subsections 4.2.1-4.2.3). .
4.2.1. Lisboa and Vale do Tejo
The analysis for shows four clusters indicating four different innovation patterns. Cluster 4 is composed mostly of those institutions without any innovation. The remaining three clusters are composed of those institutions that innovate (higher gradient of innovation), but for each cluster the attributes appear to combine differently (see Table 4). In our table PRESENCE means that in this percentage of institutions the indexes of innovation that are mentioned were present. For example, for the first case, the innovation index PK was present in 98.24 per cent of the institutions studied.
Table 4: Innovation clusters for Lisboa and Vale do Tejo
Cluster 1: 57 institutions (21.19%)
Presence of Absence of
Promoting knowledge (PK) 98.24% New product development (NPD) 98.24% New product development (NPD) 98.24% Knowledge transfer (KT) 92.98% Orientation (Or) 92.98%
Promoting partnership and cooperation (PPC) 87.71% Managing (Mg) 84.21%
Studying process (SP) 80.70% Promoting R&D (PRD) 50.87%
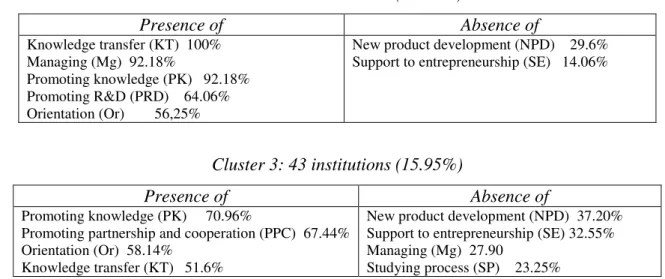
20 Cluster 2: 64 institutions (23.79%) Presence of Absence of Knowledge transfer (KT) 100% Managing (Mg) 92.18% Promoting knowledge (PK) 92.18% Promoting R&D (PRD) 64.06% Orientation (Or) 56,25%
New product development (NPD) 29.6% Support to entrepreneurship (SE) 14.06%
Cluster 3: 43 institutions (15.95%)
Presence of Absence of
Promoting knowledge (PK) 70.96%
Promoting partnership and cooperation (PPC) 67.44% Orientation (Or) 58.14%
Knowledge transfer (KT) 51.6%
New product development (NPD) 37.20% Support to entrepreneurship (SE) 32.55% Managing (Mg) 27.90
Studying process (SP) 23.25%
The same occurs with ABSENCE: for example, 22 per cent of the institutions studied had no Support to entrepreneurship (SE). In this case, the goodness of the fit is minimal for the attribute Support to entrepreneurship (SE) – R2 = 0.16 – no discriminatory capacity at all. Thus the following graphic representation includes the other nine attributes, for which R2 varies between 0.74 and 0.93.
21
The indexes of innovation also show two patterns of association: the first pattern contains the following indexes PK, PPC, KT, Or, Mg and PRD (if one of them is present, it is very probable that the other ones also appear) and the second pattern is composed of the indexes of innovation NPD, AET and SP (if one of them is present, the other ones will be as well).
4.2.2. Norte
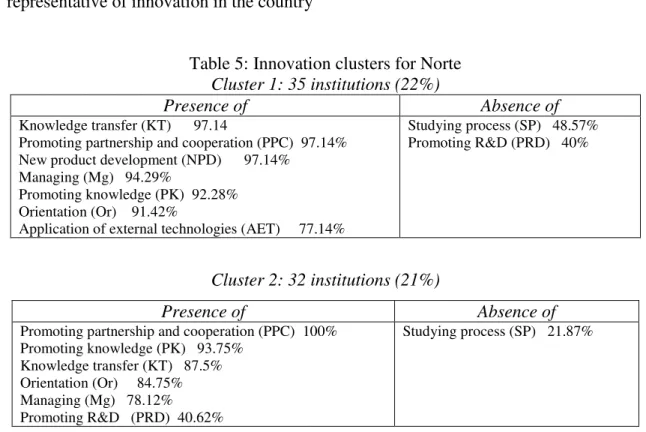
The analysis shows four clusters indicating four different innovation patterns. Cluster 4 is composed mostly of those institutions without any innovation, corresponding to 78 institutions (50 per cent of the total number of institutions in this region). In this case the goodness of the fit is 93.53, and 37 institutions (44%) belong to Cluster 4. Table 5 offers a picture of the three remaining types of innovation clusters in Norte.
The horizontal gradient is highly correlated to the indexes KT, PPC, PRD, Mg and less related to SP and PK variables. The second gradient is highly correlated to NPD, AET, and Or variables, and the SE variable also appears to be related to this second gradient, but this index has no discriminatory power between the different clusters.
The horizontal and vertical gradients have the same structures of variables in the global analysis and in the case of Lisbon – probably because this region is the most representative of innovation in the country
Table 5: Innovation clusters for Norte
Cluster 1: 35 institutions (22%)
Presence of Absence of
Knowledge transfer (KT) 97.14
Promoting partnership and cooperation (PPC) 97.14% New product development (NPD) 97.14%
Managing (Mg) 94.29%
Promoting knowledge (PK) 92.28% Orientation (Or) 91.42%
Application of external technologies (AET) 77.14%
Studying process (SP) 48.57% Promoting R&D (PRD) 40%
Cluster 2: 32 institutions (21%)
Presence of Absence of
Promoting partnership and cooperation (PPC) 100% Promoting knowledge (PK) 93.75% Knowledge transfer (KT) 87.5% Orientation (Or) 84.75% Managing (Mg) 78.12% Promoting R&D (PRD) 40.62% Studying process (SP) 21.87%
22
Cluster 3: 11 institutions (7%)
Presence of Absence of
Promoting knowledge (PK) 90.90 % New product development (NPD) 90.90% Orientation (Or) 72.72%
Application of external technologies (AET) 63.63% Studying process (SP) 54.54%
Promoting partnership and cooperation (PPC) 27.27% Knowledge transfer (KT) 27.27%
Managing (Mg) 27.7%
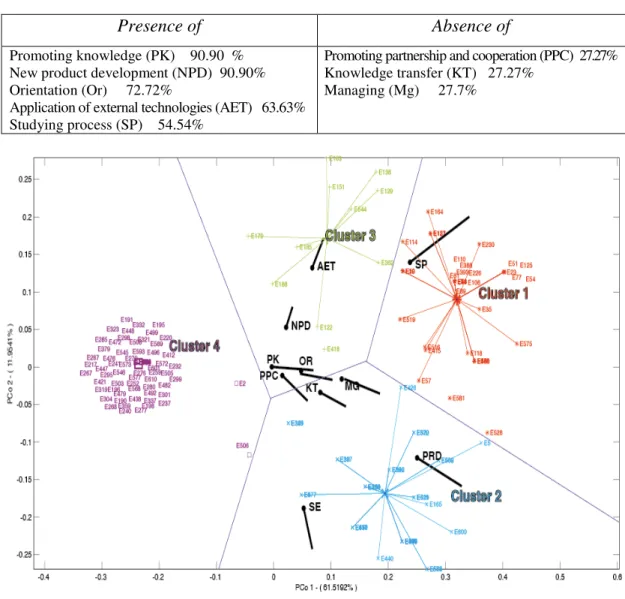
Figure 6: Structure of innovation for Norte
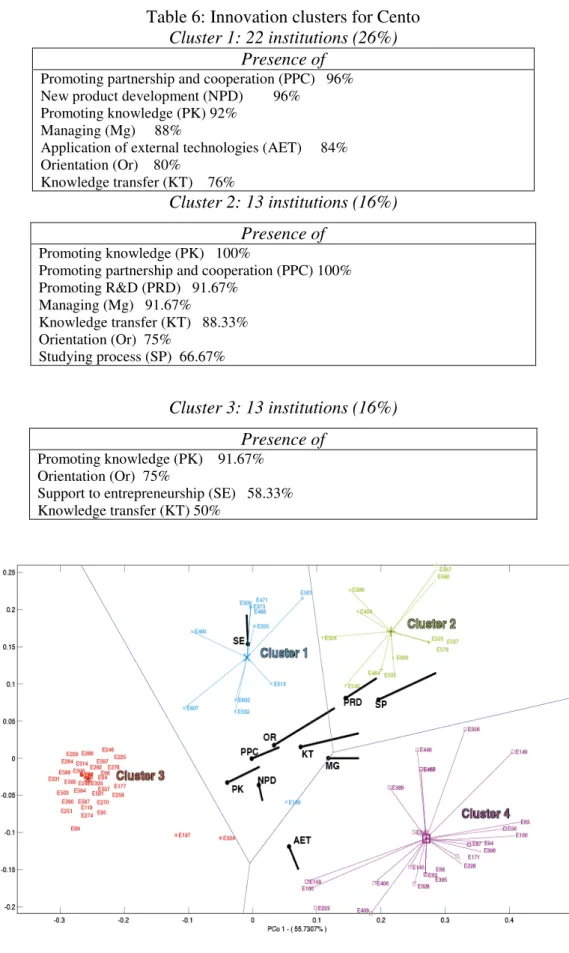
4.2.3. Centro
The analysis shows again four clusters indicating four different innovation patterns. Cluster 4 is composed mostly of those institutions without any innovation. The remaining three clusters are composed of those institutions that innovate (higher gradient of innovation), but for each cluster the attributes combine differently (see Table 6).
The horizontal gradient is slightly different from the one found in Lisbon. The North region has a high correlation to the indexes PPC, PRD, Mg and PK and is less correlated to KT, SP and OR. The second gradient is highly correlated with NPD, AET and SE indexes. The SE index has no discriminatory capacity in the case of Lisbon, but
23
it does have this in the Centro Region. In this case, the goodness of the fit is 93.53 per cent.
Table 6: Innovation clusters for Cento
Cluster 1: 22 institutions (26%) Presence of
Promoting partnership and cooperation (PPC) 96% New product development (NPD) 96%
Promoting knowledge (PK) 92% Managing (Mg) 88%
Application of external technologies (AET) 84% Orientation (Or) 80%
Knowledge transfer (KT) 76%
Cluster 2: 13 institutions (16%) Presence of
Promoting knowledge (PK) 100%
Promoting partnership and cooperation (PPC) 100% Promoting R&D (PRD) 91.67% Managing (Mg) 91.67% Knowledge transfer (KT) 88.33% Orientation (Or) 75% Studying process (SP) 66.67% Cluster 3: 13 institutions (16%) Presence of Promoting knowledge (PK) 91.67% Orientation (Or) 75%
Support to entrepreneurship (SE) 58.33% Knowledge transfer (KT) 50%
24
5. Conclusions
Our conclusions provide clear answers to the previously defined research questions. Firstly, it was possible to observe individual institutional profiles towards innovation and relate these to a set of profiles of other nearby located companies either at national, regional or cluster level. The resulting comparative analyses allow us to provide an operational instrument to classify and identify innovation from an inter-relational, multi-vectorial, and more systemic perspective – a heterodox innovation measure that makes it possible to reproduce the structure of innovation in systems, both at national and regional levels, perceiving the relative positioning of each institution in a general context.
Secondly, on the basis of the detected individual institutional profiles, it was possible to estimate quantitatively the major characteristics of regional innovation systems or, at least, to define quantitatively regional innovation patterns as bases of such structures of interaction. The presented graphs illustrate that the application of a Logistic Biplot methodology to the institutional databases resulted in distinct structures that reflect diverse forms of institutions to combine attributes of innovation and, in general, of systems (national, regional or clusters) to combine individual institutional
profiles, so that for each system its own pattern of innovation appears to emerge13.
The method was also applied at regional level in Portugal, in order to detect the way how the attributes combined per region. Regional patterns and regional structures
of innovation could in this way be identified. When considering the relation of the
variables/attributes to the innovation gradient, we are able to conclude that, for Portugal, in general, the attributes ‘Promoting knowledge’, ‘Managing’, ‘Promoting R&D’, ‘Knowledge transfer’, ‘Promoting partnership & cooperation’ and ‘Orientation’ are the most influential ones. For each region, we can evaluate the importance of each attribute for the set of institutions and, thus supplying material for regional development policy considerations. The application of the Biplot Method to the Portuguese regional scene also confirmed that in those cases of higher institutional innovation, a greater variety of
13 In other words, the two-dimensional PCoA solution accounts for the main interpretation of the variation
patterns related to the data set used. The dimensions of the solutions can be interpreted as innovation gradients, which are useful to classify the institutions according to their degree of complex characteristics
leading to innovation. The sets defined from such complex characteristics are designated by structures of innovation – they have been illustrated graphically.
25
attributes could be observed. Not all the attributes are apparently used with the same intensity: either they are not easily available – for various reasons institutions are not able to absorb them – or there is a different elasticity for each attribute – this topic asking for further investigation.
By detecting the types of structures underlying the institutions in Portugal, many advantages and fragilities may be identified and clearly interpreted, both from a micro- and a macro-economic view. For Portuguese policy makers, some lessons can be derived, such as a total geographical asymmetric use of attributes by institutions (the marked lack of innovative performances in the southern part of the country, not allowing to apply the method to Algarve and Alentejo due to the lack of statistically significant observations), and, massive concentrations of the most innovative performances in the Lisbon and Porto areas. The reasons to justify such contrasts may be identified at cluster level or by region, while solutions may be identified after detailed individual institutional profile analyses and application of specific actions.
A novel element of this paper is the presented Biplot method. This approach may be more elaborated and worked out as a future model, but its strength lies in the fact that for policy makers and planners a close observation of the regional representations may be able to suggest focused measures required to act directly on each described attribute, thus facilitating the design of future tailor-made policies. Thus, the results obtained in our study open also the possibility for assessment and evaluation of public support systems for regional development (Nijkamp 2009) – a topic which nowadays is very relevant in the context of restrict public financial supports to growth.
In addition, managers and executives in companies or other institutions can compare their individual profiles, represented in a geometrical location, with that of the system’s average using a statistical tool to reinforce specific measures and to improve their relative position, – for instance, by strengthening some of the weaker attributes. Finally, this method provides a systematic empirical basis for a solid and informed discussion on regional cluster-architecture to help focus policies for regional development.
Clearly, the Biplot method has also limitations. As pointed out earlier, the analysis is static and needs therefore an extensive enquiry among companies. This restriction imposes the use of fast gathering of data. In our case, a content analysis of companies’ web pages has been chosen, which may be considered a limitation, if the goal of the study is to determine the most adequate tailor-made policy for the region. A mature
26
analysis calls for a more comprehensive data collection. Another limitation is that direct links between companies cannot be reliably identified. Therefore, a further complement to our study by means of social network analysis may also be useful for a better understanding of the innovation system in the country or its regions.
Acknowledgements
This paper was supported by grant: PTDC/CS-GEO/102961/2008, Portuguese Science Foundation for Science and Technology (FCT). We are very grateful to two anonymous referees whose comments significantly improved the quality of this paper.
References
Acs, Z. (2002). Innovation and the Growth of Cities, Edward Elgar, Cheltenham
Acs, Z. and D.B. Audretsch (1984). Small Business in Industrial Economics: The New Learning, Revue
d'Economie Industrielle, no. 7, pp. 21-39
Albino, V., Garavelli, A.C., Schiuma, G. (1999). Knowledge Transfer and Inter-firm Relationships, Industrial districts: the role of the leader firm, Technovation, vol. 19, no. 1, pp. 53-56
Arrow, K.J. (1962). The Economic Implication of Learning by Doing, Review of Economic Studies, vol. 29, no. 3, pp. 155-173
Arthurs, D., Cassidy, E., Davis, C., Wolfe, D.A. (2009). Indicators in Support of Innovation Cluster Policy, International Journal of Technology Management, vol. 46, nos 3-4, pp. 263-279.
Audretsch, D. (2002). The Innovative Advantages of US Cities, European Planning Studies, vol. 10, no. 2, pp. 165-176
Audretsch, D. and Lehmann, E. (2006). The Role of Clusters in Knowledge Creation and diffusion: an institutional perspective, in: B. Asheim, P. Cooke, Ron Martin (eds.), Clusters and Regional
Development: critical reflections and explorations, Routledge, New York, pp. 188-198
Audretsch, D., Keibach, M. and Lehmann, E. (2006). Enterpreneurship and Growth, Oxford University Press, Oxford
Birchall, D., Tovstiga, G., Morrison, A., Gaule, A. (2004). Innovation Performance Measurement, Report by Grist Limited, ISBN: 0-9542799-7-2, London.
Caraça, J., Lundvall, B-Å, Mendonça, S. (2009). The Changing Role of Science in the Innovation Process: from Queen to Cinderella? Technological Forecasting & Social Change, vol. 76, pp. 861-867.
Cooke P., Braczyk, H.I., Heidenreich, M. (eds) (2004). Regional Innovation Systems: The Role of
Governances in a Globalized World, 2nd Edition, Routledge, London.
Davis, C. (2008). Structural Model of a Regional Information Technology Innovation Cluster, paper presented at the 25th Celebration DRUID Conference on Entrepreneurship and Innovation – Organizations, Institution, Systems and Region, Copenhagen, CBS, Denmark, June 17-20, 2008. Davis, C. H., Schaefer, N.V. (2003). Development Dynamics of a Startup Innovation Cluster: the ICT
Sector in New Brunswick, in: D. Wolfe (ed.), Clusters Old and New: the Transition to a
Knowledge Economy in Canada’s Regions, McGill, Queen’s University Press, Montreal, pp.
12-160.
Demey, J.R., Vicente-Villardón, J.L., Galindo, M.P., Zambrano, A.Y. (2008). Identifying Molecular Markers Associated with Classifications of Genotypes by External Logistic Biplot, Bioinformatics, vol. 24, pp. 2832.
Doloreaux, D. (2002). What we should know about Regional Systems of Innovation, Technology in
Society, vol. 24, pp. 243-263, www.elsevier.com/locate/techsoc
Etzkovitz, H., Leydesdorff, L. (1998). The Triple Helix as a Model for Innovation Studies, Science and
Public Policy, vol. 25, no. 3, pp. 195-203.
Fagerberg, J. (1987). A Technology Gap Approach to why Growth Rates differ, Research Policy, vol. 16, pp. 87-99.
Fagerberg, J. (1988). Why Growth Rates Differ, in: G. Dosi, C. Freeman, R. Nelson, G. Silverberg, and L. Soete (eds), Technical Change and Economic Theory, Pinter, London, pp. 432-57.