Celeste Gameiro1[0000-0001-9581-3968], Manuela Rosa2[0000-0001-5017-3913], Carlos Sousa 1[0000-0002-2513-3251] and Ilídio Mestre3[0000-0001-7426-4736]
1 Center for Heritage, Landscape and Construction Studies & Engineering Institute, Univer-sity of Algarve, Portugal
2 Centre for Spatial and Organizational Dynamics, & Engineering Institute, University of Algarve, Portugal
3 Engineering Institute, University of Algarve, Portugal
Abstract. The present work is part of the Project for Scientific Research and Technological Development "Accessibility for All in Tourism" focuses on modal interfaces designed according to the concepts of "Universal Design" and "Age Sensitive Design". In this project 851 surveys were carried out for elderly tour-ists, who arrived in Algarve (Portugal) through the international Airport of Faro, in the summer of 2018, with a view to understanding their preferences and needs in terms of mobility. It presents the characterization of the senior tourist in Al-garve, according to: gender, age, academic qualification, situation in the relation to the profession, nationality, disability and/or disabilities that affects mobility and the need to use technical aids to move. It analyses and compares, from the point of view of sustainable mobility, the mobility of the elderly tourist, by gen-der and age group, in the country where they reside and in the Algarve region. This information is useful for local authorities and for transport operators in order to make the mobility of elderly tourists, in Algarve, more sustainable from a so-cial, economic and environmental standpoint.
Keywords: Elderly Tourist, Sustainable Mobility, Faro.
1
Introduction
Postmodern society is demanding sustainability and quality of life, economic viability, accessibility, social equity, health and environmental quality. These attributes are es-sential in the planning and management of mobility systems, and they are particularly important for the sustainability of territories and for the tourism activity in particular.
In European Union a diversity of measures has been promoted to attend sustainable mobility with emphasis to different means of transport (e.g. public transport, walking, cycling), innovative technologies of clean energy for vehicles, intramodality between means of transport (valuing of interfaces), measures of transport demand management through information and communication technologies.
These are consensual with the current strategies of low carbon economy towards the eco-innovation and eco-efficiency.
In the Region of Algarve (Portugal) there is, still, excessive dependence on the road-way transport and on the use of individual cars, some weaknesses in the intramodality of different means of transport, and insufficient development of others means of transport (vehicle or non-vehicle - such as walking- used for travelling), namely, the train. These problems are perceived by regional institutions and enterprises related with tourism and at Faro International Airport, in particular.
The present Strategic Plan of Transport and Infrastructures 2014-2020 (Plano Estra-tégico dos Transportes e Infraestruturas 2014-2020) presents a long-term vision of the transport system and infrastructures [1]. Along other aims, it considers that the need of these constitutes a competitive advantage in the tourism sector (both in the international and internal connections) and that transport network and infrastructures must reach the whole national territory, being inclusive and intermodal, and benefiting the social and territorial cohesion.
The present Action Plan for the Development of Tourism in Portugal (Plano de Ação para o Desenvolvimento do Turismo em Portugal) presents, as opportunity, the current ageing of the population that potentiates senior tourism [2]. There are favourable con-ditions to the development of the senior segment in sport and health tourism.
The World Health Organization regards active ageing as a lifelong process shaped by several factors (e.g. transportation) that, alone and acting together, favour health, participation and security in older active life [3].
The Research Project ACCES4ALL - Accessibility for All in Tourism focuses on modal interfaces designed according to the concepts of "Age Sensitive Design". Its main objective is to develop a pilot study of an accessible, smart and sustainable bus stop to be located at Faro International Airport.
The increasing socioeconomic importance of senior tourism in the Algarve region, coupled with the sustainability requirements that tourism must fulfil, requires a closer look of the mobility and accessibility needs of the tourist elderly people having func-tional diversity (related with sensorial, intellectual and / or physical difficulties), as such, it is considered useful to relate the characteristics of these users with their modal choices.
In the scope of the Project ACCES4ALL, surveys were carried out on elderly tourists to understand their perceptions about built environments, and to know their mobility patterns.
The main objective of the present communication is to analyse and compare the mo-bility habits of the elderly tourists who visit the Algarve region. It is essential to know, in terms of mobility, their needs and preferences and relate them to age and gender. This information is useful for local authorities and transport operators in order to make their mobility in Portugal more sustainable.
It is intended to understand how modal choice changes with gender and aging, fo-cusing the study on the age groups of 60-64 years, 65-69 years, 70-74 years, 75-79 years, 80-84 years and older than or equal to 85 years.
The characterization of the senior tourist, which arrived in Algarve through Faro International Airport, is done according to gender, age group, academic qualification, status in employment, nationality, country and city of residence, problems affecting mobility and the necessity to use technical aids to move.
In order to achieve the objectives, the SPSS Statistical package was used, and infor-mation from the various data is cross-referenced.
2
Mobility Patterns of the Elderly
Aging is a normal dynamic process that is accompanied by biological, psychological and social changes in the elderly, which have implications on their functional and motor capacity. Effectively, functional capacity (eg, muscle strength) at a certain point in peo-ple's lives declines, a situation that is related to factors associated with lifestyle, but also to external social, environmental and economic factors [4].
Analysing mobility surveys carried out in the European Union [5] considering peo-ple 55 years of age or older, 44.8% use the car ( in the 40-54 age group 61.3%), 20.8% use the public transport (in the 40-54 age group they use it 14.1%), 19.3% walk (in the age group 40-54 they walk 13.0%) and 0.8% use a motorcycle (in the age group of the 40-54 they use it 1.7%), among other means. In other words, there is a trend towards a reduction in the use of car and motorcycle, an increase in walking and in the use of public transport. This study refers that non-motorized individual transportation (walk-ing and cycl(walk-ing) was more popular among the sociodemographic groups of women, the oldest generation, those with the lowest level of education, citizens in other cities, those without any professional activity, those who do not have a car, and those who are not the primary driver of their household car. Public transport is more likely to be used by women (see Table 1), the youngest generation, those still in school, residents of metro-politan areas and those who do not have a car at their disposal. It is less often used by men, those aged 40-54, those living in a rural zone, the self-employed and obviously, the “primary car users".
Table 1. The main means of transport in European Union
Car % Public Transport % Walking % Cycling % Motorbike % Other % No daily regular mobility % “Don't Know” EU27 51.4 20.6 14.7 8.7 1.8 1.6 1 0.1 SEX Male 57.5 18 10.2 8.3 3.3 1.9 0.7 0.1 Female 45.8 23.1 18.8 9.1 0.5 1.3 1.3 0.1 AGE 15-24 29.8 38.6 13.8 11.6 4.6 1.5 0.2 0 25- 39 61.9 16.9 11 6.7 1.7 1.3 0.4 0.1 40-54 61.3 14.1 13 7.6 1.7 1.4 0.7 0.1 55 + 44.8 20.8 19.3 10 0.8 2 2.1 0.1
Other international studies have shown that mobility decreases with increasing age [6] [7] and that as people become older they choose to slow down driving [8]. Existing studies have demonstrated that the elderly with a higher level of education travel more frequently and tend to use public transport [9].
But are those travel means of seniors the same in a context of tourism?
Demographic change is one of the external factors that is influencing tourist demand and develop this sector in the medium and long term. Senior tourism will become a growing segment in the tourism market [10]. This is also associated with a change in travel behaviour, as senior tourists prefer lower seasonality, more car journeys, more cultural tours and journeys with a focus on health and nature [11].
In fact, the overall potential of public transport as an alternative mean for travelling is unclear, given tourist motivations and behaviours, and provision of visitor oriented public transport services need for appropriate communication and social marketing strategies [12].
A study conducted in Spain concluded that the tourists who arrived by plane used public transport most [13].
3
Case Study: Transportation Usage Patterns of the Elderly
Tourists in Algarve and in their country
3.1 Data collection
There is an increasing need for relevant information to be collected on tourist mobility so that the tourism policies linked to the specific road transport activity can be properly monitored to achieve sustainability.
Tourist road mobility statistics are not currently part of the National Statistical Sys-tem. There is no regular and harmonized data collection in the field of tourist road traf-fic statistics as already exists for general road vehicles.
In the scope of the Project ACCES4ALL, surveys were carried out on elderly tourists to understand their perceptions about built environments and to know their mobility patterns.
Thus, a survey was developed for the elderly tourist aged 60 or over. It was awarded to a local company to carry out the surveys at the Airport. Inquiries were made in board-ing rooms. There was initially a pilot survey done by a student of the degree in Tourism who conducted 50 surveys. During the survey the interviewers used photographs to elucidate elderly tourists about the technical aspects. The questionnaires contain four sets of questions: information about the respondent, characterization of their mobility where they live and in the Algarve region (as tourists), information on the perception of universal accessibility conditions in bus stops, and their use of information and com-munication systems and technologies. Then, data were introduced in an electronic file.
The number of elderly tourists visiting Portugal using Faro airport is high, according to data given by VINCI Airports/ANA Aeroportos de Portugal. In the summer of 2018, 7% of passengers were over 60 years old. In that year, in August, 1 156 279 passengers
were registered of which 80 940 were elderly, and in September there were 1 090 104 passengers of whom 76 307 are elderly.
In this survey with a population size of 157247, for a 95% confidence level and approximately 3,4% degree of accuracy (percentage of maximum error required) we get a sample size of inquiries equal to 851.
Inquiries, totalling 851, were conducted randomly at Faro International Airport, at waiting area, before departure. Questionnaires were done through face-to-face inter-views using paper-and-pencil, in the months of August and September of 2018.
3.2 Characterization of elderly tourists at Faro International Airport
From the analysis of the responses to the survey, relevant information was obtained for the characterization of elderly tourists, namely: gender, age, personal qualification, oc-cupation, country of residence, city or town where they reside, disabilities affecting mobility and technical aids necessary to move.
The tourists surveyed came from over 30 countries around the world, but mainly from Europe, including the United Kingdom 340 individuals (40.6%), Germany 116 (13.8%), Ireland 72 (8.6%), France 65 (7.8%) The Netherlands 38 (4.5%), Italy 28 (3.3%) and Belgium 27 (3.2%). Most respondents live in a city 605 (75.3%), which is an important fact in terms of representativeness of the sample, the European elderly population inhabits mostly in urban areas.
Of the 851 respondents, 513 (60.3%) were elderly men, 332 (39.0%) were elderly women, 1 (0.1%) were other gender, and 5 (0.6%) did not respond. The distribution of tourists surveyed by age group and gender is shown in Table 2.
Table 2. Age and gender distribution of the elderly tourists inquired at the Faro International Airport.
Age Woman % Man % Woman+Man %
60-64 49 5.9 91 10.9 140 16.8 65-69 89 10.7 146 17.5 235 28.2 70-74 92 11.0 139 16.7 231 27,7 75-79 29 3.5 71 8.5 100 12.0 80-84 25 3.0 31 3.7 56 6.7 +85 41 4.9 31 3.7 72 8.6 Total 325 39.0 509 61.0 834 100.0
Source: Authors’ elaboration.
Knowing that some of the respondents do not answer some of the questions it is appar-ent that in these cases there is a sample below 851 (total number of surveys). This situ-ation is always worsened when the intersection of answers is necessary. However, as the number of responses is still representative what was done was to present the uni-verse of answers to each question and to recalculate the percentages.
The age group with more men is 65-69 years and for women it is 70-74 years. Most elderly tourists are aged between 65 and 74 years 466 (55.9%).
In personal qualification (levels of education and / or degree) four options were con-sidered: elementary or basic, secondary, medium or professional, or higher. In the an-swers obtained (see Fig.1) it can be verified that in any age group the predominant qualification is medium or professional level. It should be noted that from the age group of 60 to 69 the second level of education that predominates is the higher level and from the age of 70 the second level of education that predominates is the secondary level.
Fig. 1. Level of education of elderly tourists. Source: Authors’ elaboration.
In relation to the situation in the profession and within the five questions of choice: full-time active, partial full-time active, unemployed, retired or not able to work, the results are found in Table 3.
Table 3. Professional situation at the moment Professional situation Number of elder persons %
Full time work 181 21.7
Partial time work 36 4.3
Unemployed 15 1.8
Retired 586 70.3
Not fit to work 16 1.9
Total 834 100
Source: Authors’ elaboration.
0,0 0,6 0,2 0,1 0,4 1,0 3,0 4,3 6,8 5,0 2,7 1,7 7,2 17,1 16,4 5,6 2,9 5,0 6,4 5,8 4,6 1,5 0,9 0,9 0,0 2,0 4,0 6,0 8,0 10,0 12,0 14,0 16,0 18,0 60 to 64 65 to 69 70 to 74 75 to 79 80 to 84 >85 P er ce nt ag e of e ld er ly to ur is ts Age range Basic Education Secondary School Vocacional/Technical training Higher (Tertiary) Education
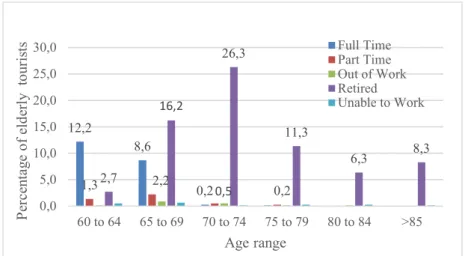
As it would be expected, due to old age, the situation in the profession for these is mostly retired 586 (70.3%). Only 181 (21.7%) are still full-time active, and the situation of unemployed or unfit to work is low, 1.8% and 1.9%, respectively. The situation in the profession varied with the age group as Fig. 2 shows. The age groups that have individuals working full-time are mainly the first two age groups.
Fig. 2. Professional or employment status of the elderly tourists. Source: Authors’ elaboration.
In the aging process, there are disabilities that affect mobility and condition the modal choices of these elderly people and their companions (family or friends). Disability cases may be related to problems: motor, visual, deafness, orientation and / or other health problems. 25.6% of the respondents assumed having disabilities that affect their mobility.
In the inquiries a question was raised “Do you have limitations in the use of public transport?” and 256 (30.1%) of the respondents responded that they have limitations in the use of public transport. This percentage is high and corresponds to an important condition for using this kind of transport. The limitations mentioned are: 142 (55.5%) have difficulty walking; 135 (52.7%) difficulty climbing stairs; 33 (12.9%) have diffi-culty staying upright; 33 (12.9%) have hearing problems; 29 (11.3%) have visual prob-lems; 12 (4.7%) difficulty in holding or manipulating objects. 12 (4.7%) travel with a wheelchair and 8 (3.1%) use a mobility scooter. It is important to mention that a large part of the elderly mentioned more than one limitation, being acceptable that those who have difficulty walking also have difficulty in climbing stairs.
3.3 Transportation usage patterns of the elderly in the country where they live
As previously mentioned, one of the goals of the present study is to know the modal choices and respective frequencies of use by the elderly in their daily life in the country
12,2 8,6 0,2 1,32,7 2,2 0,5 0,2 16,2 26,3 11,3 6,3 8,3 0,0 5,0 10,0 15,0 20,0 25,0 30,0 60 to 64 65 to 69 70 to 74 75 to 79 80 to 84 >85 P er ce nt ag e of e ld er ly t ou ri st s Age range Full Time Part Time Out of Work Retired Unable to Work
where they reside. This analysis is done by age and gender. Some results related to sustainable mobility are presented.
Respondents were asked to indicate how often (almost daily, several times a week, occasionally or twice a month or never) they use the various means of transport. Table 4 shows the results of all responses regardless of age or gender.
Table 4. Daily trips done on the incoming country.
Almost daily Several times per week Twice a month or
sometimes Never Total On foot
alone - travel, not
exercise 113 18.4% 158 25.7% 111 18.1% 232 37.8% 614 100% with friends or family 68 11.7% 160 27.5% 158 27.1% 196 33.7% 582 100% Car driver 322 42.5 % 151 19.9 % 79 10.4% 205 27.1% 757 100% passenger 228 36.5% 131 21.0% 162 25.9% 104 16.6% 625 100% Bus alone 56 8.8% 150 23.6% 182 28.7% 247 38.9% 635 100% with friends or family 34 5.7% 121 20.3% 177 29.6% 265 44.4% 597 100% Train alone 14 2.4% 32 5.5% 227 38.7% 314 53.5% 587 100% with friends or family 9 1.6% 26 4.5% 300 51.7% 245 42.2% 580 100% Tramway or metro alone 29 5.3% 46 8.4% 60 11.0% 411 75.3% 546 100% with friends or family 18 3.4% 35 6.5% 74 13.8 % 408 76.3% 535 100% Taxi/Uber or shuttle alone 49 7.8% 98 15.5% 284 44.9% 201 31.8% 632 100% with friends or family 52 8.6% 102 16.8% 318 52.7% 131 21.7% 603 100% Chauffer or personal service
18 3.4% 14 2.6% 32 6.0% 470 88.0 % 534 100% Bicycle 11 2.0% 13 2.4% 23 4.3% 490 91.2% 537 100% Motorcycle 15 2.8% 4 0.7% 24 4.5% 491 91.9% 534 100% Source: Authors’ elaboration
On daily trips there is a revealed preference for the individual means of transport (car and foot). The most used means of transport is the car, as driver, 322 elderly (42.5 %) followed by the car, as passenger, 228 elderly (36.5%), and only then walk alone: 113 elderly (18.4%), and walking accompanied by friend or family member: 68 elderly
(11.7%). Within collective transportation the most preferred revealed was the bus (alone): 56 elderly (8.8%).
On trips made several times a week (but not every day) there is a revealed preference for the individual transport means (on foot and by car). The most commonly used means of transport is walking accompanied by a friend or relative, 160 elderly people (27.5%) followed by walking alone 158 elderly (25.7%) only then the car as driver 151 (12.2%) followed by bus alone 150 elderly (23.6%).
On trips made occasionally or twice a month there is a revealed preference for public transport, particularly, taxi/uber or similar (accompanied by friend or family) with 318 elderlies (52.7%) followed by train (accompanied by friend or family) with 300 elderlies (51.7%).
It should be noted that less frequent trips are more environmentally sustainable be-cause they are mostly in collective transportation and are often carried out with the company of a family member or friend.
The modal choice was analysed according to age, with focus on walking and public transport (only bus) as these are sustainable means. The analysis has also considered the use of the car by elderly people to understand its use according to age.
In relation to walk alone in order to travel (but not for do exercise) the results of Fig. 3 were obtained, and for walk with a friend or relative the results are in Fig.4.
Fig. 3. Walk alone in daily activities in their country. Source: Authors’ elaboration.
3,8 4,5 4,1 3,6 1,5 0,2 4,5 8,9 7,4 3,8 1,2 0,2 2,6 4,1 7,3 2,0 1,0 1,0 3,8 7,3 10,2 4,5 4,3 8,3 0,0 2,0 4,0 6,0 8,0 10,0 12,0 60 to 64 65 to 69 70 to 74 75 to 79 80 to 84 >85 P er ce nt ag e of e ld er ly to ur is ts Age range Almost daily Several times a week Occasionalty or twice a month
Fig. 4. Frequency of walk with friends or family in daily activities in their country. Source: Authors’ elaboration.
Only 17.7% of the elderly say they travel on foot daily alone. Considering that 75.3% of these elderly people live in a city, the number who affirm "never” taking a walking trip alone is high (37.8%).
In the process of aging, “never walk alone” prevails after the age groups 80 to 84 (including), and “never walk with friends or family” prevails only after 85 years. We con-clude, therefore, that from the 80 years of age, when traveling on foot, the elderly chooses to travel on foot accompanied by friends or family.
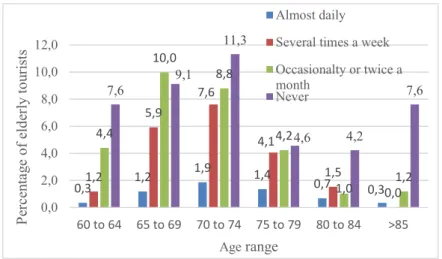
From the point of view of sustainable mobility, it is important to use collective transport, namely, the bus to the detriment of the automobile as driver. It was found that the elderly tourists in their daily activities in their country use with some regularity this means of transport. See Fig. (5 and 6)
Fig. 5. Frequency of use bus alone in daily activities in their country. Source: Authors’ elaboration.
2,4 3,0 3,0 1,9 1,2 0,3 3,6 9,2 8,0 4,7 1,0 0,7 4,2 5,7 8,7 3,3 2,4 2,6 4,3 6,9 9,7 3,3 3,5 6,3 0,0 2,0 4,0 6,0 8,0 10,0 12,0 60 to 64 65 to 69 70 to 74 75 to 79 80 to 84 >85 P er ce nt eg e of e ld er ly to ur is ts Age range Almost daily Several times a week
Occasionalty or twice a month Never 1,4 2,2 3,0 1,3 0,6 0,2 2,5 7,9 8,6 3,5 1,1 0,0 4,9 9,4 8,9 4,3 0,8 0,5 4,6 8,6 9,0 4,0 4,6 8,1 0,0 2,0 4,0 6,0 8,0 10,0 60 to 64 65 to 69 70 to 74 75 to 79 80 to 84 >85 P er ce nt ag e of e ld er ly to ur is ts Age range Almost daily Several times a week
Occasionalty or twice a month Never
Fig. 6. Frequency of bus use with friends or family in daily activities in their country. Source: Authors’ elaboration.
A significant number of elderly people travel by bus alone daily or several times per week: 204 (32, 4%). There is also a frequent search (daily or several times a week), equally relevant, for the elderly who travel by bus accompanied by friends or family, with 154 (26%) of the elderly to choose this means. The age group that most uses buses is 70 to 74 years, followed by 65 to 69 years of age.
It is important to emphasize that many of these seniors are people who, although not working, continue to travel (alone or accompanied), which in itself is a sign of quality of life.
At this point it is important to know how the use of the car (as a driver and as a passenger) change according to age group (see Fig.7 and Fig. 8).
Fig. 7. Frequency of the use of the car as a driver in daily activities in their country Source: Authors’ elaboration.
0,3 1,2 1,9 1,4 0,7 0,3 1,2 5,9 7,6 4,1 1,5 0,0 4,4 10,0 8,8 4,2 1,0 1,2 7,6 9,1 11,3 4,6 4,2 7,6 0,0 2,0 4,0 6,0 8,0 10,0 12,0 60 to 64 65 to 69 70 to 74 75 to 79 80 to 84 >85 P er ce nt ag e of e ld er ly to ur is ts Age range Almost daily Several times a week Occasionalty or twice a month Never 11,5 15,9 7,9 4,7 1,9 0,5 2,5 6,4 8,0 2,1 0,5 0,4 0,8 2,7 4,4 1,3 0,7 0,5 2,3 3,7 6,8 4,0 4,0 6,4 0,0 5,0 10,0 15,0 20,0 60 to 64 65 to 69 70 to 74 75 to 79 80 to 84 >85 P er ce nt ag e of e ld er ly to ur is ts Age range Almost daily Several times a week Occasionalty or twice a month
42,5% of elderly use the car as a drive, in daily activities in their country, however the number of elderly driving a car decreases greatly with age.
There is, clearly, a preference for the car as a driver from the age of 60 to 69. Never driving a car predominates from the age range of 80 to 84 (including). With the aging, and consequently with the loss of autonomy, it is vulgar to resort to the help of third parties in the realization of trips.
Fig. 8. Frequency of car travel as a passenger, with a friend or relative, in daily activities in their country. Source: Authors’ elaboration
It turns out that these elderly people have shown preference for traveling, almost daily, by car with a friend or relative. Traveling by car accompanied by acquaintances is the choice that prevails from the 85 years of age. It should also be noted that the most commonly mentioned means of transportation, such as never before used, were the mo-torcycle (491 elderly or 91.9%) and the bicycle (490 elderly or 91.2%).
In order to compare the sustainability of journeys by men and women, the study of trips carried out on a daily basis in three means of transport (car, pedestrian and bus) was preceded.
Table 5. Main mean of transport for almost daily trips.
Types of transport Number elderly man % of man Number elderly woman % of woman Number elderly Total % Total Car (driver) 240 51.1 81 28.7 322 42.8 Car (passenger) 99 28.6 127 46.2 226 36.4
On foot (alone – in order to
travel, not exercise) 47 13.9 66 24.4 113 18.5
On foot (with friends or
family) 31 9.6 37 14.6 68 11.8
Bus (alone) 18 5.0 38 14.2 56 8.9
Bus (with friends or family) 12 3.6 22 8.7 34 5.7 Source: Authors’ elaboration.
3,4 7,9 9,2 4,5 3,9 7,9 3,4 6,1 6,0 2,4 1,8 1,0 3,9 5,3 7,9 4,4 2,3 2,1 2,7 5,0 5,8 2,4 0,3 0,5 0,0 2,0 4,0 6,0 8,0 10,0 60 to 64 65 to 69 70 to 74 75 to 79 80 to 84 >85 P er ce nt ag e of e ld er ly to ur is ts Age range Almost daily Several times a week Occasionalty or twice a month
The results clearly reflect the greater sustainability of the trips made by the elderly women in relation to the elderly men. 51.1% of men use the car as a driver, almost daily, while women use 28.7%, almost daily. The percentage of older women who travel on a daily basis on foot or by bus (alone or with a partner) is higher than that of older men.
3.4 Transportation usage patterns of the elderly tourists in Algarve
One of the questions asked to the elderly tourists was "During your stay in Algarve, which types of transport did you use?" The choices were: on foot, own car, rental car, organized transfer from the airport to the accommodation, accommodation for the air-port, bus or similar - public transair-port, Bus or similar - private transair-port, train, taxi / uber, bicycle, motorcycle or motorcycle.
Table 6. Means of transport frequently used by elderly tourists in the Algarve Region by gender. By foot Car rental Bus or shuttle Taxi/Uber
No Yes No Yes No Yes No Yes
Man 380 74.1% 133 25.9% 354 69.0% 159 31.0% 509 99.2% 4 0.8% 299 58.3% 214 41.7% Woman 258 77.7% 74 22.3% 222 66.9% 110 33.1% 327 98.5% 5 1.5% 175 52.7% 157 47.3% Source: Authors’ elaboration.
Women report similar percentages of traveling on foot, in the area of residence and in Algarve, however, men walk a lot more in Algarve than in their area of residence. Men in Algarve, compared to women, walk more and rent fewer cars. This fact is important because it reveals more sustainable options from the point of view of mobility on the part of men (a phenomenon contrary to the region where they live). However, both have less sustainable mobility in Algarve than in the region of residence, they practically do not use the bus and the train. They use more taxi / uber and the organized transfer as it can be seen in Table 7 and Fig. 9.
Table 7. Transfers booked in advance by elderly tourists by gender. Transfers booked in
ad-vance
(Airport-Accommodation)
Transfers booked in ad-vance (Accommodation-Airport) No Yes No Yes Man 314 (61.2%) (38.8%) 199 (63.4%) 325 (36.6%) 188 Woman 226 (68.1%) (31.9%) 106 (71.7%) 238 (28.3%) 94 Source: Authors’ elaboration
A significant number of elderly tourists opt for organized transfer from the airport to accommodation 305 (36.1%) and organized transfer from the accommodation to the airport 282 (33.3%). The main reason given by the respondents for the use of the trans-fer organized between the accommodation and the airport was security. Some elderly people referred the use of wheelchair.
Taxis/uber are commonly used means of transport in Algarve by elderly tourists in all age classes. The use of at least one of these means of transport varies, in percentages and by age group, between 39.7% in class 60 to 64 years and 47.8% in class 70 to 74 years (see Fig. 9).
Fig. 9. The use of taxi/uber in the region of Algarve by the elderly tourists. Source: Authors’ elaboration
4
Conclusions
Transport is an important part of the tourism system and a big generator of greenhouse gas emissions, so it is frequently the topic of most attention in this economic activity [14].
In a context of sustainable mobility in Algarve, emphasis must be given to public transport, car sharing, walking and cycling, these both, specially, in urban areas.
Sustainable transport is essential for sustainable tourism [15]. Behavioural theories about mobility patterns suggest that modal choice is related by an individual’s socioec-onomics, demographics and attitudes. Based in a survey developed in the South West of England, Prillwitz and Barr (2011) examined sustainable transport behaviour in daily routines and on holiday and they conclude that individuals tend to care more about their environmental impacts at home than while they travel [16].
The knowledge of tourists’ use of public transport at the tourist destination is im-portant for sustainable mobility, destination satisfaction, public transport management and destination management [12].
The results of Project ACCES4ALL indicate that the elderly show significant differ-ences in the use of public transport and use public transport (bus and train) in the area of residence rather than in their stay in Algarve.
10,1 15,0 14,4 7,2 3,9 5,1 6,7 13,0 13,2 5,0 2,7 3,6 0,0 2,0 4,0 6,0 8,0 10,0 12,0 14,0 16,0 60 to 64 65 to 69 70 to 74 75 to 79 80 to 84 >85 P er ce nt ag e of e ld er ly to ur is ts Age range No Yes
In reality, in Algarve the use, by the elderly tourist, of bus and train is insignificant. They choose to use car rental, organized transfer and taxi/uber.
The results indicate a substantial change in the means of travel, especially from the age of 80, where there is a decrease in walking (alone) and from the age of 85, with a decrease in walking even when accompanied by a friend or family member.
There is a greater sustainability of mobility in women than in men, they move more by foot and public transport in their daily lives.
At the beginning of the aging process, both for women and for men, traveling with a friend or relative has a significant influence on daily travel.
It is known that outdoor spaces, buildings and transport infrastructures are funda-mental features of the physical environment of the territories, and they have a great influence on the individual mobility, independence of the elderly and quality of life [3]. Thus, in transport and mobility planning and management, approaches that meet the needs of the elderly (Age Sensitive Design) are being developed in order to enhance their quality of life, their safety and contribute to an active aging.
Acknowledgments
This Project ACCES4ALL – Accessibility for All in Tourism (SAICT-POL/23700/2016) is supported by Foundation for Science and Technology and by FEDER through Operational Programs CRESC Algarve 2020 and Norte 2020, Portu-gal.
References
1. Resolução do Conselho de Ministros n.º 61-A/2015. Plano Estratégico dos Transportes e Infra-Estruturas para o Horizonte 2014-2020 (PETI 3+), Diário da República n.º 162/2015, 1º Suplemento, Série I de 2015-08-20. (2015).
2. TURISMO 2020. Turismo 2020: Plano de Ação para o Desenvolvimento do Turismo de Portugal. Turismo de Portugal, I.P. Ministério da Economia e do Emprego. (2015). 3. WHO - World Health Organization Global age-friendly cities: a guide. World Health
Orga-nization. (2007).
4. Kalache A. & Kickbusch I.: A global strategy for healthy ageing World Health, v.4: 4 -5 (1997).
5. European Commission. (2007). Eurobarometer, Attitudes on issues related to EU Transport Policy Analytical Report, Brussels: Flash Eurobarometer.
6. Metz D H Mobility of older people and their quality of life. Transport Policy, vol.7(2): 149– 152. (2000).
7. Alsnih, R. & Hensher, D. A. The mobility and accessibility expectations of seniors in an aging population. Transportation Research Part A, vol. 37(10): 903–916. (2003).
8. Rosenbloom S. Sustainability and automobility among the elderly: an international assess-ment. Transportation, vol.28(4): 375–408. (2001).
9. Bocker, L.; Amen, P.; Helbich, M. Elderly travel frequencies and transport mode choices in Greater Rotterdam, the Netherlands. Transportation 2016.
10. OECD (2018). Tourism, trends and policies. OECD Publishing. Doi: 10.1787/tour-2018-en Available in: http://www.oecd-ilibrary.org/industry-and-services/oecd-tourism-trends-and-policies-2014_tour-2014-en
11. Grimm, B., Lohmann, M., Heinsohn, K., Richter, C. and Metzler, D.: The impact of demographic change on tourism and conclusions for tourism policy, study commissioned by the Federal Ministry of Economics and Technology, German, July 2009
12. Le-Klähn, D. & Hall, C. M.: Tourist use of public transport at destinations – a review, Journal, Volume 18, Issue 8, 2015
13. Gutiérrez, A. and Daniel Miravet, D.: The Determinants of Tourist Use of Public Transport at the Destination, Sustainability, , vol. 8, issue 9, 1-16 (2016).
14. Scott, D., Gössling, S., & Hall, C.M.: Tourism and Climate Change: Impacts, Adaptation and Mitigation, Abingdon: Routledge. (2012).
15. Filimonau, V., Dickinson, J., & Robbins, D.: The carbon impact of short-haul tourism: A case study of UK travel to Southern France using life cycle analysis. Journal of Cleaner Production, 64, 628-638. (2014).
16. Barr, S., & Prillwitz, J.: Green travellers? Exploring the spatial context of sustainable mo-bility styles. Applied Geography, 32(2), 798-809. (2012). https://doi.org/10.1016/j.jtrangeo.2011.06.011