Department of Information Science and Technology
Structured and Unstructured Data Integration with Electronic
Medical Records
Diogo Veiga Amorim Santos Baptista
A Thesis presented in partial fulfilment of the Requirements for the Degree of Master in Decision Support Systems
Supervisor:
Prof. Dr. João Carlos Amaro Ferreira, Assistant Professor ISCTE-IUL
Co-Supervisor:
Prof. Dr. Rúben Filipe de Sousa Pereira, Assistant Professor ISCTE-IUL
i
Acknowledgments
I would like to thank my supervisor Dr. João Ferreira and co-supervisor Dr. Rúben Pereira for the constant support, counselling and guidance given throughout this work, since without them this work wouldn’t have been possible.
I would also like to thank three of my closest friends Carina Abreu, Nuno Mendonça and João Silva for the support and patience to help me both technically as also motivationally.
Finally, I would like to thank my family and friends for all their love and support throughout this year, without you this wouldn’t have been the journey that it was, and I am very thankful for that.
ii
Resumo
Nos últimos anos tem-se assistido a uma grande evolução populacional e tecnológica por todo o mundo. Paralelamente, mais áreas para além da tecnologia e informática têm-se também detêm-senvolvido, nomeadamente a área da medicina, o que tem permitido um aumento na esperança média de vida que por sua vez leva a uma maior necessidade de cuidados de saúde.
Com o intuito de fornecer os melhores serviços de saúde possíveis, nos dias que hoje os hospitais guardam nos seus sistemas informáticos grandes quantidades de dados relativamente aos pacientes e doenças (sobre a forma de registos médicos eletrónicos) ou relativos à logística de alguns departamentos dos hospitais, etc. Por conseguinte, a estes dados têm vindo a ser utilizadas técnicas da área das ciências da computação como o data mining e o processamento da língua natural para extrair conhecimento e valor dessas fontes ricas em informação com o intuito não só de desenvolver, por exemplo, novos modelos de predição de doenças, como também de melhorar processos já existentes em centros de saúde e hospitais. Este armazenamento de dados pode ser feito em uma de três formas: de forma estruturada, não estruturada ou semi-estruturada.
Neste trabalho o autor testou a integração de dados estruturados e não estruturados de dois departamentos diferentes do mesmo hospital português, com o intuito de extrair conhecimento e melhorar os processos do hospital. Com o intuito de reduzir a perda do armazenamento de dados que não são utilizados.
Palavras-Chave: Dados Estruturados, Dados Não Estruturados, Processamento Natural da Língua, Integração de Dados, Registos Médicos Eletrónicos.
iii
Abstract
In recent years there has been a great population and technological evolution all over the world. At the same time, more areas beyond technology and information technology have also developed, namely medicine, which has led to an increase in average life expectancy which in turn, leads to a greater need for healthcare.
In order to provide the best possible treatments and healthcare services, nowadays the hospitals store large amounts of data regarding patients and diseases (in the form of electronic medical records) or the logistics of some departments in their storage systems. Therefore, computer science techniques such as data mining and natural language processing have been used to extract knowledge and value from these information-rich sources in order not only to develop, for example, new models for disease prediction, as well as improving existing processes in healthcare centres and hospitals. This data storage can be done in one of three ways: structured, unstructured or semi-structured.
In this paper, the author tested the integration of structured and unstructured data from two different departments of the same Portuguese hospital, in order to extract knowledge and improve hospital processes. Aiming to reduce the value loss of loading data that is not used in the healthcare providers systems.
Keywords: Structured Data, Unstructured Data, Natural Language Processing, Data Integration, Electronic Medical Records.
iv
Contents
Acknowledgments ... i Resumo ... ii Abstract ... iii Contents ... iv Index of Tables ... viIndex of Figures ... vii
List of Abbreviations ... viii
Chapter 1 – Introduction ... 1
1.1. Context ... 1
1.2. Biomedical Data Types ... 1
1.3. Data, Information, and Knowledge ... 2
1.4. Motivation ... 2
1.5. Objectives/Goals ... 3
1.6. Research Questions ... 3
1.7. Dissertation’s Structure of Organization ... 3
Chapter 2 – Literature Review ... 5
2.1. Structured Data ... 5
2.1.1. Biomedical Structured Data ... 5
2.1.2. Data Mining in Healthcare ... 6
2.1.3. Data Mining Case Studies ... 6
2.2. Unstructured Data ... 8
2.2.1. Clinical Diaries ... 8
2.2.2. Biomedical Natural Language Processing ... 9
2.2.3. Text Mining Case Studies ... 9
2.3. Mixed Data Approach ... 12
2.3.1. A Mixed Technique ... 12
2.3.2. Mixed Approach Case Studies ... 12
Chapter 3 – System Architecture ... 15
3.1. Pre-Processing ... 16 3.2. Attribute Mapping ... 16 3.3. Translation ... 17 3.4. NLP System ... 17 3.5. Integration ... 17 3.6. Data Analysis ... 17
v
4.1. Unstructured Dataset Description ... 18
4.2. AD Processing ... 21
4.2.1. AD Pre-processing ... 21
4.2.2. ICD 9 Mapping ... 22
4.2.3. AD Translation ... 23
4.2.4. cTAKES and UMLS ... 24
Chapter 5 – Structured and Mixed Data ... 32
5.1 Structured Data ... 32
5.1.1 Structured Dataset Description ... 32
5.1.2 Structured Data Processing ... 34
5.1.2.1 ED Pre-Processing ... 35
5.1.2.2 ICD 9 Mapping ... 36
5.1.2.3 Data Exploring ... 36
5.2 Mixed Data ... 37
Chapter 6 – Results and Discussion ... 39
6.1 Structured Data Results ... 39
6.2 Unstructured Data Results ... 42
6.3 Mixed Data Results ... 46
6.3.1. Simple Key Linkage ... 47
6.3.2. Compound Key Linkage ... 51
Chapter 7 – Conclusion ... 55
7.1 Research Questions Answers ... 55
7.2 Limitations ... 56
7.3 Future Work ... 56
Bibliography ... 57
Annex and Appendix ... 63
Annex A ... 63
Annex B ... 64
Appendix A ... 65
vi
Index of Tables
Table I – Research Questions ... 3
Table II – Overview of case studies of DM techniques in the Healthcare ... 7
Table III – Overview of case studies of TM and NLP techniques in the Healthcare ... 10
Table IV – Clinical NLP Programs Case Studies ... 11
Table V – Overview of Mixed Data Case Studies ... 13
Table VI – AD Dataset Attributes ... 19
Table VII – ICD Chapters Excerpt ... 20
Table VIII – AD Removed Attributes and Justification ... 21
Table IX – ED Dataset Attributes ... 32
Table X – Manchester Triage System Classification and Times... 33
Table XI – ED Removed Attribute and Justification ... 35
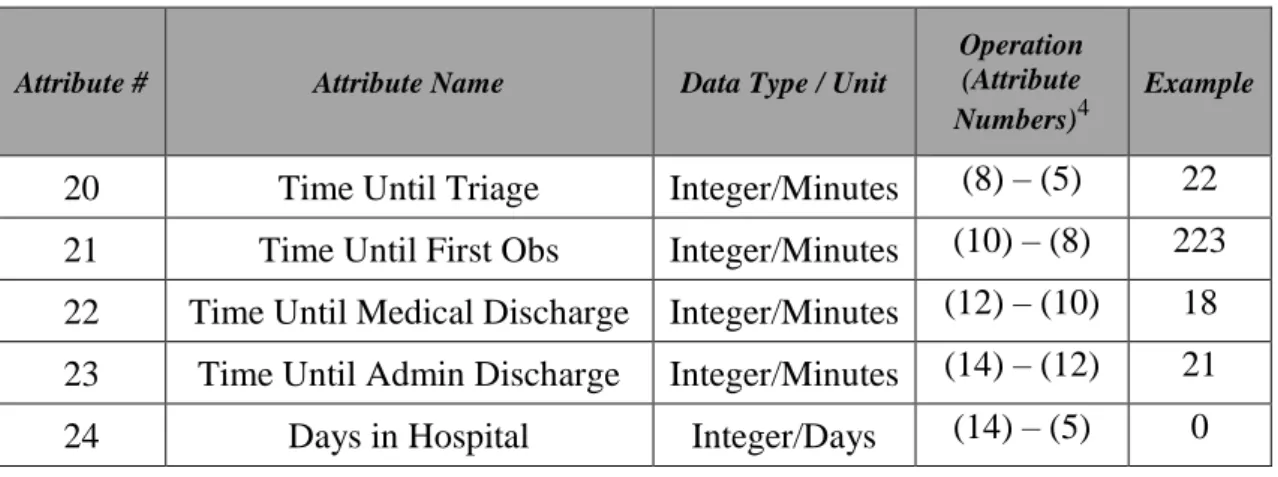
Table XII – Created Time Variables ... 36
vii
Index of Figures
Figure 1 – Overview of the process of integration of both datasets, from the excel files
to the final conjoint database ... 16
Figure 2 – Mapping Process ... 23
Figure 3 – AD Dataset After the Translation ... 24
Figure 4 – Example of the content of a TXT file ... 24
Figure 5 – Initial State of the Sentence to be Processed ... 25
Figure 6 – Tokenized Sentence ... 25
Figure 7 – Normalized Sentence ... 26
Figure 8 – Output of the POS Tagger Component ... 26
Figure 9 – Shallow Parser Output ... 26
Figure 10 – NER Output with Detected Medical Entities ... 27
Figure 11 – NER Output with Negation Status ... 27
Figure 12 – cTAKES CVD Menu ... 28
Figure 13 – cTAKES CPE Menu ... 29
Figure 14 – cTAKES XMI Output Excerpt ... 30
Figure 15 – Excerpt ED_SQLite Table ... 38
Figure 16 – Excerpt AD_SQLite Table ... 38
Figure 17 – Monthly Patient Affluence Distribution... 39
Figure 18 – Distribution of Diseases according to Triage Classification ... 40
Figure 19 – Average Waiting Time per Month ... 41
Figure 20 – Top 5 Diseases in the Emergency Department ... 41
Figure 21 – Count of All Entities Found Grouped by Type ... 42
Figure 22 – Medical Speciality Count ... 43
Figure 23 – Medical Specialties by Number of Entities Detected ... 43
Figure 24 – Top 5 Medications and Symptoms (Medical Oncology) ... 44
Figure 25 – Top 5 Anatomical Sites, Procedures and Diseases (Medical Oncology) .... 45
Figure 26 – Top 5 Diagnostics (Overall) ... 45
Figure 27 – Top 5 Diagnostics (Medical Oncology) ... 45
Figure 28 – Unique Attribute Connection ... 47
Figure 29 – Count of Common ICD 9 Codes and Descriptions (Simple Key Linkage) 48 Figure 30 – Medical Specialties per Diagnosis (Simple Key Linkage) ... 48
Figure 31 – Monthly Diagnosis Distribution (Simple Key Linkage) ... 49
Figure 32 – CKD’s Identified Clinical Entities (Simple Key Linkage) ... 49
Figure 33 – Most Common Entities of CKD Diagnosis (Simple Key Linkage) ... 50
Figure 34 – Common ICD 9 Codes and Descriptions (Compound Key Linkage) ... 52
Figure 35 – Medical Specialties per Diagnosis (Compound Key Linkage) ... 52
Figure 36 – Monthly Diagnosis Distribution (Compound Key Linkage) ... 52
Figure 37 – CKD’s Identified Clinical Entities (Compound Key Linkage) ... 53
Figure 38 – November’s Most Common Entities of CKD Diagnosis (Compound Key Linkage) ... 54
viii
List of Abbreviations
AD – Appointments Department DM – Data Mining
ED – Emergency Department EMR – Electronic Medical Records ICD – International Code of Diseases NLP – Natural Language Processing
TF-IDF – Term Frequency-Inverse Document Frequency TM – Text Mining
1
Chapter 1 – Introduction
1.1. ContextWith the evolution of the medical sector, life expectancy has been increasing. On the one hand, this evolution leads to positive events, such as the end of some diseases (smallpox, plague, etc.) but, on the other hand, new problems arise like the manifestation of new ones such as dementia, cancer, etc. But, as medicine grew and developed, so many other areas like computer science matured and can be used to help to fight these new challenges (Baptista, Ferreira, Pereira, & Baptista, 2019).
Nowadays, healthcare providers store loads of data, medical, and non-medical (Baptista et al., 2019). This data can be about multiple things, such as drug prescription, treatment records, general check-up information, physician’s notes, surgical information or financial and administrative and is stored in either legacy systems or electronic medical records (EMR) (Luo et al., 2016). The EMR is computerized medical information systems that collect, store and display patient information (McLane, 2005).
The usage of EMR accommodates multiple advantages. According with (Yamamoto & Khan, 2006) those advantages could be summarized as “optimizing the documentation of patient encounters, improving communication of information to physicians, improving access to patient medical information, reduction of errors, optimizing billing and improving reimbursement for services, forming a data repository for research and quality improvement, and reduction of paper”.
The format in which this data is recorded is very important since its format is directly related to the way it can be used to extract further insight.
1.2. Biomedical Data Types
There are three different types of data: structured, structured, unstructured, and semi-structured (Yadav, Steinbach, Kumar, & Simon, 2017). Considering the project in hand, the latter is not considered. Therefore, focusing only on the structured and unstructured data types.
Associated with these different types of data structures, there are different data manipulation techniques, such as data mining (DM) and text mining (TM) (also known as Text Data Mining (Sun et al., 2018)).
2 1.3.Data, Information, and Knowledge
Data, information, and knowledge, are three commonly misunderstood concept words that are, sometimes, used as equals which may be the cause of some misunderstandings (Lamy, 2018).
The three terms are related, in a pyramid/chain like relationship (Cooper, 2017), yet they do not represent the same. The complexity and understanding increase from data to information and finally to knowledge.
Data is a value, like a clinical measurement, such as heart rate = 50 beats per minute (bpm) (Cooper, 2017), or simply raw data, such as the clinical narrative (Lamy, 2018). And of the three, it is the least informative.
Information, the next level of the hierarchy, “is accumulated, assembled, or processed data through processes such as referential, type, purpose, relevance, and interpretation” (Allen, 2004), in other words, is put into context, acquiring some meaning. Continuing the example, in the context of a small child, a heart rate of 50 bpm gives some information to a doctor about the child, yet that same information could have different meanings if an adult presents the same values (Cooper, 2017).
The third level of the scale, knowledge, is the most informative of the three presented. When information is structured and organized as a result of cognitive processing (Cooper, 2017) to offer understanding, experience, and accumulated learning (Allen, 2004) and validation become knowledge.
So, to recapitulate, while data are raw values, information is when those values are put into context, and finally, knowledge is information that is structured, organized and processed and may be used to improve procedures or other processes.
1.4. Motivation
The increasing amount of people in the world brings with it an increasing amount of people in the hospitals, generating huge amounts of stored data, under multiple formats. This can have several uses depending on its structure typology. While structured data can be used in prediction models for heart disease risk (Amin, Agarwal, & Beg, 2013), diabetes (Simon et al., 2015) or re-hospitalization (Basu Roy et al., 2015) through DM techniques, with the unstructured data, through the usage of TM, it is possible to assess coronary artery diseases risk (Jonnagaddala et al., 2015) and the identification certain
3 case of injuries (Luther et al., 2015). But the usage of these data types together is seldom seen. This research aims to assess the validity of the usage of both data types together in order to get further insight into the stored data. Aiming to reduce the value loss of loading data that is not used in the healthcare providers systems.
1.5.Objectives/Goals
This work intends to develop a proof of concept able to integrate both structured and unstructured medical data, from different data sources, and enable the extraction of medical information and knowledge.
The biomedical datasets used to test and evaluate the system are both from the same Portuguese hospital, and while one contains structured data regarding the emergency department, the second contains data from medical appointments, where important data is written in the form of free text.
The extraction of both the information and knowledge is supported by a combined application of data mining (DM) and text mining (TM) techniques, such as natural language processing (NLP).
1.6.Research Questions
With this work, it is intended that the following questions, present in Table I, are answered by its end.
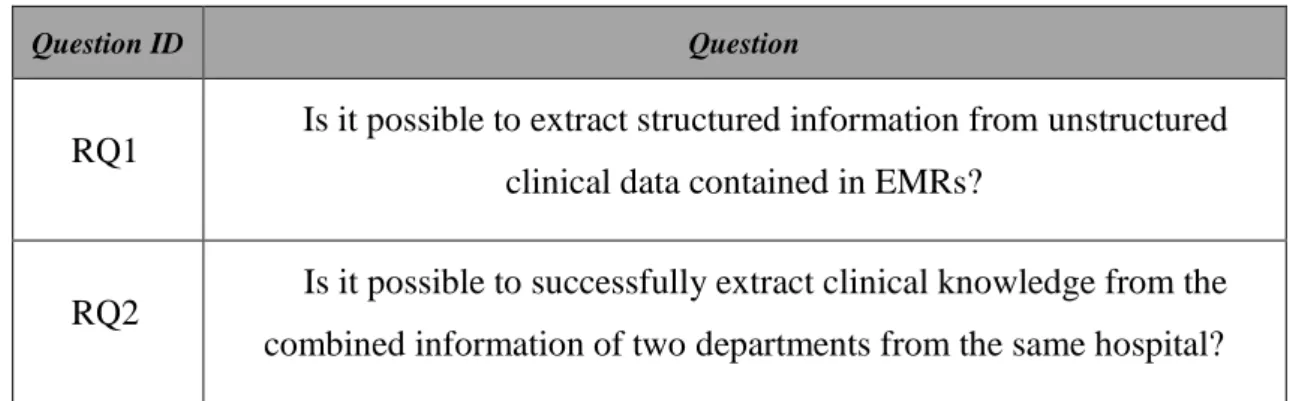
Table I – Research Questions
Question ID Question
RQ1 Is it possible to extract structured information from unstructured clinical data contained in EMRs?
RQ2 Is it possible to successfully extract clinical knowledge from the combined information of two departments from the same hospital?
1.7. Dissertation’s Structure of Organization
The remaining part of this dissertation is comprised of six chapters: (1) Literature Review, (2) System Architecture, (3) Unstructured Data, (4) Structured and Mixed Data, (5) Results and Discussion and finally (6) Conclusion.
4 The second chapter, Literature Review, gives an overview of the related work developed throughout the last years regarding the use of structured, unstructured, and mixed data in the medical field.
The third chapter, System Architecture, presents an overview of all process regarding the dissertation. It enlightens all the steps of the process, although from a more high-level point of view.
The fourth chapter, Unstructured Data, contains the presentation of the unstructured dataset and the explanation of its’ processing, in detail, since the data’s raw form until its’ final stage.
The fifth chapter, Structured and Mixed Data, contemplates the same explanation of the structured dataset and its processing, as it happens in the previous chapter with the unstructured dataset. Nevertheless, this chapter also displays how both structured and unstructured data are combined.
The sixth chapter, Results, and Discussion present the final results of the dissertation, a reflection of its significance, and also a comparison with the planned objectives.
Finally, the last chapter, Conclusion, summarizes all the work done in this dissertation, the attained objectives, answers the research questions, reflects on the limitations of this work and also contemplates on the future work that can be done to continue with the developed work and how to improve it.
5
Chapter 2 – Literature Review
This chapter enlightens the evolution of what has been developed in the previous years related to information extraction from electronic medical records (EMR’s) data, structured, unstructured, and mixed. Few use cases are shown and analyzed for structured and unstructured data, where techniques and frameworks are compared and evaluated. This chapter is composed of three main chapters: (1) Structured Data, (2) Unstructured Data and (3) Mixed Data Approaches.
On the one hand, regarding the structured data front, the case studies presented approach the data mining techniques most commonly used, its utility and results, and the data attributes themselves most commonly used.
On the other hand, about the unstructured data, several approaches have been made to further analyze and use this type of data. Whereas through the classification of text or simply through the extraction of clinical entities from medical records. Because of it, different natural language processing (NLP) systems in the biomedical field are approached and analyzed as the attained results. This overview also explains why the chosen NLP system for the project in hand.
Lastly, regarding the mixed data approaches, different cases studies are an overview and analyzed regarding the usage of structured and unstructured data together and what was achieved with these methodologies.
2.1.Structured Data
Structured data is the name given to data that is stored in a fixed schema database and out of the three existing data types, this one is the easiest of being managed. The fact that the data is stored in a structured schema makes it off easier and faster access.
2.1.1. Biomedical Structured Data
The most common data in this scenario is demographic information (e.g. race, ethnicity, birth date), admission and discharge dates, diagnosis codes (historic and current), procedure codes, laboratory results, medications, allergies, social information (e.g., tobacco usage), and some vital signs (blood pressure, pulse, weight, height) (Garets & Davis, 2006).
The way to handle this type of data, transform it into information, and enable knowledge extraction is through Data Mining as aforementioned.
6 2.1.2. Data Mining in Healthcare
DM has many different definitions, for example, according to (Koh & Tan, 2005), DM is described as “(…) the process of finding previously unknown patterns and trends in databases and using that information to build predictive models. Alternatively, it can be defined as the process of data selection and exploration and building models using vast data stores to uncover previously unknown patterns.” But in this scenario, the DM definition to be considered is Gartner’s, “the process of discovering meaningful correlations, patterns, and trends by sifting through large amounts of data stored in repositories. Data mining employs pattern recognition technologies, as well as statistical and mathematical techniques” (Gartner, 2019a).
Associated with DM, there are a lot of different techniques, benefits, and areas that are used throughout the world, considering the situation.
In the next chapter, some case studies about DM in healthcare are analyzed and reviewed to understand the diversity of techniques available, in which areas it is used and the impact of each one.
2.1.3. Data Mining Case Studies
To facilitate the understanding of how structured data is managed and used, through the use of DM in the healthcare sector, some cases are presented in Table II.
As it can be viewed, the DM analysis utilized in the respective papers can be divided into five categories (Sun, Cai, Liu, Fang, & Wang, 2017): Classification, Clustering, Time Series, Regression Algorithms and Hybrid-Model.
And for all these DM types, many methods were used, showing the wide variety of techniques, applications, and possibilities of this technology.
Considering the overall cases studies (Baba et al., 2015; Basu Roy et al., 2015; Ravindranath, 2015; Somanchi, Adhikari, Lin, Eneva, & Ghani, 2015), it is possible to access that there are a lot of cases, in this scenario, 9 out of 12, that use statistical methods as base for classification models.
7
Table II – Overview of case studies of DM techniques in the Healthcare
On the one hand, the majority of these case studies, use DM techniques to train models and later apply them to predictions in many sectors, some more technical, as cardiology
DM Type Methods Application Speciality Reference
Hybrid Model Neural Networks and Genetic Algorithms
Heart disease risk
prediction Cardiology (Amin et al., 2013) Time Series Mining Time-series mining Risk prediction of
heart disease Cardiology
(Chia & Syed, 2014) Hybrid Model K-means and clustering technologies EMR data processing Operational (Sumana & Santhanam, 2015) Association Rule Mining Association rule mining Diabetes risk prediction Endocrinology (Simon et al., 2015) Classification Technology Dynamic classification and hierarchical model Re-hospitalization
risk prediction Operational
(Basu Roy et al., 2015) Classification Technology Multi-classifier method Noncommunicable
disease pre-diction Epidemiology
(Baba et al., 2015) Classification Technology Support Vector Machine ICU risk prediction Cardiology (Somanchi et al., 2015) Classification Technology Decision Tree Decision Support Systems Operational (Ravindranath, 2015) Clustering Technology Dynamic feature selection Quality of medical service Quality of Service (Rabbi, Mamun, & Islam, 2015) Regression Algorithm Ordinal regression framework Suicide risk prediction Psychiatry (Tran, Phung, Luo, & Venkatesh, 2015) Time Series Mining Time-series mining Risk prediction of
colorectal cancer Oncology
(Kop, Hoogendoorn,
Moons, Numans, & ten
Teije, 2015) Regression Algorithm Multivariate logistic regression Analysis of Cardiac Surgical Bed Demand
Operational (Toerper et al., 2016)
8 (Amin et al., 2013; Chia & Syed, 2014; Somanchi et al., 2015), oncology (Kop et al., 2015), psychiatry (Tran et al., 2015), endocrinology (Simon et al., 2015), other more operational, as quality of service (Rabbi et al., 2015), risk of patients re-hospitalization (Basu Roy et al., 2015) and fore-casting the daily bed needs (Toerper et al., 2016).
On the other hand, as shown in (Ravindranath, 2015), predictions are not the only use of these structured data. K. R. Ravindranath not only explains that there are many ways to diagnose heart diseases, proposing a new Decision Support System for effect based on decision trees.
2.2. Unstructured Data
While in the previous chapters, it was discussed what is structured data, how it can be used to boost the health sector capabilities and were shown some practical examples, during this subchapter both unstructured data and TM techniques were reviewed. Amongst the three aforementioned data types, unstructured data is the one that offers the maximal flexibility (Yadav et al., 2017).
2.2.1. Clinical Diaries
The unstructured data of an EMR is present in clinical notes, surgical records, discharge records, radiology reports, and pathology reports (Sun et al., 2018).
Clinical notes are documents written, in free text, (Yadav et al., 2017) by the doctors, nurses and staff providing care to a patient, and offer increased detail beyond what may be inferred from a patient’s diagnosis codes (Feldman, Hazekamp, & Chawla, 2016).
The information contained in clinical notes maybe about a patient’s medical history (diseases, interventions, etc.), familiar history of diseases, environmental exposures, and lifestyle data (Yadav et al., 2017). And according to (Savova et al., 2010), the knowledge of said notes are retrieved “by employing domain experts to manually curate such narratives”. Hence the usage of an automatic method of interpretation of these clinical notes and records is of the utmost importance.
As explained, DM techniques that could be applied to structured data, cannot be applied to this type of data without some previous structuring (pre-processing).
Unfortunately, because this type of data is represented as free text, there is no common framework, there may be improper grammatical use, spelling errors, local dialects (Sun et al., 2018), short phrases and/or abbreviations (Yadav et al., 2017).
9 Due to such difficulties, data processing and analysis becomes harder. A great deal of this difficulty is precisely the pre-processing of said free text. Natural Language Processing (NLP) tools and techniques are used and have proven very useful when comes to extract knowledge (Yadav et al., 2017).
Therefore, with the help of methods like NLP, it becomes possible to structure the free text and apply DM techniques. Some examples of the types of operations that are done in pre-processing are, removal of digits, anonymization, punctuation removal, etc.
2.2.2. Biomedical Natural Language Processing
Natural Language Processing (NLP), according to (Gartner, 2019b), “technology involves the ability to turn text or audio speech into encoded, structured information, based on an appropriate ontology”. This technology has many utilities from text classification, to sentiment analysis, to automatic summarization. And one of the many sectors to benefit from this technology is the clinical domain, where many successes have been achieved with NLP (Savova et al., 2010).
Considering the free text used from the EMR are clinical notes as exposed above, the processing of the written natural language may vary when using NLP algorithms. Nonetheless, the initials steps usually are the same. Initially, the texts are broken down as separated sentences and then tokenized. After that usually a process of Part-of-Speech Tagging (POS-Tagging) comes into play where each word of the sentence is classified according to its morphological class (verb, noun, adverb, etc.).
In the next chapter, some case studies about NLP and TM techniques and developed tools for the healthcare sector are analyzed and overviewed.
2.2.3. Text Mining Case Studies
Regarding the NLP and TM application to process free text in the healthcare sector, several case studies are presented in order to perceive how, and how much the use of such techniques can better the healthcare sector.
10
Table III – Overview of case studies of TM and NLP techniques in the Healthcare
Depicted in Table III are four case studies where the authors used NLP and/or TM to extract information from medical records. This information would be later used in DM models for prediction (Pulmano & Estuar, 2016) and disease identification (Araneo & Celozzi, 2015; Jonnagaddala et al., 2015; Luther et al., 2015).
As previously explained, usually it is necessary some pre-processing of the free text from EMR before it is in conditions to be used from information extraction. There are some techniques that are quite common such as, the removal of stop words, the lowercase treatment. Other techniques are not that common as Term Frequency-Inverse Document Frequency (TF-IDF) and Stemming. The pre-processing depends on the data in hands and what wants to be done with it.
Although the use of NLP methodologies and tools was different in all scenarios, as the DM methodologies used after, the results were very satisfactory. Another great aspect of these studies is that the unstructured data of the EMR that would not be used in some cases is indeed used and proven useful.
Yet, throughout the years, some tools were developed in order to facilitate the detection and extraction of medical knowledge from EMR’s. Some of those developed programs are presented in Table IV.
NLP Methods Methods Application Reference
Stemming, stop words, numbers and
dates removed Logistic Regression Detection of Adverse Childhood Experiences (Araneo & Celozzi, 2015) Stop words, lowercase, IDF Support Vector Machine Identification of fall-related injuries (Luther et al., 2015) Self-Developed Algorithm - Coronary artery disease risk assessment (Jonnagaddala et al., 2015) Tokenization, TF-IDF, Removal of Stop words Forward Neural Network with Back
Propagation
Automatic diagnosis prediction
(Pulmano & Estuar, 2016)
11
Table IV – Clinical NLP Programs Case Studies
NLP
Software Date Reference
MedLEE 1994 (Friedman, Liu, Shagina, Johnson, & Hripcsak, 2001; Jain & Friedman, 1997; Sevenster, Van Ommering, & Qian, 2012) GATE 1996 (Liu, Mitchell, Chapman, & Crowley, 2005; Wu et al., 2013) cTAKES 2010 (Afzal et al., 2016; Ananthakrishnan et al., 2013; Kidwai et al.,
2011; Savova et al., 2010; Sohn, Kocher, Chute, & Savova, 2011)
The MedLEE (Medical Language Extraction and Encoding System) is “an MLP [Medical Language Processing] system that extracts, structures, and encodes relevant clinical information that occurs inpatient reports” (Friedman et al., 2001). It has been used throughout the years in many ways, such as for the detection of finding suspicious of breast cancer from mammography reports (Jain & Friedman, 1997), it was also used in “a system that extracts clinical findings and body locations from radiology reports and correlates them” (Sevenster et al., 2012).
The GATE (General Architecture for Text Engineering) is an open-source (Liu et al., 2005) NLP software designed to extract information from open-text fields (Wu et al., 2013). This program has been used in systems to detect smoking status information from open-text fields (Wu et al., 2013) and has also been incorporated in a system that, in an automated way, allowed the extraction of tissue annotation from surgical pathology reports (Liu et al., 2005).
And finally, cTAKES (the clinical Text Analysis and Knowledge Extraction System) is “a comprehensive clinical NLP system based on the Unstructured Information Management Architecture (UIMA)” (Kidwai et al., 2011). It is composed of six components that are interconnected and work together to achieve this system’s purpose. The cTAKES enables the detection and extraction of medical information from clinical narratives (Savova et al., 2010). This NLP system has been used to identify peripheral arterial diseases from clinical notes (Afzal et al., 2016), extraction of side effects of some drugs from clinical narratives regarding the medical specialties of psychiatry and psychology (Sohn et al., 2011) and case definition of crohn’s disease and ulcerative colitis processing electronic medical records (Ananthakrishnan et al., 2013).
Based on these three clinical NLP programs, the one that was selected to be used in this work was cTAKES. According to (Lamy, 2018), which made a comparison between,
12 not only these but also some other NLP systems, the cTAKES system not only presented good results in the case studies where it was used, as it is open-source software, which allows for versatility of usage. Allied to the fact that it is also the most recent, the cTAKES was the selected NLP software used in this work.
In the next chapter, the case studies that are presented go over the use of structured and unstructured data together and how the healthcare sector can benefit from the mixed-used of these two types of data.
2.3. Mixed Data Approach 2.3.1. A Mixed Technique
Until now, both DM and NLP case studies have been shown and analyzed, yet, in all of them, there is not one where the structured and unstructured data are used together. While in some, only the structured data is used, others only use the structured data extracted from the unstructured free text from de NLP processing used.
The author considers another way of using all this data. Instead of only using the already structured data or only the structured data retrieved from the free text with TM. Which may end-up with the loss of potential of good information, either way.
2.3.2. Mixed Approach Case Studies
For this effect, a few case studies that used a mix of information from both structured and unstructured data are presented and analyzed.
The case studies are presented in Table V and are organized by application, reference and NLP methods used.
13
Table V – Overview of Mixed Data Case Studies
Methods Application Speciality Reference
Topic Modelling (LDA)
Identify Related Patient Safety
Events
Security (Fong, Hettinger, & Ratwani, 2015) Naïve Bayes, Bayesian Belief Networks and DT Diagnosing Early Stages of Dementia
Psychiatry (Moreira & Namen, 2018)
Logistic Regression Predict Hospital
Re-admissions Cardiology
(Sundararaman, Valady Ramanathan, & Thati,
2018) Clustering
Geriatric Syndrome
Detection
Geriatric (Kharrazi et al., 2018)
As it can be perceived, only four items are present in the Table V. This is because not many case studies make of both structured and unstructured data at the same time, yet the majority is from 2018 which could show a possible tendency.
In these case studies, not only NLP techniques were applied, as DM techniques were used.
In (Moreira & Namen, 2018), not only both techniques were used as its results were compared. In other words, to detect early stages of dementia, the authors used two different techniques to assist specialists in the diagnosis of patients with clinical suspicion of dementia. And concluded that the model that used the structured data and the clustering of the texts written in free format by the physicians integrated, improved the accuracy of predictive models in all pathologies (Moreira & Namen, 2018).
According to (Sundararaman et al., 2018), similar results were obtained when the authors applied the logistic regression to five different iterations. The first one only using structured data, the second one using only unstructured data, the third used feature selection, and the last two used mixed data. And after the five iterations, according to the observed results, the authors concluded “it is recommended that iteration 5 be chosen for such research and applications” (Sundararaman et al., 2018).
Finally, the third case had the objective of comparing the number of geriatric syndrome cases identified using structured claims and structured and unstructured EHR data in order to understand the added value of the latter (Kharrazi et al., 2018). Of the obtained results,
14 once again, the conclusions were similar to those already explained, that the results improved when combining both models. This type of facts led the authors to encourage “incorporating NLP methods to increase the sensitivity of identification of individuals with geriatric syndromes” (Kharrazi et al., 2018).
15
Chapter 3 – System Architecture
This chapter aims to give a high-level view of the pipeline developed. Its’ objective is to integrate structured and unstructured medical data from two different departments, (the Emergency Department (ED) and the Appointments Department (AD), respectively, in a unique database to allow the extraction of knowledge.
During this process the datasets are passed on through a series of steps, (1) Pre-processing, (2) Attribute Mapping, (3) Translation, (4) NLP Systems and (5) Integration in a common database. Presented in Figure 1 is the overall process with the steps of the process required for each dataset from its “raw form” to its “processed form” ready to be explored.
16
Figure 1 – Overview of the process of integration of both datasets, from the excel files to the final conjoint database
3.1. Pre-Processing
The pre-processing is a fundamental step in every project where datasets are used. The importance of this phase is due to the data cleaning that is done. Data cleaning is the process of preparing the data from its initial state (how it comes out from the original data sources) to a state ready to be used. It’s during this phase that problems such as duplicates, null or “NA”, wrong formatting problems are solved.
3.2. Attribute Mapping
The attribute mapping phase aims to establish that variables that are present in both datasets are represented the same way. This phase is required because of the finality of
17 this work. Considering that the final objective is to successfully integrate data from two different datasets, as it can be perceived in Figure 1, it is looked-for linking attributes that allow said linkage.
3.3. Translation
On the one hand, in the previous chapters was mentioned that in this work, an NLP system was used conjointly with a clinical-based of knowledge. On the other hand, the datasets used in this work are from a Portuguese hospital and, as such, the medical diaries, as a few other attributes of the datasets, are in Portuguese. Hence, the need and importance of this step.
3.4. NLP System
The NLP system, working together with the clinical base of knowledge, represents yet another important phase of the pipeline regarding the unstructured dataset. It is in this phase that the medical diaries go through the biggest transition, from unstructured to structured.
3.5. Integration
The final process before the data exploration rests in the integration of the processed data from both datasets, structured, and unstructured. Good integration is important because it may impact in a direct way the results to be obtained in the data exploration.
3.6. Data Analysis
The final phase of the process emphasizes on the exploration of the integrated data. It is at this stage when the data is analyzed through tables and graphs in order to extract clinical knowledge and make conclusions out of it.
In the next chapter, the full pipeline is explained in greater detail. The flow that the data from each dataset had to go through and the results from each stage of the process.
18
Chapter 4 – Unstructured Data
This chapter aims to explain in detail the constitution of the dataset of unstructured data and its’ flow. This chapter is organized in two subchapters: (1) Unstructured Dataset Description and (2) Unstructured Data Processing.
4.1. Unstructured Dataset Description
The unstructured dataset consists of a set of 11.137 EMRs from a Portuguese hospital in an excel file regarding the appointment’s department. In other words, each line from the excel is related to an individual appointment.
Since this dataset is related to the appointment’s department, as stated previously, it is treated as Appointment Department (AD) dataset. This dataset contains data relative to the year 2017. Also, the dataset contains information relative to several medical specialities, such as oncology, rheumatology, gastroenterology, paediatrics, paediatric haematology and urology, amongst others.
Next, present in Table VI, it is represented the structure of an entry of the AD dataset, across its 10 attributes and some examples of what those attributes can have.
19
Table VI – AD Dataset Attributes
The first two attributes, “HDI Episode” and “Sequential Number”, are identifiers of the EMR’s.
The “Date Init Treatment” is represented in a date format (yy.mm.dd) and shows the date at which the treatment of the patient began.
The “Speciality Description” attribute, as the name suggests, infers the medical speciality of the appointment, whereas the “Speciality Code” represents the respective code of the medical speciality.
The “Diagnosis Code” contains the code of the diagnosis given by the doctor and the “Diagnosis Description” represents the respective description of the disease, both variables are in agreement with the International Code of Diseases 9 (ICD 9). The ICD 9 which is regulated by the World Health Organization (WHO) comes to standardize disease description and “(…) promote international comparability in the collection, processing, classification, and presentation of mortality statistics.”(“ICD - ICD-9 -
Attribute # Attribute Name Data Type Example
1 HDI Episode Integer 16008525
2 Sequential Number Integer 608268 3 Date Init Treatment Date 17.01.11 4 Speciality Code Integer 40695 5 Speciality
Description String Rheumatology
6 Diagnosis
Code Integer 6954
7 Diagnosis
Description String Lupus erythematosus
8 Date Date 17.01.11
9 Module String HDI
10 Diary Text
Complaints of coughing dragged. Initially with yellowish expectoration, currently without expectoration. Apyretic. Pulmonary auscultation:
Vesicular murmur maintained and symmetrical. No adventitious noise. X-ray thorax without
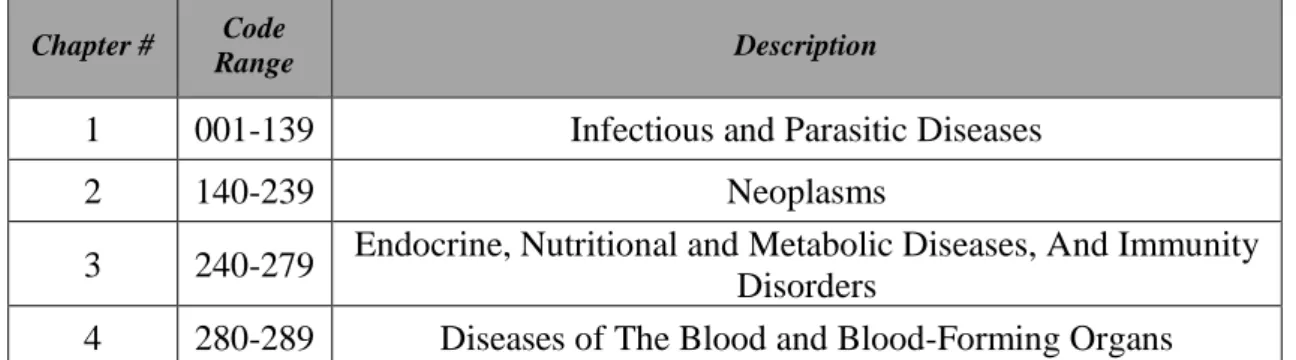
20 International Classification of Diseases, Ninth Revision,” 2019). The ICD 9 comes The ICD 9 CM is composed of 19 chapters based on the subject ofthe ICD codes each chapter contains. Each chapter is identified by a number and a description (“ICD-9-CM Chapters List,” 2019). In Table VII is an excerpt of the chapters’ numbers and descriptions1. Each
set of ICD codes from each chapter is specified by a range showing the first three digits of the code range included. In other words, the first three digits of an Infectious and Parasitic Disease is comprised between 001 and 139.
Table VII – ICD Chapters Excerpt
Chapter # Code
Range Description
1 001-139 Infectious and Parasitic Diseases
2 140-239 Neoplasms
3 240-279 Endocrine, Nutritional and Metabolic Diseases, And Immunity Disorders
4 280-289 Diseases of The Blood and Blood-Forming Organs
The “Date” is represented the same way as the variable “Date Init Treatment” but represents the date of the appointment.
Finally, the “Diary”, maybe the most valuable variable of this dataset, contains a descriptive narrative of the appointment, written by the doctors themselves. This free text can contain a broad of different elements that can give valuable knowledge of what has been done, the drugs prescribed for each disease, its dosages, etc.
The attributes “Speciality Description”, “Diagnosis Description” and “Diary” are written in Portuguese, but to show an example, as performed with the AD attributes, a translated example was shown.
These attributes could be a bridge between datasets and enable the extraction of valuable knowledge needs to be rectified, so both attributes have the same configuration, both integers, facilitating possible cross-referencing.
The following subchapter explains in detail the processing through which the unstructured dataset was passed.
21 4.2.AD Processing
The AD dataset required a complex process due to the unstructured nature of attribute “Diary”. Since it is written in free text, more operations were required in order to prepare the data. This chapter is segmented in four subchapters: (1) Pre-processing, (2) ICD 9 Mapping, (3) Translation, (4) cTAKES and UMLS.
4.2.1. AD Pre-processing
As previously stated, the pre-processing is a fundamental stage of every project that uses datasets because it is at this stage that the data is prepared.
The first stage consists of the removal of any entry that contains any empty fields. Cleaning these rows eliminates the change of getting future “Nulls” and/or “N/A” in the database to be created, which improves its quality.
Secondly, the author searched for duplicated rows in order to remove repeated data (between rows) which can create problems in the future if not dealt with.
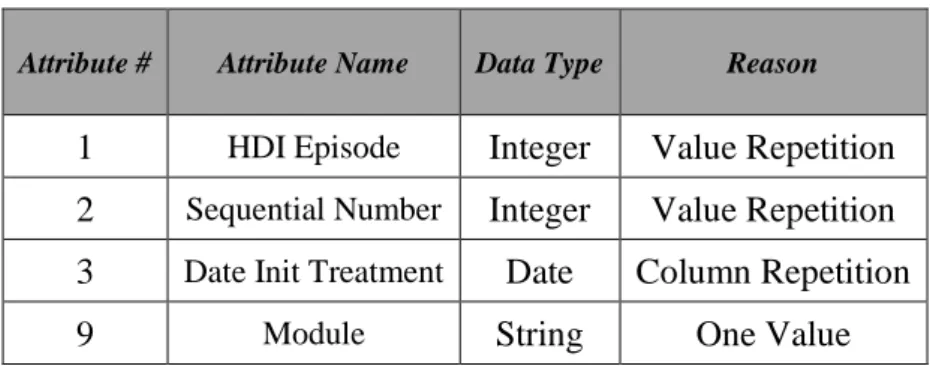
Following the elimination of the duplicated rows, some of the AD attributes were eliminated from the dataset since some of them represented duplicated information (between columns), shown always the same value or showed other problems. The removed columns and the respective reason for removal are presented in Table VIII.
Table VIII – AD Removed Attributes and Justification
Attribute # Attribute Name Data Type Reason
1 HDI Episode Integer Value Repetition 2 Sequential Number Integer Value Repetition 3 Date Init Treatment Date Column Repetition
9 Module String One Value
The first two attributes were removed since the only information it transmitted was the internal identifiers of the hospital system. Being identifiers, these attributes should have unique values, which was not the case. For this reason, and because said attributes did not add great value to the dataset, both columns got removed.
22 The third column was removed since it presented always the same value as the attribute “Date”. Finally, the ninth attribute, “Module”, was also removed because it only showed one value, not adding any value to the dataset.
The next step in the pre-processing stage was focused on the most complex and important attribute of the dataset, “Diary”. Considering the column is composed of free-text, a specific treatment is required in order to improve its’ quality. Through the excel, the free text was analyzed and corrected, in other words, the unfold of abbreviations, acronyms and the correction of misspelling was done. Another important aspect of this phase was the elimination of every identification, such as names, phone numbers and addresses of both patients as practitioners and/or nurses. This was done as a privacy measure. This step is considered an important one since the text is in Portuguese and it still needs to be translated to English, the higher the quality of the text in Portuguese the better the results to be obtained after the translation. Hence, ensuring the quality of the Portuguese text is of the utmost importance.
After the stage of the pre-processing is done, the stage of mapping is done to ensure the common variables between dataset are in conformance.
4.2.2. ICD 9 Mapping
The stage of the ICD 9 mapping is important since the variables which contain the ICD 9 codes and designations, “Diagnosis Code” and “Diagnosis Description”, respectively, as explained previously, are present in both datasets but show different values and/or formatting. Standardizing these attributes creates a useful link between datasets.
In order to map these attributes, an official list of the ICD 9 codes and descriptions, version 31 was retrieved from (“ICD9 Provider Diagnostic Codes,” 2014). The official listing is composed of three columns: Diagnosis Code, Long Description and Short Description. The mapping process is represented in Figure 2.
23
Figure 2 – Mapping Process
This process works entry by entry of the dataset. For each row, it is made a lookup for the “Diagnosis Code” in the official listing. In case there is a match, the field “Diagnosis Description” was overwritten with the respective long description, contained in the official list. In case there is not a match, the author searched manually (“ICD-9-CM Chapters List,” 2019) 2 for the code’s description and updated the official list.
After the dataset has had its attributes correctly mapped, the dataset is ready to be translated in the next phase of the process. Hence the excel file was imported into a data frame structure using python and Jupyter Notebook.
4.2.3. AD Translation
As the third phase of the AD, dataset processing comes the translation of the Portuguese elements. There are three main reasons for this need for translation of the data. Firstly, both datasets present attributes in both Portuguese and English. Therefore, to ensure that both datasets are aligned and coherent, the language must be the same. The chosen language was English.
Secondly, to extract the medical entities and information from the free text present in the EMR’s an NLP software was used, and this uses the English language as default.
24 The translator used to perform the translation of the attributes was Google Translate. The author developed a python script which used a Google Translate API. The attributes translated using the developed script were “Diary” and “Speciality Description”.
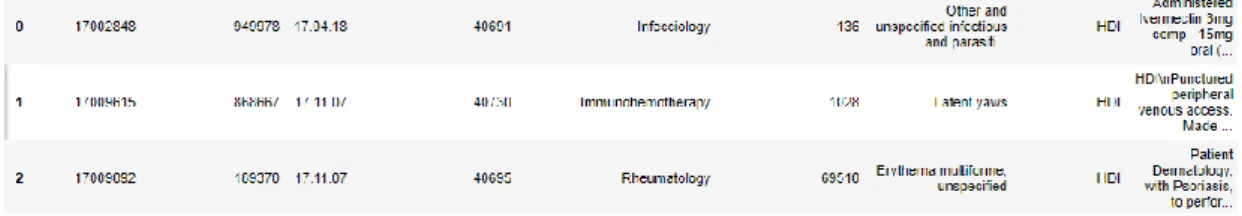
Presented in Figure 3 is an excerpt of the data frame containing the EMRs and, as it is observable, both columns, “Des Especialidade Eng” and “Diario Eng”, contain its respective values translated.
Figure 3 – AD Dataset After the Translation
After the translation of the aforementioned attributes, the dataset is finally in one language only. In the next phase, the medical diaries are fed to the NLP software. Since said software only processes text files (TXT files), the author developed a python script that created a txt file for each row of the data frame. Shown in Figure 4 is an example of what one of the TXT files would contain before being fed into de NLP software.
Figure 4 – Example of the content of a TXT file
4.2.4. cTAKES and UMLS
The cTAKES (clinical Text Analysis and Knowledge Extraction System) consists of a “(…) modular system of pipelined components combining rule-based and machine learning techniques aiming at information extraction from the clinical narrative”(Savova et al., 2010). In other words, cTAKES it is a pipeline of six components that aims to process clinical texts/narratives and enables the extraction of medical information from them. The clinical texts fed to the cTAKES can be in the form of plain texts or clinical document architecture-compliant XML documents (Savova et al., 2010).
25 The six components that make the cTAKES pipeline are:
• Sentence Bound Detector; • Tokenizer;
• Normalizer;
• Part-of-Speech (POS) tagger; • Shallow Parser;
• Named entity recognition (NER) annotator (which includes status and negation annotators).
The Sentence Bound Detector is the first component of the cTAKES pipeline, and its function consists of detecting the ending of sentences, in other words, this element segments a text into sentences. To help further understand how each stage of the cTAKES pipeline works, the sentence presented in Figure 5 shows an example of the various stages of the pipeline. This example is was retrieved from (Savova et al., 2010)3.
Figure 5 – Initial State of the Sentence to be Processed
The Tokenizer is the element that follows the Sentence Bound Detector and has the goal of splitting the sentences previously detected into tokens (words and punctuations). An example of a tokenized sentence is presented in Figure 6.
Figure 6 – Tokenized Sentence
After the sentence is split into tokens, the Normalizer is the next element in the cTAKES pipeline. The Normalizer applies a process named stemming. Stemming is the process of “(…) reducing word’s inflectional and derivational forms to a common basic form, by performing morphological analysis in texts (…)” (Moreira & Namen, 2018). Presented in Figure 7 is an example of a sentence after the Normalizer. Highlighted, in
26 blue, is the cell that contains the word “disease”, which shows how the word “diseases” was transformed into its basic form.
Figure 7 – Normalized Sentence
The next step in the pipeline is the POS Tagger. Part-of-Speech tagging is the capability of a computer to understand the meaning of a word according to its context, in other words, it classifies the words of a sentence as a noun, a verb, an adverb, etc. Meaning it could distinguish the meaning of, for example, “flies” as a verb (to fly) or as a noun (plural of fly, the animal). Presented in Figure 8 is an example of the POS Tagging of a sentence. In this example the POS Tagger identified all elements of the sentence according to its morphological class, e.g. in this scenario “obesity”, “fx” and “artery” were classified as Nouns (NN), while “coronary” was classified as an Adjective (JJ), and so on.
Figure 8 – Output of the POS Tagger Component
The Shallow Parser has the responsibility of analyzing the tokens classified by the POS Tagger and, according to the context of the sentence, associate them into logical groups. Shown in Figure 9 is an example of how the shallow parser would analyze a sentence. In this scenario, out of the logical groups detected, those that contain more than one component are the Noun Phrases (NP) with “no fx” (no family history) and “coronary heart diseases”.
Figure 9 – Shallow Parser Output
Finally, the last element of the cTAKES pipeline is the Name Entity Recognition (NER) Annotator.
This element works with the help of a dictionary and allows for detection of words and clinical information, through its dictionary lookup algorithm. The dictionary used by
27 cTAKES can be configured according to its clinical terms and relationships. The algorithm gathers all the detected entities by the previous elements of the pipeline and uses the dictionary to map a concept to the detected entity. The detected clinical terms can be categorized into five distinct groups:
• Disorders/diseases; • Signs/symptoms; • Procedures; • Anatomical Sites; • Drugs/medications.
Furthermore, this component can also detect if the identified entities are negated in the sentences it processes. Presented in Figures 10 and 11 are examples of the output of the Name Entity Recognition Annotator regarding the identification of the clinical entities, as of its negation status.
Figure 10 – NER Output with Detected Medical Entities
In this case were identified five medical entities, two Diseases/Disorders. As for the negation analysis, the Figure 11 shows that in both cases was correctly identified, family history of obesity was classified and “not negated”, while the family history of coronary artery diseases was classified is “negated”.
Figure 11 – NER Output with Negation Status
Since the cTAKES generic form of operating has been explained, follows a more specific explanation of its two modes available. The cTAKES software, as aforementioned, presents two different modes in which it operates, the CAS Visual Debugger (CVD) and the Collection Processing Engine (CPE). The difference between these two modes rests in the number of documents it can analyze at a time. While the first
28 only processes a document at a time focusing on its display, the latter was developed to process collections of documents.
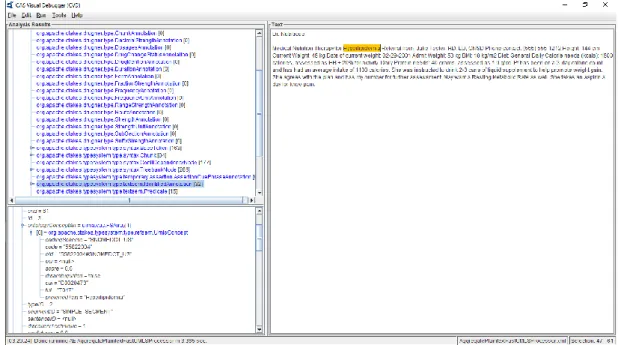
Presented in Figure 12 is the print of the CVD menu. This mode is more indicated to visualize the analysis performed by the cTAKES software. The menu is composed of two different screens: the text area and the NLP analysis result area split into two, where said analysis is presented as a tree. Looking at the example presented, it is visible that this mode is good to have a more visual image of the process.
Figure 12 – cTAKES CVD Menu
In the left screens shows that cTAKES detected a disease mention which is highlighted in the right screen with the value “Hyperlipidemia” which is indeed a disease mention. Nevertheless, for only one text document, it took 3.365 seconds to process and analyze. Since there are 11.134 text files to be processed, the CVE would take a larger amount of time to process everything. Hence, the CPE is the model used in this work.
The CPE model of the cTAKES software, contrarily to the CVD, does not allow for visual analysis of the document, as it can be seen in Figure 13. This mode’s menus do not allow for more visual analysis of the NLP processing since it aims to process collections of documents instead of a document at a time.
29
Figure 13 – cTAKES CPE Menu
This mode’s menu is composed of three different screens: the collection of the reader, the analysis engine, and the CAS consumer. The first element allows the user to choose the element to be processed, it can from a directory to a database.
The second component, the analysis engine, is where the user selects the type of engine to be used according to its needs. It can go from a simple NLP analysis with normalizations and part-of-speech tagging to a full detection of medical entities in the text. For the latter scenario, cTAKES uses as a clinical base of knowledge of the Unified Medical Language System (UMLS).
The UMLS is “a repository of biomedical vocabularies developed by the US National Library of Medicine. The UMLS integrates over 2 million names for some 900 000 concepts from more than 60 families of biomedical vocabularies, as well as 12 million relations among these concepts” (Bodenreider, 2004) which serves as a support to the cTAKES software. The UMLS contains three different knowledge sources:
• Metathesaurus – contains terms and codes form many vocabularies, hierarchies, definitions and other relationships and attributes, and is the main module. Some of the vocabularies contained in this knowledge source are MedSH (Medical Subject Headings), RxNorm and SNOMED CT;
• Semantic Network – has broad categories (semantic types) and their relationships (semantic relations);
30 • SPECIALIST Lexicon and Lexical Tools – is a large syntactic lexicon of, not
only, biomedical but also general English and some tools.
In order to manage the identification and extraction of the identified entities in the medical diaries, a dictionary is required. Said dictionary, by default, is a subsection of the Metathesaurus which used two of its vocabularies, the RxNorm, and the SNOMED CT.
Lastly, the third component is where the data type of the output is select. There are three data types the cTAKES can have as output, XML, XMI (XML Metadata Interchange) or HTML. The chosen output format was XMI because it is relatively easy to manipulate using Python scripts. Presented in Figure 14 is an excerpt of one of the XMI file outputted from the cTAKES.
Figure 14 – cTAKES XMI Output Excerpt
Through its analysis, it is possible to observe all the entities that were detected in one document. Each detected entity is characterized with several attributes: (1) code, (2) coding scheme, (3) CUI, (4) disambiguated, (5) preferred Text, (6) score, (7) TUI and (8) XMI id. Focusing on the most relevant, the coding scheme identifies the vocabulary from where the term concept was select (RxNorm and SNOMED CT). The CUI (Concept Unique Identifier), as the name implies, shows the concept unique number. Preferred Text contains the concept detected in the text. From the cTAKES and UMLS pipeline comes out one XMI file for each TXT file that entered. In other words, the outcome of the pipeline is a collection of XMI files.
31 At the moment the unstructured dataset is divided between the XMI file collection where the medical entities related to the clinical diaries and the excel dataset with the remaining attributes such as medical specialities, date, diagnostics, among others.
In order to structure everything into a single database table, a python script was developed by the author. This script resulted in a CSV (Comma Separated Values) file with 81.103 rows.
32
Chapter 5 – Structured and Mixed Data
This chapter follows a structure similar to the previous one, but in this case, instead of explaining the unstructured data, it is the structured and mixed data that are approached. This chapter is organized in two subchapters: (1) Structured Data and (2) Mixed Data.
5.1 Structured Data
5.1.1 Structured Dataset Description
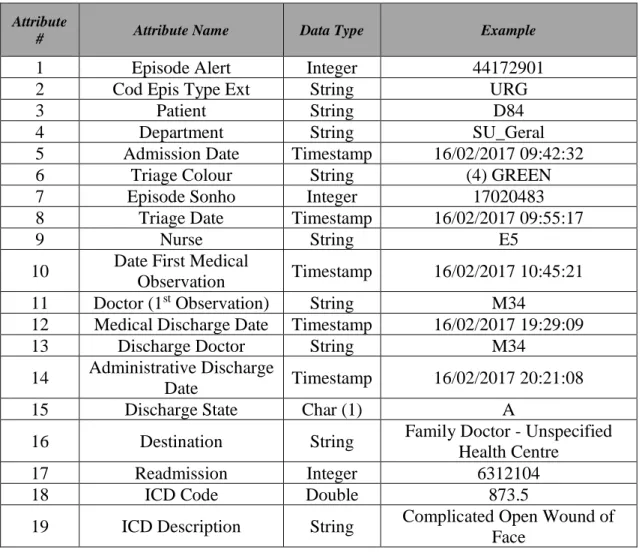
The structured dataset used in this work contains information regarding the Emergency Department (ED) of a Portuguese hospital. This dataset contains data regarding said department between the dates of January 1st of 2015 and December 31st of 2017.The aforementioned data has been extracted from the hospital’s database in the form of an excel file, and it contains 108.295 records and 19 attributes. The attributes, its data types and some examples are represented in Table IX.
Table IX – ED Dataset Attributes
Attribute
# Attribute Name Data Type Example
1 Episode Alert Integer 44172901
2 Cod Epis Type Ext String URG
3 Patient String D84
4 Department String SU_Geral
5 Admission Date Timestamp 16/02/2017 09:42:32
6 Triage Colour String (4) GREEN
7 Episode Sonho Integer 17020483
8 Triage Date Timestamp 16/02/2017 09:55:17
9 Nurse String E5
10 Date First Medical
Observation Timestamp 16/02/2017 10:45:21
11 Doctor (1st Observation) String M34
12 Medical Discharge Date Timestamp 16/02/2017 19:29:09
13 Discharge Doctor String M34
14 Administrative Discharge
Date Timestamp 16/02/2017 20:21:08
15 Discharge State Char (1) A
16 Destination String Family Doctor - Unspecified
Health Centre
17 Readmission Integer 6312104
18 ICD Code Double 873.5
19 ICD Description String Complicated Open Wound of Face
33 Each entry of the file represents an interaction of a patient with the ED. Some entries represent the same interaction but with different diagnostic codes and descriptions due to the identification of multiple diagnostics. The ED flow can be resumed in five simple steps, admission, triage, observation, discharge, and administrative discharge.
It all begins when a patient enters the ED and is admitted by the service and waits for further evaluation (admission). The next step, the triage, consists of an evaluation of the patient, performed by a nurse, and results in the patient’s classification according to the Manchester Triage System (MTS). This triage system “(…) enables nurses to assign a clinical priority to patients, based on presenting signs and symptoms, without making any assumption about the underlying diagnosis. The MTS allocates patients to one out of five urgency categories, which determine the maximum time to first contact with a physician”, being one of the most common triage systems used in Europe (Zachariasse et al., 2017). Presented in Table X are the possible classifications of this system and respective colour and time.
Table X – Manchester Triage System Classification and Times
Priority # Urgency Level Code/Colour Target Time to See the Patient (minutes)
1 Immediate Red 0
2 Very Urgent Orange 10
3 Urgent Yellow 60
4 Standard Green 120
5 Non-Urgent Blue 240
The third step of this process is the observation that corresponds to the first medical observation from a doctor when a diagnose is assessed.
The fourth step is the discharge, whether to home, to another department of the hospital or even to another facility, this step removes the patient from the ED.
Finally, the fifth step corresponds to the evaluation and acceptance of the paperwork related to step four. As aforementioned, the structured dataset contains 19 variables, all presented in Table IX.
34 The “Episode Alert” and “Episode Sonho” consist of simple identifiers of the specific encounter. The “Patient”, “Nurse”, “Doctor (1st Observation)” and “Discharge Doctor” are identifiers of the patients, nurses, and doctors involved. This identification is necessary as a privacy measure since the data in hand is relative to the health of people.
The “Department” represents the local where the event happened and is written in Portuguese. The “Cod Epis Type Ext” also represents the location of where the event happened.
The “Admission Date”, “Triage Date”, “Date First Medical Observation”, “Medical Discharge Date” and “Administrative Discharge Date” are, as the name implies, dates recorded as timestamps (dd/mm/yyyy hh:mm:ss) and represent, respectively, the date and time at which the patient was admitted, when it went through triage, when the first observation was made to the patient from a doctor, the date at which the patient got the discharge clearance and the date at which the medical discharge papers were accepted.
The “Triage Colour” represents the category in which the nurse considered the patient according to the MTS, explained above, and is also written in Portuguese.
The “Discharge State” is an attribute and character that works as a flag, which shows the value “A” when the patient has been discharged. The “Destination” shows the destination to where the patient was discharged, it also is written in Portuguese.
The “Readmission” is a numeric attribute that represents the readmission number of the encounter. Otherwise, the attribute is empty.
Finally, the disease codes are represented as numeric codes the, “ICD Code”, and its description “ICD Description”. All these descriptions and codes are from International Code of Diseases 9 (ICD 9), which were explained in the previous chapter.
The attributes which are written in Portuguese in the original dataset were translated to English, so the example of data presented in Table IX could be presented.
5.1.2 Structured Data Processing
The processing of the structured dataset is simpler when comparing to the unstructured dataset since the ED data is already structured since it requires less processing until its ready to be used. Nevertheless, some processing is required to clean the data and standardize some attributes.
35 5.1.2.1 ED Pre-Processing
The pre-processing phase of the ED dataset shows a similarity with the pre-processing phase of the AD dataset. Hence all the steps have already been explained previously.
In the first phase, all rows that had any attribute fields empty got removed to avoid the existence of “Nulls” and “N/A” further ahead in the process. Secondly, the duplicated rows were removed to avoid the duplication of information, row-wise.
The next stage, just like it was done with the AD dataset, the removal of unnecessary attributes was done. Presented in Table XI are the attributes that got eliminated, its number, and the reason behind its removal.
Table XI – ED Removed Attribute and Justification
Attribute # Attribute Name Data Type Reason
2 Cod Epis Type Ext String One Value
4 Department String One Value
7 Episode Sonho Integer Identifier Column
15 Discharge State Char (1) One Value
The attributes “Cod Epis Type Ext”, “Department” and “Discharge State” were both removed since each one presented only one value along all rows, not adding any insight or quality to the dataset. The variable “Episode Sonho” was removed since it was another identifier of each episode and the variable “Episode Alert” was already being used as an encounter identifier.
After cleaning the dataset from problematic rows and unusable columns, the attribute “Destination” was translated manually. The reason behind the manual translation resides on the fact that most of the values refer to locations, and some of them contained geographic locations that would be wrongly translated.
After the translation phase, the pre-processing of the ED dataset is concluded, and the ICD mapping was implemented.