2018
UNIVERSIDADE DE LISBOA
FACULDADE DE CIÊNCIAS
DEPARTAMENTO BIOLOGIA ANIMAL
“Genomics of Speciation in Humpback Dolphins
(Genus Sousa)”
Cátia Sofia Formas Chanfana
Mestrado em Biologia Evolutiva e do Desenvolvimento
Dissertação orientada por:
Doutora Ana Rita Amaral
V
Agradecimentos | Acknowledgements
This work would not be possible without the help of amazing people beside me. It is a pleasure to thank those who were by my side through all of this endeavor.
First of all, I would like to express my profound gratitude to Doctor Ana Rita Amaral, my supervisor who was always available to support me through all the steps of this thesis. Even with all the blunders that life put in front of you, you were always concerned, supportive and gentle with me. Thank you for
offering this thesis to me, it has been a pleasure to work with you.I would also like to thank Dr. Howard
Rosenbaum and the Wildlife Conservation Society for the opportunity to work with their humpback dolphin dataset and thus collaborate with them in their long term project.
I want to give a special thanks for Vitor Sousa. Even though you did not have the obligation to help me, you offer teachings, patience and guidance when I needed. Thank you for everything.
For all of my colleagues in the Evolutionary Genetics group, especially for João Carvalho, Mónica Silva, Rodrigo, Teresa Santos and Ana Catarina Silva, I want to thank you all for the interesting discussions, for helping me gain some insights about my career in the future, for criticizing constructively my work and for all the patience and teaching. Thank you.
I would like to offer my thanks to all of my colleagues from FCUL, especially to Sofia Mendes and João Moreno. For all the encouragement and insightful discussions (which were invaluable), but also for providing joyous moments during this year. Without it probably this road would be much more difficult to get through. Thank you.
To João Frazão, even though you are new to the group, I would like to thank you for all the joyous conversations and sharing experiences during lunch for this few months. It has been a pleasure.
I also want to give a sincere gratitude for my both friends, André Silva and Pedro Albuquerque. Not only for the constructive critics of my thesis that both of you gave, which I am extremely grateful, but also for the joyous moments that you giving me during our late conversations, and escapes during dinner. Thank you so much.
Of course, I want to give a special thanks to my family. This journey (not only for this thesis, but also for the past six years) would not have been possible without their support and encouragement. A minha gratidão mais profunda vai para os meus pais, porque sem eles nada teria sido possível. Por tudo o que fizeram por mim, por me deixarem sonhar e não desistir, pelo amor e pela dedicação um muito obrigado. E claro ao meu irmão, pelas palhaçadas e pelos mimos que te pedia, estavas lá sempre. Obrigada do fundo do coração. I am truly blessed for having you all as my family.
And last but not the least, a huge thank you for the only person who actually endured all the good and bad moods that occur during this year. Without your help, support, patience (a lot of patience!!) and late-night discussions, this road would be extremely painful. For everything that you gave me, I hope that I am doing the same for you, but for now I just want to show my enormous gratitude for helping me, for your kindness, for being who you are. Thank you Carlos Ramírez!
VII
Resumo
“Como se originam novas espécies?” é uma questão fundamental em Evolução e a importância de compreender os mecanismos e processos por detrás dessa origem está ligado à formação da biodiversidade. Designado por especiação, é um processo contínuo e complexo que envolve múltiplas barreiras e interações entre as mesmas que levam ao isolamento de populações e por consequente a formação de novas espécies. Estas múltiplas barreiras podem ser de dois tipos de isolamento – pré-zigótico e pós-pré-zigótico – e cada uma destas barreiras deixa assinaturas diferentes no genoma. Com o avanço das tecnologias de next generation sequencing, scans genómicos têm vindo a ganhar extrema relevância neste campo de investigação. O rápido decréscimo do custo de sequenciação em gerar milhares de marcadores genéticos e com o desenvolvimento de novos programas que lidam com dados genómicos, veio tornar possível aos investigadores a obtenção de um número vasto de loci/genes e identificar assinaturas e padrões de heterogeneidade em diferentes espécies. Com estes novos meios torna-se possível ter uma melhor compreensão dos mecanismos genéticos que estão envolvidos na estabilização do isolamento das populações, e que leva à origem de novas espécies.
A especiação tem sido muito estudada, mas atualmente tudo o que se sabe sobre os mecanismos por detrás deste processo contínuo, deriva sobretudo de estudos realizados em espécies terrestres e de água-doce. A terra e os oceanos têm diferentes características e diferentes tipos de barreiras ao fluxo genético entre populações. Relativamente aos oceanos, barreiras como correntes oceânicas, upwelling, batimetria, temperatura de superfície e salinidade têm sido propostas como alguns dos fatores que explicam a diversidade genética observada em espécies marinhas, incluindo os mamíferos marinhos. Os mamíferos marinhos estão divididos em quatro diferentes grupos, e todos eles representam uma das transições evolutivas mais impressionantes entre o ambiente terrestre para o ambiente aquático. Os cetáceos, um dos grupos de mamíferos marinhos, é composto por espécies com elevada capacidade de dispersão, aparentemente sem barreiras à sua dispersão. Todavia, estudos recentes têm vindo a demonstrar que barreiras oceanográficas, comportamento e estrutura social são fatores que explicam os padrões observados de diversidade e estrutura genética nestes animais.
O género Sousa, pertencente à Família Delphinidae, encontra-se distribuído descontinuamente ao longo da costa Oeste Africana até à costa Este do Oceano Pacífico, e atualmente são quatro as espécies diferentes: S. teuszii, S. plumbea, S. chinensis e S. sahulensis. As quatro espécies são morfologicamente distintas, estando as diferenças focadas principalmente na coloração e na forma da barbatana dorsal e a corcunda existente por baixo da barbatana dorsal. Poucos estudos têm sido feitos para compreender o seu comportamento, ecologia e genética. Contudo, tem sido apontado que barreiras oceanográficas podem estar por detrás da aparente regionalização das populações. Mais recentemente, estudos genéticos demonstraram que existe uma população altamente diferenciada no Bangladesh com aparente distribuição ao longo da Baia de Bengala, e apresenta características mistas entre duas das espécies, S.
chinensis e S. plumbea. Ao nível do DNA mitocondrial sabe-se que esta população não se agrupa com
nenhuma dessas espécies, mas sim que se encontra mais próxima filogeneticamente de S. sahulensis que ocorre na Austrália. Com a possibilidade de reformulação da taxonomia do género Sousa e com a necessidade de implementar programas de conservação, quais foram os processos evolutivos que levaram a esta diversidade de populações tem sido alvo de discussão, das quais as barreiras oceanográficas têm sido apontadas como causais. Assim, deste modo, neste estudo aplicamos técnicas de scans genómico para estudar a complexidade do processo de especiação dentro do género Sousa. De modo a termos uma ideia da estrutura populacional e dos efeitos das barreiras sobre o genoma que levam à especiação nestes organismos, utilizamos a técnica de genotyping-by-sequencing para obter single
Resumo
VIII
longo da distribuição destas espécies, e possíveis assinaturas de seleção e loci candidatos que aparentam ter um papel no processo de especiação.
Com o objetivo de estudar a estrutura populacional do género Sousa, 36 amostras foram recolhidas ao longo de toda a distribuição do género abrangendo todas as espécies atualmente conhecidas, juntamente com a população do Bangladesh. Desses 36 indivíduos, devido à má qualidade de algumas das amostras apenas 32 foram usados para o data set final, focando a análise apenas na distribuição do Indo-Pacífico. Todas as análises realizadas ao nível da estrutura populacional apontam para que o género Sousa ao longo do Indo-Pacífico é composto por 5 grupos: S. sahulensis, S. chinensis, a população do Bangladesh e S. plumbea que está segregado em dois grupos, a da costa Africana e a do mar da Arábia. Todas os grupos surgem como altamente diferenciados uns dos outros, com exceção dos grupos de S. plumbea que apresentam algum fluxo genético entre elas. Esta estrutura separada em 5 grupos apresenta valores de FST elevados quando comparados com valores obtidos em comparações entre espécies de golfinhos, sendo esta estrutura também suportada por antigos trabalhos nos quais foram utilizados menos marcadores que este presente estudo. A população do Bangladesh apresenta-se altamente diferenciada das restantes, embora morfologicamente apresente características mistas de S. plumbea e S. chinensis. Voltou-se a verificar que esta população não se agrupa com nenhuma das duas espécies, e está filogeneticamente mais próxima de a S. sahulensis. Contudo esta população não pode ser classificada como uma nova espécie devida à falta de amostras ao longo da distribuição de S. chinensis. Portanto, em trabalhos futuros, para resolver a taxonomia deste género é importante incluir amostras ao longo da distribuição de S. chinensis.
Apesar das razões ecológicas e sociais para a explicação da elevada estruturação deste género ainda serem desconhecidas, o nosso estudo permitiu criar hipóteses diferentes das que têm sido apresentadas até à data. Neste trabalho foram evidenciados cerca de 24 genes com relevância funcional, dos quais apresentaram sinais de seleção direcional. Embora não tenha sido possível obter vias metabólicas selecionadas devido aos poucos genes usados, as descrições destes 24 genes apontam para elevadas expressões no cérebro e em tecidos do sistema reprodutor em humanos. Relativamente aos genes expressos no cérebro, todos eles apresentaram grande importância em funções neurológicas como o stress, memória, aprendizagem e circuitos emocionais. Alguns deles como os genes DRD2 e GRM7 que são recetores para diferentes neurotransmissores e que tem vindo a demonstrar importância em muitas doenças que afetam o foro social em humanos, como Esquizofrenia e Défice de atenção e hiperatividade. Já para os genes relacionados com tecidos reprodutores, embora alguns aparentem ser importantes para a formação do espermatozóide ou para a manutenção do desenvolvimento embrionário, nenhum deles foi estudado sobre o seu efeito como uma barreira pós-zigótica com implicações no isolamento das populações. No entanto o seu papel funcional pode implicar a possível formação dessa barreira. Sabe-se que diferenças em condições ambientais influenciam a divergência entre populações, e condições oceanográficas não são diferentes. As condições extraordinárias encontradas na Baia de Bengala, como a água pouco profunda, enorme intrusão de água doce e sedimentos devido a sistemas de mangal e a um grande sistema estuarino (dos maiores do mundo), upwellings e reversão da corrente como mesoeddies, muito provavelmente explicam a distinção genética que se observa neste local. Contudo, com a análise dos genes candidatos existe a possibilidade que caracteres sociais estejam também a influenciar a divergência das populações no género Sousa. Os cetáceos são conhecidos por terem variações no seu comportamento e sistemas sociais complexos, e cada vez mais existem estudos que comprovam que as estruturas sociais afetam a divergência entre populações. Infelizmente, nos golfinhos do género Sousa poucos estudos de comportamento têm sido feitos em diferentes populações, e as suas associações têm sido descritas como uma estrutura de fission-fusion. Com pouca informação destas populações poucas causas podem ser apontadas para a explicação dos genes candidatos observados. Porém, o facto de as populações aparecerem regionalmente separadas, nós supomos que a
Resumo
IX
estruturação deste género poderá estar a ser afetada por caracteres sociais e fatores ambientais, em que ambos permitem com que as populações se mantenham isoladas geneticamente.
O esclarecimento da estrutura populacional do género Sousa e a compreensão dos mecanismos que levam à sua diversidade e divergência, não são só importantes para a ciência como também são de extrema importância para a conservação destas espécies. Este estudo demonstra que diversos fatores ambientais e sociais são importantes para a manutenção das populações como unidades evolutivas únicas, e que é preciso ter em conta todos estes mecanismos para auxiliar na criação de novas políticas de conservação adequadas a estas espécies, inclusivamente na criação de Áreas Marinhas Protegidas em regiões do mundo pouco desenvolvidas, mas de grande valor ecológico.
Resumo
XI
Abstract
Speciation is a fundamental process in evolution and is important for the formation of biodiversity. It is a continuous and complex process which involves multiple interacting barriers that lead to heterogenous genomic landscapes with various peaks of divergence between populations. With the advances in next generation sequencing technologies, genome-scans became extremely important tools for this research field, due to their higher ability to obtain thousands of genetic markers. This high-density of genetic markers, along with the emergence of new analytical approaches for this type of data, made it possible to help clarify not only our understanding of the genomic basis and the evolution of genetic barriers, but also helping to unify research on both the ecological and non-ecological causes of speciation.
In this study, we applied genome-scans to gain insights on the speciation process occurring in the genus
Sousa, not only to understand the population structure but also to find signatures of selection and
possible candidate loci that may have a putative role in the establishment of divergence and speciation. Through population structure analysis we found 5 distinct clusters, clearly separating the three already known species, S. plumbea, S. chinensis and S. sahulensis. A slightly segregation was observed within
S. plumbea, separating African Coast and Arabian Sea populations. The population from Bangladesh
appears highly-differentiated from all others populations, supporting previous studies conducted with mtDNA.
With this highly structured genus we found possible evidence for genic divergence with putative functional relevance. From the 16 SNPs (Single Nucleotide Polymorphisms) that showed signs of directional selection, the corresponding genes are highly expressed in human tissues – brain and reproductive system – and appear to have important roles on socio-biological traits. Even though it has been hypothesized that this genus may be geographically structured due to the influence of oceanographic variables, our work shows a possible additional influence of social drivers in the maintenance of these highly isolated populations within this genus.
XIII
Table of Contents
AGRADECIMENTOS | ACKNOWLEDGEMENTS V
RESUMO VII
ABSTRACT XI
FIGURE LIST XIV
TABLE LIST XV
1. INTRODUCTION 1
A PROCESS CALLED SPECIATION 2
SPECIATION GENOMICS 2
MARINE SPECIATION AND MARINE MAMMALS 3
GENUS SOUSA 4
IMPORTANCE FOR CONSERVATION 7
AIMS 7
2. MATERIALS AND METHODS 9
SAMPLE COLLECTION AND SEQUENCING 9
DATA PROCESSING 9
DETECTION OF POPULATION STRUCTURE 10
PHYLOGENETIC RELATIONSHIP,DIVERGENCE TIME ESTIMATION AND DEMOGRAPHIC HISTORY 11
MODEL-BASED AND MODEL-FREE SELECTION TEST 12
GENE IDENTIFICATION AND GENE ONTOLOGY ENRICHMENT ANALYSIS 12
3. RESULTS 15
POPULATION STRUCTURE AND DIFFERENTIATION 15
PHYLOGENETIC RELATIONSHIPS AND DEMOGRAPHIC HISTORY 17
CANDIDATE GENES 17
4. DISCUSSION 21
HIGHLY STRUCTURED GENUS 21
CANDIDATE GENES 22
BRAIN GENES 22
GENES OF THE REPRODUCTIVE SYSTEM 23
SOCIAL AND ECOLOGICAL DRIVERS 23
5. FINAL CONSIDERATIONS 25
6. REFERENCES 26
XIV
Figure List
Figure 1.1 – Representation of the genus Sousa through their entire range. Distributed discontinuously along the coastal waters, these species appear to not move more than a few kilometers upstream, remaining in the range of tidal influence. ... 5 Figure 1.2 – The four recognized species of the genus Sousa. The Atlantic humpback dolphin is at the top, followed by the Indo-Pacific humpback dolphin adult and calf, next is the Indian Ocean humpback and the Australian humpback dolphin at the bottom. Illustration by Uko Gorter adapted from Würsig et al., 2018. ... 5 Figure 2.1 – Representation of the samples covering the entire range of the genus Sousa. Different symbols correspond to different populations within each species: • – West Africa; ▲ – Southeast Africa; ♦ - Oman; ★ – Bangladesh; ■ – Thailand; ♣ – China; ♠ - Australia...9 Figure 3.1 - Results from the population structure analysis of the genus Sousa. A) STRUCTURE and SNMF showing the clustering of different populations with little gene flow between them. B) PCA result segregating the four major clusters in this genus with 55% of the variance explained with two PC’s. C) DAPC results showing five optimal clusters with 5 PCs and 4 DA eigenvalues used. Bangladesh – Pink; African Coast – Blue; Arabian Sea – Red; Australia – Yellow. Relatively to Thailand, it is represented differently for each figure: in A) is marked as *, in B) is uncoloured and C) is black.. ... 16 Figure 3.2 - Maximum Likelihood consensus tree obtained from RAxML with 100% of bootstrap on the longest branches. The different clusters are represented with different colours: The S. chinensis is separated in two clusters, the population from Bangladesh as Pink and the individual from Thailand is marked with *; S. plumbea separated in two clusters, the African Coast as Blue, and the Arabian Sea as Red; and the S. sahulensis from Australia as yellow.. ... 17 Figure 4.1 – Wash up of S. Lentiginosa holotype in Sri Lanka shore. It is still unclear if this is a distinct geographic form related with the population from Bangladesh recently identified as highly-differentiated. Image adapted from Jefferson & Rosenbaum 2014.. ... 22 Figure 7.1 - The optimization of the number of clusters was a necessary step for both DAPC and SNMF programs. For DAPC analysis A) the value of BIC shows the number of suitable clusters for the data set in study. The optimal five clusters were obtained according to B) the number of retained Principal Components (PCs) each the optimal value was 5 PCs to retained in the analysis. A different value of a-score optimization affects the number of clusters obtained in BIC. For SNMF analysis C) the optimal number of clusters were obtained according to the Minimal Cross-Entropy. The lowest value was considered the optimal cluster for the data set analyzed in both programs. ... 36 Figure 7.2 - In this study, the best value of K for STRUCTURE was determined based in two approaches: A) AK statistic by Evanno and B) Ln(Pr(X|K)) by Pritchard. The highest value for both the approaches corresponds the ideal K for the analyzed data. ... 37 Figure 7.3 - Graphic representation of the results from BAYESCAN. All the three graphics show the FST distribution of the SNPs analyzed along the qvalue logarithm, and each one corresponds to different data sets with different MAF values A) MAF 1%; B) MAF 5% and C) MAF 2%. The line in all of the graphics corresponds to the FDR of 5% used to obtained the SNPS under directional selection. All the SNPs found on the right side of the line were under directional selection. ... 37 Figure 7.4 – Graphic representation of the detection of loci under selection from genome-scans based of Fst. Calculations done through Arlequin and graphic representation obtained from RSTUDIO. .... 38
XV
Table List
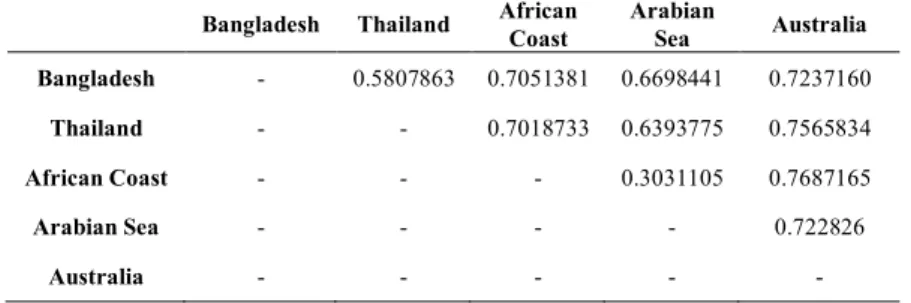
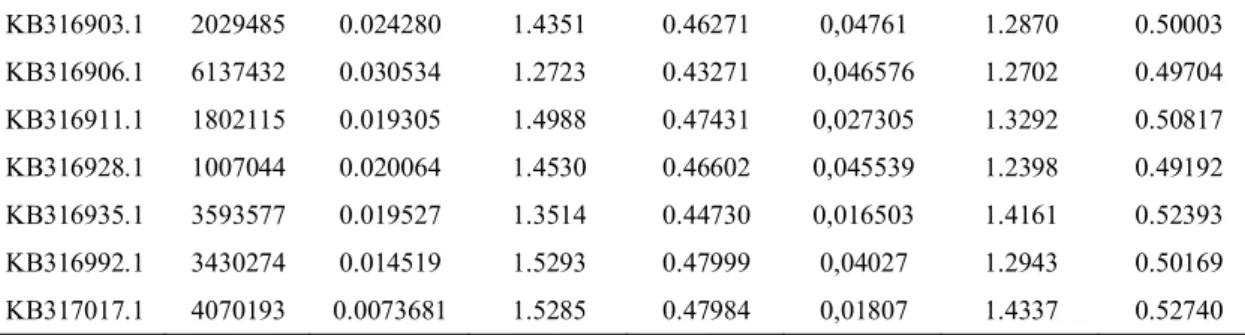
Table 1.1 - Summary of the differences between the species of the genus Sousa, with the currently conservation status for each one of them. Adapted from Jefferson & Curry 2015. ... 7 Table 2.1 - Summary of the five different SNP data sets that were generated for each different step. Using different values of MAF we obtain different data sets with different number of SNPs to analyze. Min and Max SNP correspond to the minimum and maximum number of loci observed within an individual, for each data set. The missing percentage corresponds to the missing data removed for each individual and the Ind. is the total individuals that data set has………..10 Table 3.1 - FST analysis using Weir and Cockerham approach, showing differentiated populations with higher values for dolphin species. ... 16 Table 3.2 - A list of genes with alpha > 1 in Sousa populations that showed evidence of disruptive selection under development and reproductive tissues. All of these genes were described to be highly expressed in humans. The genes names and the corresponded bibliography is described in Table 7.4.19 Table 7.1 - Representation of all individuals missing data in percentage before any filter application. The 36 individuals are ordered by species and location, and are identified by the location and the order of position in lane of sequencing. The values of missing data vary depending on the quality of the samples for each of the individuals. ... 34 Table 7.2 - Results from the BAYESCAN program showing all the 16 SNPS in common with the two first data sets that appear to be under directional selection. Between the two data sets, all 16 SNPs have similar values, showing positive alphas with values superior to 1 and FST ranging from 0.43 to 0.53. ... 10 Table 7.3 - Representation of the genes under directional selection with their corresponding acronyms, gene name and bibliography with information about each of the genes. ... 35
1
1. Introduction
Ever since Darwin, one of the most impressive facts about nature is that it is discontinuous. All animals and plants are separated in very discrete clusters, and although there is variation among individuals within a cluster, these remain discrete morphologically and genetically to each other (Coyne, 2010; Turelli et al., 2001). These clusters have been defined as species and how come these species split has been a foundational question to the field of evolutionary biology (Wolf and Ellegren, 2017). However, not all the clusters are well defined and with methodological problems that arise from this delimitation, the definition of species is one of the most discussed topics (Schwartz and Boness, 2017).
Nowadays, the definition of species is influenced by the concept, the tools used to evaluate that concept and by scientific experience (Schwartz and Boness, 2017). There are several species concepts, and all of them are distinguished by the difference between species. The Biological Species Concept (BSC) is one of the most known concepts and is defined by “a group of actually or potentially interbreeding natural populations, which are reproductively isolated from other such groups” (Mayr, 1942). The reproduction is the focus of this concept, in which species are reproductively isolated from one another by allopatric, behavioral or physiological mechanisms (such as reproductive incompatibilities) that prevent gene flow between them (Mendez et al., 2013b). The Phylogenetic Species Concept (PSC) is another concept that focuses on the ancestry of a species, suggesting that it “…is a diagnosable cluster of individuals within which there is a parental pattern of ancestry and descent, beyond which there is not, and which exhibits a pattern of phylogenetic ancestry and descent among units of like kind.” (Eldredge and Cracraft, 1980). This concept implies that species are characterized by their evolutionary distinctiveness resulting from significant divergence and are usually assessed with phylogenetic method (Mendez et al., 2013b). There are other species concepts, such as the ecological species concept, the genotypic cluster, the evolutionary species concept (Mallet, 1995; Simpson, 1951; Valen, 1976), and also the population concepts that are similar to species concepts but related to ecological, evolutionary and statistical paradigms (Waples and Gaggiotti, 2006).
Even though each concept has a reason behind it, they also show limitations such the separation into species despite the ongoing interbreeding, gene flow and hybridization. Besides, some concepts like the PSC, can also artificially create new species if species distributions are very fragmented and each fragment becomes fixed for different DNA polymorphisms through the neutral process of genetic drift and not through local adaptation (Schwartz and Boness, 2017). Even with these limitations BSC remains the gold standard, most of it due to the conceptualization of Speciation at the individual level (Wu, 2001). In 2001 Wu came with the idea of the genic view of species, where species divergence occurs along a continuum of genetic differentiation, with incipient species passing through a phase where they are only partly reproductively isolated, which means that species boundaries are semipermeable. Even though this idea has long been recognized, the different concepts are still debatable in the scientific community.
The delimitation of species is usually defined using the two most knowable concepts, BSC and PSC. The reason for these two concepts is that BSC is the most known and usable concept, while PSC is less restrictive, more applicable in practice and more objective (Agapow et al., 2004). However, in this thesis we are going to use the same concepts as in previous studies of these animals, also integrating the genic view to minimize the limitations caused by the other concepts.
Chapter I | Introduction
2
A process called Speciation
Speciation is the study of how new species arise. The importance of understanding the mechanisms and processes behind this origin is linked to the formation of biodiversity (Coyne, 2010). It is an often complex and continuous process that involves multiple and interacting barriers. Until it is complete the effects of this process vary along the genome and can lead to a heterogenous genomic landscape with various peaks of differentiation and divergence between populations (Ravinet et al., 2017).
Currently, Speciation is defined “as the origin of reproductive barriers among populations that permit the maintenance of genetic and phenotypic distinctiveness of these populations in geographical proximity” (Seehausen et al., 2014). These reproductive barriers can be divided in three types of isolation: the prezygotic that includes isolation through habitat, phenological or sexual; and the postzygotic, which can be separated in two forms, the extrinsic form that results from divergent or disruptive selection; and the intrinsic form, which is due to genetic incompatibilities (Feder et al., 2012; Seehausen et al., 2014). The evolution of genetic incompatibilities is independent of the environment, and the mechanisms behind these genomic conflicts have been largely studied in evolutionary biology (Wolf and Ellegren, 2017). However, recent population genomic studies of divergence across the genomes have investigated cases of ecological speciation. They have focused on extrinsic isolation and the importance of these mechanisms throughout the genome (Seehausen et al., 2014).
Different evolutionary mechanisms give rise to different genomic signatures. When speciation is driven by intrinsic barriers it often results from epistatic incompatibilities, which may accumulate either as a by-product of selection or as a result of genetic drift. Extrinsic postzygotic and prezygotic barriers may accumulate later, which facilitates both ecological coexistence between sibling species and reinforcement of reproductive isolation (Orr and Turelli, 2001; Seehausen et al., 2014). By contrast, when speciation is driven by divergent ecological or sexual selection, extrinsic postzygotic and prezygotic barriers often evolve first and interact to produce reproductive isolation, while intrinsic postzygotic barriers will evolve later during the speciation process (Marques et al., 2017). With this pattern, multiple regions are likely to be divergent and scattered across the genome. There is even theoretical arguments and empirical evidence that sites under selection in the genome will be spatially clustered when adaptive evolution proceeds under divergent selection, with either migration or recurrent hybridization (Ellegren et al., 2012; Langerhans and Riesch, 2013; Scordato et al., 2014). Regions of reduced recombination, and the accumulation of prezygotic isolation loci, may also play a role over the genomic architecture.
With all of these different signatures affecting the genome architecture, it is important to distinguish these signatures from the background pattern of the genome, to than be able to have a glimpse of the populations’ history and which episodes caused the divergence between two populations (W. Wolf and Ellegren, 2016).
Speciation genomics
The central task of speciation genetics is to reconstruct the sequence in which these different barriers and factors originated in order to distinguish between causes and consequences of speciation. To achieve this, it would be ideal to take an unbiased view of the entire genome at all stages of the same process (Seehausen et al., 2014; Wolf and Ellegren, 2017). However, speciation can rarely be studied in real time in natural populations. Estimations of gene flow and the amount of variation among the loci could help determine the order in which reproductive barriers emerged, but it is challenging to make such inferences, and current methods are not accurate enough for this purpose. Nevertheless, by the integration of multiple case studies of closely related taxa that vary in their extent of divergence, inferences can be made about the time and the importance of different factors involved (Mavárez et al.,
Chapter I | Introduction
3
2006). These studies have made important contributions to speciation research, and this approach is being adopted in the next generation sequencing (NGS) based genome scan.
Speciation genomics is a relatively new field that has already begun to make an important contribution to speciation research. It uses empirical data from NGS, along with the emergence of new analytical approaches for this kind of data, and it has been helped to clarify our understanding of the genomic basis, and the evolution of reproductive barriers, to unify research on both the ecological and non-ecological causes of speciation (Etter et al., 2012). NGS techniques such as Genotyping-by-sequencing (GBS) are especially appealing to use in these studies, due to the rapidly decreasing cost of high-throughput sequencing generating hundreds or thousands of neutral markers and the development of downstream genomic tools that allowed most researchers to clearly identify patterns of heterogeneity and outlier loci for large genome species (Cammen et al., 2016; Elshire et al., 2011; Narum et al., 2013). It generates large numbers of Single Nucleotide Polymorphisms (SNPs) by reducing genome complexity with restriction enzymes, which can then be used in subsequent genetic analyses and genotyping, without requiring previous genomic information (He et al., 2014; Narum et al., 2013).
Several NGS-based genome scans of population divergence have found surprisingly variable patterns of genomic divergence. The first generation of NGS-based population genomic studies of ecological speciation has therefore shown that ecological selection can cause strong isolation of small genomic regions between diverging populations and that, when reproductive isolation is strong enough to permit persistence of incipient species in sympatry, many unlinked regions typically experience significant isolation (Haasl and Payseur, 2016; Marques et al., 2017). Indeed, genome scans have shown strong isolation at genomic loci that were known to be under divergent selection. However, as already mentioned above, caution is warranted because different evolutionary processes can leave similar signatures in the genome.
Heterogeneous genomic divergence is sometimes also observed between allopatric populations of the same species in the absence of any current gene flow. Indeed, many studies assume ongoing gene flow between species, even though stochastic variation, due to recent coalescence times and incomplete lineage sorting, can lead to low divergence and high heterogeneity in a similar way, particularly when they are combined with selection (Feder et al., 2012; Meyer et al., 2016). Statistical methods are available to distinguish divergence in isolation from divergence with gene flow, and these methods are increasingly being applied to genome-scale data sets (Wolf and Ellegren, 2017). By combining multiple methods it should be possible to obtain a richer catalog of the affected loci and a better understanding of the processes involved in speciation (Chen et al., 2010).
Marine speciation and Marine Mammals
The majority of what is currently known about the patterns and processes of speciation comes from studies of terrestrial or freshwater species, where barriers to dispersal are easily observable. Land and
oceans have very different features, such as density, viscosity, temperature, solubility and diffusion of
oxygen differ dramatically between water and air, affecting the dispersal and distribution of marine organisms (Miglietta et al., 2011). Moreover, land and sea differ significantly in the type and effectiveness of natural barriers, which have long been considered to be much rarer in the sea than on land. This last factor has an especially important impact on an organism’s potential for dispersal, thus affecting both population connectivity and speciation processes (Miglietta et al., 2011; Momigliano et al., 2017). Even though barriers have long been thought to be less common in marine ecosystems, complex oceanographic systems and land barriers such as the Isthmus of Panama and the Eastern Pacific Barrier, are known to prevent gene flow between neighbouring populations of marine taxa, originating scenarios of vicariance and in some cases of speciation (Miglietta et al., 2011). However, variables such
Chapter I | Introduction
4
as ocean currents, upwelling, bathymetry, sea surface temperature, primary productivity and salinity have been proposed as some of the factors that explain genetic diversity and structure in marine organisms, including marine mammals (Amaral et al., 2017).Marine mammals are classified into four different groups, the cetaceans (whales, dolphins and porpoises), pinnipeds (seals, sea lions and walruses), sirenians (manatees and dugongs) and marine fissipeds (polar bears and sea otters), and all of them are non-model organisms that represents one of the most striking evolutionary transitions from terrestrial to marine environments (Cammen et al., 2016; Gatesy et al., 2013). All of these groups evolved to thrive in the marine or freshwater ecosystems, not in one single occasion but in multiple independent scenarios (McGowen, 2011). Like the diversification of cetaceans and sirenians in the Eocene from the Cetartiodactyla and Afrotheria, respectively, and for pinnipeds the diversification comes around the Miocene from within the Carnivora (Foote et al., 2015; Gatesy et al., 2013). Even though the aquatic mode life required a whole set of adaptations with anatomical rearrangements, most of the phenotypic adaptations are share between the different groups (Foote et al., 2015). This makes them an exemplary system for investigating the convergent evolution of different morphological and physiological adaptations, including: the loss and reduction of many typical mammalian characteristics, such as sight and smell; and gain of other characteristics, such as echolocation, deep diving, osmoregulation and cognition (Cammen et al., 2016).
Cetaceans is a clade that is divided in two subclades, the Mysticeti (baleen whales) and Odontoceti (toothed whales), and all of them are highly mobile species with no obvious physical geographic barriers to dispersal, in comparison to the terrestrial environment (Attard et al., 2018; Cammen et al., 2016). The family Delphinidae is one of the Odontocete lineages, and has experienced an explosive radiation during the last 11 million years (McGowen, 2011). They show a wide range of ecological and behavioral diversity, but show patterns of gene flow and genetic structure that varies extensively across space and time (Bowen et al., 2016).
The recent evolutionary success of different traits of delphinids with a large-scale ocean restructuring and temperature fluctuations in the Late Miocene and Early Pliocene, have been proposed as the explanation for this radiation (Steeman et al., 2009). Some delphinid species have ecologically and behaviorally distinct groups (“ecotypes”) with limited gene flow, even in parapatry or sympatry, such as killer whales that have sympatric ecotypes that differ in prey type, foraging strategy, social structure, and movement (Bowen et al., 2016). While others show strong fidelity to narrow ranges that result in genetically divergent populations along continuous coastlines or between adjacent islands, which is the case of spinner dolphins, Hector’s dolphins, and Indo-Pacific humpback dolphins. In this particularly case, biogeographic boundaries such as ocean currents, salinity and temperature gradient, sea floor topology, upwelling, primary productivity and other geographic features have been proposed as some of the factors that explain their pattern of genetic diversity and structure (Amaral et al., 2017; Farhadi et al., 2017).
Genus Sousa
The scientific literature is rich in details about the biology and ecology of the bottlenose dolphins (Tursiops spp.), common dolphins (Delphinus spp.) and of species within the genus Stenella, including information of abundance, distribution, behavior, life history parameters, taxonomy and phylogenetics. However, for the humpback dolphins of the genus Sousa there is little information available. Until recently, very little research had been conducted and limited biological material had been obtained from these species. This difference in information is due to the widely distribution the species in question are, and to the low level of development of many of the countries surrounding their habitats, which leads to a lack of research about the genus Sousa. The genus Sousa is part of the Delphinidae family, but the
Chapter I | Introduction
5
taxonomy within this genus has been highly controversial up until the last few years. A revision conducted in 2014 (Jefferson and Rosenbaum, 2014) presented a thorough review of morphological, molecular and biogeographic information, and suggested that this genus comprises four species: the Atlantic humpback (S. teuszii – East Atlantic Ocean), the Indian Ocean humpback (S. plumbea – Indian Ocean), Indo-Pacific humpback (S. chinensis – East Indian and Western Pacific Ocean), and a newly described species, the Australian humpback (S. sahulensis – Australia and New Guinea) as can be seen in Figure 1.1. These dolphins are distributed discontinuously along coastal waters, they occur in tropical to warm temperature regions. They tend to be in open coasts and bays, which they have access to rocky reefs, mangrove swamps, estuarine areas and areas with sandbanks or mudbanks. They do not inhabit deep oceanic areas and their movements appear to be limited by water depth (40 meters appear to be the limit) (Würsig et al., 2018). Little is known about their ecology and behavior, but it is known that these species are opportunistic-generalist feeders, eating a wide variety of coastal fishes and mostly seen in relatively small schools of less than ten individuals. Indo-Pacific humpback dolphins sometimes enter rivers and inland waterways of mangrove forests, but they do not appear to move more than a few kilometers upstream and
Figure 1.2 – The four recognized species of the genus Sousa. The Atlantic humpback dolphin is at the top, followed by the Indo-Pacific humpback dolphin adult and calf, next is the Indian Ocean humpback and the Australian humpback dolphin at the bottom. Illustration by Uko Gorter adapted from Würsig et al., 2018.
Sousa teuszii
Sousa chinensis
Sousa plumbea
Sousa sahulensis Figure 1.1 – Representation of the genus Sousa through their entire
range. Distributed discontinuously along the coastal waters, these species appear to not move more than a few kilometers upstream, remaining in the range of tidal influence.
S. teuszii S. teuszii S. plumbea S. plumbea S. chinensis S. chinensis S. sahulensis S. sahulensis
Chapter I | Introduction
6
usually remain within the range of tidal influence (Jefferson and Karczmarski, 2001; Wang et al., 2007). With so much similarity over the foraging and habitat use between species, what actually distinguishes them is their visual appearance that is concentrated in three traits: pigmentation, size of the dorsal fin and the hump, which can also be regionally separated as can be seen in figure 1.2 (Amaral et al., 2017; Jefferson and Curry, 2015; Jefferson and Rosenbaum, 2014; 2016). Regarding the shape and size of the dorsal fin, S. plumbea has a smaller dorsal fin, slightly falcate, less triangular in shape and sits atop a prominent and well-developed dorsal hump. While S. chinensis has a short dorsal fin, triangular in shape, slightly recurved and has a wide base without a basal hump, and S. teuszii has a similar dorsal fin shape and basal hump to S. plumbea, but the hump tends to be more pronounced and the fin more triangular in shape with a rounded tip. In the case of the pigmentation in these animals, it varies greatly according to geographic location: S. plumbea are usually dark gray with lighter ventral surface shading to off-white, with light spotting sometimes present; S. teuszii are similar to S. plumbea; S. sahulensis are pale gray in color with flanks shading to off-white and spotted toward the ventral surface; S. chinensis, specially from the southern china are pure white, often with dark spots on the body and a pinkish tinge resulting from the blood flushing during periods of high activity (Jefferson and Curry, 2015; 2016). One of the most perplexing issues in the taxonomy of this genus has been the status of humpback dolphins inhabiting the Bay of Bengal (Eastern India, Bangladesh and Myanmar). This region is an area of overlap between S. plumbea and S. chinensis, and this population shows characteristics that are similar to both these species. The absence of a dorsal hump, the shape of the dorsal fin and extensive spotting on the body with large unpigmented areas on the sides and back, are similar to S. chinensis, while the darker color which is characteristic of S. plumbea (Muralidharan, 2013; Smith et al., 2015). However, a recent study using the mitochondrial DNA suggests that they do not group with neither S.
chinensis nor S. plumbea. They are actually a highly-differentiated population that is more closely
related phylogenetically to S. sahulensis (Amaral et al., 2017). This population possibly ranging from Bangladesh, Eastern India and Sri Lanka, and with an estimated abundance of 636 individuals (Smith et al., 2015), occurs in larger group sizes than those recorded elsewhere. With an median group size estimated of 81 to 205 individuals, it is still unknown if the social organization of this population has strong social bonds or if it is characterized by a fission/fusion society, similar to other populations in the genus Sousa (Amaral et al., 2017; Jefferson and Curry, 2016).
With a possible reformulation of the taxonomy at hand, the evolutionary processes for each of the species and populations are a matter of current discussion. A hypothesis has been pointed out that the genus Sousa has a long evolutionary history and evolved early in the delphinid evolution, being at the base of the tree around the Pliocene (McGowen, 2011). It has been indicated that the origin of the genus
Sousa has started in eastern Australia and radiated northwards and westwards in a complex fashion over
the last 8.02 Million years (Lin et al., 2010). Given this possibility, it came not as a surprise that the divergence between the Australian species and S. chinensis appears to occur along the Wallace Line. Wallace Line has long been known to be an important biogeographic boundary for many plants and animals. The line has been thought to be primarily a factor in evolution of terrestrial organisms, largely due to the long distance that separated Asia and Australia (Jefferson and Rosenbaum, 2014). However, some studies have been shown that this boundary can also be applied to marine organisms, and cetaceans are no exception. They have found strong evidence that dolphins of the genus Orcaella had split into separate species on either side of a distributional gap along the Wallace Line (Beasley et al., 2005). Like humpback dolphins, Orcaella spp. are coastal, shallow-water animals and it appears likely to us that for both these genera, speciation along Wallace’s Line has less to do with the large distances separating these land masses in the geologic past and more to do with the relatively deep water that has long separated Southeast Asia from Australia/New Guinea (Beasley et al., 2005; Lin et al., 2010).
Chapter I | Introduction
7
Nevertheless, a lot of work still needs to be done, not only to clarify exactly how many species actually exist within the genus, but also to understand the mechanisms behind their distribution, if there are other oceanographic barriers and what is the genetic basis behind these influences (Jefferson and Curry, 2015).
Importance for conservation
It is important to clarify levels of divergence and structure of these isolated populations in this genus, not only to understand the processes and the loci/genes that are involved in their isolation and speciation, but also for their present conservation status (Table 1.1). Although dolphins in general, in many human societies are thought of as ‘charismatic megafauna’, and therefore enjoy popular status among the general public, the unfortunate reality is that, many marine mammal populations share histories of dramatic decline due to hunting and other human impacts, and these species are no exception. Since humpback dolphins live in nearshore habitat, generally near freshwater input in developing nations heavily influenced by human activities, this makes them extremely vulnerable to fatal entanglements in fishing gear, impacts of vessel traffic and the increasing degradation of their habitat (Amaral et al., 2017).
Because so little is known about humpback populations in some areas and research work has been scant, some populations of humpback dolphins may have already been extirpated, without us even being aware of it. These vulnerable populations could benefit greatly from an improved understanding of their genetic diversity and evolution, especially in ways that can inform predictions of adaptive capacity to anthropogenic pressures and expand the toolkit for conservation policy (Cammen et al., 2016).
Table 1.1 - Summary of the differences between the species of the genus Sousa, with the currently conservation status for each one of them. Adapted from Jefferson and Curry, 2015.
Characteristic S. teuszii S. plumbea S. chinensis S. sahulensis
Ocean Eastern Atlantic Western Indian Eastern Indian and Western Pacific Western Pacific
Range West Sahara to Angola South Africa to Myanmar East India to China and SE Asia Southern Australia to New Guinea IUCN Red List status
Current Endangered Critically Endangered Vulnerable Vulnerable
External Morphology
Dorsal hump Prominent Prominent No dorsal No dorsal
Coloration Uniform grey with lighter belly Uniform brownish grey with lighter belly
Mostly white as adults
Dark grey back and lighter belly, curved
dorsal cape Sexual
dimorphism Dimorphic Dimorphic
Little or no
dimorphism Slight dimorphism
Aims
To help resolve the patterns of differentiation within genus Sousa and better understand the evolutionary processes behind their diversity, our study conducted a population genomic analysis of humpback dolphins. Our aim was to observe the patterns of genome-wide genetic variation and differentiation,
Chapter I | Introduction
8
building up on previous population genetic studies, and to conduct a first approach over the genetic basis of speciation within this genus. In particular, we addressed the following objectives:
i) uncover the population structure and demographic history, by assessing the levels of nuclear genomic divergence between the different populations and species within the genus Sousa: we expect to find several genetically differentiated populations unconnected by gene flow;
ii)
identify signatures of selection in the genome and candidate genes or loci with a putativerole in the establishment of reproductive isolation and local adaptation: we expected to find genes linked to morphological and pigmentation traits to be under positive selection in some populations.
The results of our study should provide an important insight into the processes underlying the evolution of diversity within genus and inform on the establishment of effective conservation programs, such as the implementation of Marine Protected Areas in undeveloped areas of the Indo-Pacific.
9
2. Materials and Methods
Sample collection and sequencing
Our total data set consisted of 36 samples obtained from stranded or biopsied humpback dolphins, which were selected from a set of samples already used in previous studies (Amaral et al., 2017; Mendez et al., 2013a). As shown in Figure 2.1, our data set represents the entire range of the genus Sousa, contains samples from West Africa (WEA, n=1), Southeast Africa (SEA - South Africa, Mozambique and Tanzania, n=11), Oman (OM, n=8), Bangladesh (BAN, n=10), China (CHI - Hong Kong and Taiwan, n=3), Thailand (THA, n=1) and Australia (AUS, n=2).
The genomic DNA from tissues samples already preserved in ethanol (96% v/v) or in sodium chloride-saturated 20% dimethyl sulphoxide (DMSO) solution, was extracted using QIAamp Tissue Kit (QIAGEN, Valencia, CA, USA) and its concentration measured using a Qubit Florometric Quantitation (ThermoFisher). The samples were then shipped to the Cornell University Institute of Biotechnology’s
Genomic Diversity Facility1 where the GBS data was generated using a genotype-by-sequencing
protocol (Elshire et al., 2011). To optimize the GBS results, sequencing libraries were constructed using the restriction enzyme PstI (CTGCAG), that has shown the best results in mammals (De Donato et al., 2013). Unique oligonucleotide barcodes were added to each sample for multiplexed sequencing on an Illumina HiSeq 2000 (Illumina, San Diego, CA, USA), and the template-controls were included with the batch of samples. The reads were assembled to the orca genome as a reference (O. orca, Oorc_1.1, 200.0x coverage, Foote et al., 2015a; Morin et al., 2010a) using bwa v0.7.8-r455 (Li and Durbin, 2009). Demultiplexing, initial quality control, assembly, and SNP discovery were completed in the TASSEL pipeline v3.0.174 (Glaubitz et al., 2014) at Cornell University.
Data processing
After the SNP calling obtained with the TASSEL pipeline, template-controls were excluded. We then applied additional filters to further reduce false positives for the following analyses. Firstly, limits for the depth of coverage were calculated and applied for each individual in RStudio v1.0.136 (RStudio Team (2016)) using a custom script. The calculation corresponded to 1/3 of the mean-depth for the minimum limit and the double of the mean-depth for the maximum limit. This calculation was applied because it considers the own average of each individual, allowing the use of more sites in the subsequent analyses. Secondly, to minimize the genotyping error that comes from heterozygosity excess, we performed a Hardy-Weinberg Equilibrium test using --hardy option in VCFtools v0.1.15 (Danecek et al., 2011) and the sites with P-values significant at the 0.01 level were excluded. Due to higher levels of
1http://www.biotech.cornell.edu/brc/genomic-diversity-facility
S. teuszii S. plumbea S. chinensis S. sahulensis
Figure 2.1 – Representation of the samples covering the entire range of the genus Sousa. Different symbols correspond to different populations within each species:
• – West Africa; ▲ – Southeast Africa; ♦ - Oman; ★ – Bangladesh; ■ – Thailand; ♣ – China; ♠ - Australia. • • ▲ ■ ♦ ★ ♣ ▲ ▲ ▲ ♣ ♠
Chapter II | Materials and Methods
10
missing data in some individuals (Table 7.1), a filter of 50% missing data was conducted from VCFtools with the --max-missing option, to reduce the bias caused by inexistent data in the remaning analyses. Other filters, such as bi-allelic sites and Minimum Allele Frequency (hereafter MAF), were also applied, being conducted in VCFtools using --min-alleles, --max-alleles and --maf options, respectively. Relatively to the MAF filter, it is already known that the MAF of the alleles tested affects the detection of a genetic effect in a given study (Glaubitz et al., 2014; Nielsen et al., 2012; Tabangin et al., 2009; Whitlock and Lotterhos, 2015). To minimize the rare alleles that are more likely to be false-positive and create bias on the results, we set three different settings for the MAF filter to produce three main data sets with the highest SNP count. The other two secondary data sets were also created for specific programs due to some technical constraints, the fourth data set for the program BEAST, while the fifth data set was used in FASTSIMCOAL2 program (Table 2.1). After this, each data set was converted to various formats using PGDSpider2 v2.1.1.3 (Lischer and Excoffier, 2012) for downstream analysis. Table 2.1 - Summary of the five different SNP data sets that were generated for each different step. Using different values of MAF we obtain different data sets with different number of SNPs to analyze. Min and Max SNP correspond to the minimum and maximum number of loci observed within an individual, for each data set. The missing percentage corresponds to the missing data removed for each individual and the Ind. is the total individuals that data set has.
Data set MAF (%) Ind. Missing (%) Total SNPs Min SNP Max SNP Singletons
1 1 32 50 25 154 5 996 22 404 12 509
2 2 32 50 19 462 4 322 16 920 6 817
3 5 32 50 11 345 2 377 10 012 491
4 2 18 50 21 103 14 759 18 937 9 284
5 5 8 100 7 090 - 7 090 0
Detection of population structure
To explore population structure in the genus Sousa, we first used a discriminant analysis of principal components (DAPC) to identify genetic clusters. DAPC is a multivariate approach that transforms individuals genotypes using principal components analysis (PCA) prior to a discriminant analysis (DA) (Jombart et al., 2010). This maximizes the differentiation between groups while minimizing variation within groups and was conducted using the dapc function in the Adegenet package v2.1.1 (Jombart, 2008) of the RSTUDIO framework. Since DAPC requires group assignment a priori, we employed a K-means clustering algorithm implemented in Adegenet to identify the optimal number of clusters from K = 1 to K = 10. Different clustering solutions were then compared using Bayesian Information Criterion (BIC), and to avoid over-fitting of discriminant functions, we used Alpha-score optimization to evaluate the optimal number of principal components (PCs) to retain in the analysis, as in (Jombart et al., 2010). The optimum number of PCs is indicated with the highest mean alpha across all simulations.
Second, we estimated individual genetic ancestry using sNMF (Frichot et al., 2014) through the snmf function in the LEA package v1.6.0 (Frichot and François, 2015) of the RSTUDIO framework, and the program STRUCTURE v2.3.2 (Pritchard et al., 2000). Both programs compute proportions called ancestry coefficients that represent the proportions of an individual genome that originate from multiple ancestral gene pools (Frichot et al., 2014; Pritchard et al., 2000). However, sNMF has been proven to be a faster algorithm, have comparable results to those obtained from STRUCTURE, and avoids Hardy-Weinberg equilibrium assumptions (Frichot et al., 2014) which is one of the main assumptions in STRUCTURE. Even though the advantage of sNMF has been proven in other studies, here in this work we decided to use both programs for comparative purposes.
Chapter II | Materials and Methods
11
The ancestry coefficients were estimated from a specified number of ancestral populations (K). For sNMF, the ancestry coefficient was calculated for K = 1 to K=10 using 100 replicates for each K. The preferred number of K was chosen using a cross-entropy criterion based on the prediction of masked genotypes to evaluate the error of ancestry estimation. For STRUCTURE, a correlated allele frequency model with no admixture was used (Hubisz et al., 2009). We conducted 20 runs for each K value with a burn-in of 10 000 repetitions for each value of K (Puechmaille, 2016). To determine the best value of K we employed two approaches. We used an iterative approach based on the ∆K statistic (Evanno et al., 2005) and also used the ln(Pr(X|K)) values in order to identify the K for which Pr(K=k) is highest, as described in (Pritchard et al., 2000). Both approaches were calculated using CLUMPAK (Kopelman et al., 2015) and STRUCTURE HARVESTER v0.6.94 (Earl and vonHoldt, 2012).
Finally, to measure the genetic differentiation between populations, we used the snpgdsFst function in the SNPRelate package (Zheng et al., 2012) of the RStudio framework. The estimator of Wright’s (1951)
FST (henceforth FST) was calculated following the approach of Weir & Cockerham’s (1984). All of these
different analyses were calculated for the three main data sets and the BEAST data set, to observe the effect of MAF over population structure.
Phylogenetic relationship, Divergence time estimation and Demographic history
The phylogenetic relationships within populations were inferred with Bayesian and Maximum-likelihood methods. The Maximum-Maximum-likelihood method was implemented using RAxML v8.2.11 (Stamatakis, 2014), where we inferred 1000 inferences using the ASC_GTRCAT model with no rate heterogeneity modelled (-V). The branch support was estimated using bootstrap by a majority-rule criteria as implemented in RAxML (Pattengale et al., 2010) and visualized simultaneously in a single consensus tree (Holland et al., 2005) in Figtree v1.4.3 (Rambaut et al., 2012). The consensus tree was set at 0.1, which means that bipartitions that appeared in at least 200 of the 2000 bootstrap trees participated in network construction. RAxML was ran with all the three main data sets to observed the congruency between them in the phylogenetic relationship.
For the Bayesian method we used the SNAPP package v1.3.0 (Bryant et al., 2012) that estimates species trees under a Bayesian multispecies coalescent framework through BEAST v2.4.7 (Bouckaert et al., 2014). For a priori species assignments, we used the previously identified groups from PCA and sNMF and the following parameter settings: mutation rate u and v set at 4.86 and 0.56 respectively, keeping the remaining parameters and their defaults, and a single run of the MCMC chain with 10,000,000 generations sampling every 1,000 steps was done. To assess if the posterior distribution was adequately sampled we used TRACER v1.7 (Rambaut et al., 2018) and accepted only if the effective sample size were larger than 200 for every parameter. We used DENSITREE v2.2.1 (Bouckaert and Heled, 2014) to visualize the distribution of trees, and the maximum-clade-credibility tree was generated using SNAPP Tree Set Analyser v2.4.7 (Bryant et al., 2012) with a burn-in of 10% of the trees. To obtain the divergence time estimations between the different nodes we used the substitution rate found in common
bottlenose dolphin of 0.84 x 10⁻⁹ substitutions per site per year (Zhou et al., 2013). Since BEAST runs
with no missing data for each population, the fourth data set was used to maximize the number of SNPs used for each population to make the best estimations possible.
The demography history was assessed by using FASTSIMCOAL2 v2.6 (Excoffier and Foll, 2011; Excoffier et al., 2013) to estimate the effective number of migrants exchanged between different populations, the effective population size for each population and also to compare the divergence time estimation for each node with the results from SNAPP. Since FASTSIMCOAL2 does not accept missing data per individual, to maximize the number of SNPs to analyze, we reduced the number of individuals to the ones with the minimum missing data, giving origin to the fifth data set (Table 2.1). Due to
Chapter II | Materials and Methods
12
computational constraints, we only analyzed three populations – Bangladesh, Oman and Australia – and three scenarios where only the order of populations was changed. The folded site frequency spectrum (SFS) was obtained through Arlequin v3.5 (Excoffier and Lischer, 2010). The mutation rate we used was 0.84 x 10 -9 substitutions per site per year (Zhou et al., 2013), and for each scenario 10 runs were carried out with the following settings: -d -n200,000 -M -L40 -q -0.
Model-based and Model-free selection test
It is of great interest to understand any process of selection that could have influenced the divergence of
Sousa species. In this study, three different selection tests were performed: a Bayesian approach
implemented in BAYESCAN v2.1 (Foll and Gaggiotti, 2008); a maximum likelihood test implemented in FDIST (Beaumont and Nichols, 1996); and a nonmodel-based method implemented in PCAdapt v3.0.4 (Luu et al., 2017). For the following analysis we use only the outlier SNPs that have shown in all three tests, to minimize the false positive rate that both BAYESCAN and FDIST have been shown to suffer as a result of violations of these independence assumptions (Whitlock and Lotterhos, 2015). BAYESCAN tests whether subpopulation-specific allele frequencies, measured by an FST coefficient, are significantly different from the allele frequency within the common gene pool, and assigns a posterior probability (alpha) to a model in which selection explains a difference in allele frequencies better than a null model (Foll and Gaggiotti, 2008). A positive alpha indicates population-specific directional selection, while a negative alpha suggests balancing or purifying selection. BAYESCAN may also suffer from elevated false-positive rates under isolation by distance and range expansion, with balancing or purifying selection being especially prone to such issues (Lotterhos and Whitlock, 2014). To minimize such issues, we focused on directional selection only, and additionally we used prior odds of 10 000. Higher prior odds have been documented to help reduce the false-positive rate at the expense of identifying true loci under selection. A false discovery rate (FDR) of 0.05 was also used, keeping in mind that although this reduces the number of false positives, true signals of selection may be missed (Foll and Gaggiotti, 2008).
The FDIST test simulate the null distribution of FST for the sample sizes observed in the data, through
the assumption of the island-model. Calculations were done in the program Arlequin v3.5.2.2 (Excoffier and Lischer, 2010) where the coalescent simulations were used to get a null distribution and the
confidence intervals around the observed values, to see if the observed FST can be considered outliers
conditioned on the global observed FST value.
The PCAdapt was used to assess structure-based selection. PCAdapt infers SNPs that are related to population structure and are candidates to local adaptation (Luu et al., 2017) based in Mahalanobis distance (1936). The corresponding program is an R package and is applied by the pcadapt function, using an FDR threshold of 5% with the qvalue package v2.6.0 (Storey et al., 2015) of the RStudio framework.
Gene identification and gene ontology enrichment analysis
The next step is to understand the process of selection that could have influenced their divergence. For that, we investigate the SNPs that showed selection using gene annotations from NCBI and Ensembl. Using the orca genome (O. orca, Oorc_1.1, 200.0x coverage, Foote et al., 2015; Morin et al., 2010) and through BLASTN v2.8.0+ (Eric et al., 2014) we obtained the gene information for each SNP and queried the following genomes for homologous genes: Dolphin (T. truncatus, NIST Tur_tru v1, 114.5x coverage), Baiji Dolphin (L. vexillifer, Lipotes_vexillifer_v1, 115x coverage, Zhou et al., 2013)), cow
Chapter II | Materials and Methods
13
(Bos taurus, Bos_taurus_UMD_3.1.1, 9x coverage), Horse, (Equus caballus, EquCab3.0, 88.0x coverage), Dog, (Canis lupus, CanFam3.1, 7x coverage), Human (Homo sapiens, GRCh38.p12), mouse (Mus musculus, GRCm38.p6). After the identification of the genes, the same genes were tested for significant enrichment of Gene Ontology (GO) categories using functional annotation clustering tool DAVID v6.8 (Huang et al., 2009a, 2009b) and PANTHER v13.1 (Mi et al., 2017). In both tools the gene list was used to search against a background of human orthologues, and to examined the significant categories with a p-value inferior to 0.05, a correction for multiple testing the Fisher’s Exact with FDR was used.