Article
Nutritional Value, Chemical Characterization and
Bulb Morphology of Greek Garlic Landraces
Spyridon A. Petropoulos1,*ID,Ângela Fernandes2, Georgia Ntatsi3, Konstantinos Petrotos4, Lillian Barros2,5and Isabel C. F. R. Ferreira2,*ID
1 Department of Agriculture, University of Thessaly, Crop Production and Rural Environment, N. Ionia, 38446 Magnissia, Greece
2 Mountain Research Centre (CIMO), ESA, Polytechnic Institute of Bragança, Campus de Santa Apolónia, 1172, 5300-253 Bragança, Portugal; afeitor@ipb.pt (Â.F.); lillian@ipb.pt (L.B.)
3 Department of Crop Production, Agricultural University of Athens, Iera Odos 75, 11855 Athens, Greece; gntatsi@aua.gr
4 Department of Biosystems Engineering, Technological Educational Institute of Thessaly, 41110 Larissa, Greece; petrotos@teilar.gr
5 Laboratory of Separation and Reaction Engineering-Laboratory of Catalysis and Materials (LSRE-LCM), Polytechnic Institute of Bragança, Campus de Santa Apolónia, 1172, 5300-253 Braganza, Portugal * Correspondence: spetropoulos@uth.gr (S.A.P.); iferreira@ipb.pt (I.C.F.R.F.);
Tel: +30-242-109-3196 (S.A.P.); +351-273-303-219 (I.C.F.R.F.); Fax: +30-242-109-3155 (S.A.P.); +351-273-325-405 (I.C.F.R.F.)
Received: 5 January 2018; Accepted: 1 February 2018; Published: 2 February 2018
Abstract:Garlic (Allium sativumL.) is an important vegetable crop throughout the world. In Greece there are many areas which have specialized in garlic cultivation through the last decades, considered the main production areas. However, despite the significance of garlic as a food product and the high annual income of this crop, there is a decreasing trend in total cultivated area in Greece, and the local landraces are gradually neglected in favor of new imported genotypes. In the present study, garlic genotypes (local landraces/varieties, imported genotypes, commercial cultivars) from the main production regions of Greece were assessed for their chemical composition and quality (total soluble solids, dry matter content, nutritional value, mineral composition, organic acids, fatty acids content and free sugars content), and bulb morphology. The results of the present study showed significant diversity in quality features and bulb morphology, not only between the genotypes from different growing regions, but also between those of the same region. This result is interesting since it could be implemented for further improvement and valorization of this important vegetable crop through extensive breeding programs within the framework of sustainability and genetic, material conservation.
Keywords:Allium sativumL.; bulb morphology; garlic; mineral composition; pyruvic acid
1. Introduction
Garlic (Allium sativumL.) is the most economically important species of the Allium genus and an important vegetable crop throughout the world [1]. In Greece, there are many areas which have specialized in garlic cultivation during the last centuries and are considered the main production areas for dry bulbs, while the crop is considered a part of the popular culture of these regions. However, despite the importance of this crop for the local communities and the high annual farmers’ income, there is a decreasing trend in total cultivated area during the last decade, whereas the local landraces that used to be the main genotypes cultivated in certain areas tend to be neglected in favor of new, more productive imported genotypes from Brazil, Chile, China, Egypt, and so on. Such a trend belies a great genetic erosion risk with many local landraces being lost during the last decades.
Garlic is considered a rich source of volatile compounds, which are responsible for the distinct flavor and the bioactive properties of dry bulbs [2]. There is also a high content of non-volatile compounds with well-known medicinal and therapeutic properties, such as amides, nitrogen oxides, phenolic compounds, especially flavonoids, proteins, saponins and sapogenins [3–5], as well as antioxidants, minerals (especially P, K and Se) and vitamins (especially vitamin C and vitamins of B complex) [6]. According to Koch and Lawson [7], dry garlic bulbs mainly consist of water (62–68%) and carbohydrates (26–30%), while proteins are detected in relatively less amounts (1.5–2.1%). Moreover, protein contents of 4–6% are also very common in various cultivars, considering the high dry matter content of the bulbs, while ash content ranges between 0.6% and 1.0%, and energy content is around 140 kcal 100 g–1f.w. [1].
Genotype has a significant effect on the chemical composition of garlic bulbs; therefore the cultivar choice, according to the climate requirements and market quality standards, could be an important means towards the quality improvement of the final products. Despite the fact that garlic is propagated asexually with cloves in many areas of the world by farmers who use their own cloves from the previous growing season, there is also a great diversity in morphological and agronomic characters, mostly due to the existence of various ecotypes that are cultivated in the same areas for a long time and the consequent accumulation of natural mutations [8,9]. Gonzalez et al. [10] have detected significant variability in terms of organosulfur compounds, pungency, total soluble solids and antiplatelet activity, not only between garlic clones belonging in different ecophysiological groups, but also between clones of the same group. According to Mohammadi et al. [9], there was a relationship between geographical origin and genetic diversity for various Iranian garlic landraces, whereas differences in germplasm were mostly due to genotype and transfer of plant material between the various growing areas. Moreover, Singh et al. [11] analyzed the morphological variability of 47 Indian garlic collections and they suggested the existence of only two major phylogenetic groups, which could be attributed to the vegetative nature of propagation.
The existent genetic variation in garlic genotypes cultivated in Greece and its relation with the biochemical and antimicrobial properties of garlic have also been reported [12]. Fanaei et al. [13] observed significant differences in garlic pungency among various genotypes, while Jabbes et al. [14] reported significant differences in organosulfur compounds content among 31 Tunisian garlic landraces. Moreover, apart from the genotype, growing conditions and cultivation practices have also an important effect on chemical composition of garlic bulbs. In particular, fertilizer regime and soil properties may have a significant effect on bulb quality features, such as dry matter, protein and total soluble solids content, pungency and mineral composition of dry garlic bulbs [15].
Differences in bulb skin color have been associated with significant differences in chemical composition and quality of garlic genotypes. Gadel-Hak et al. [16] studied six garlic genotypes with different skin colors (white and purple skin), and they detected significant differences in vitamin C and total fractionated oil contents (higher for purple color genotypes), as well as in total phenolic compounds and flavonoids content (higher for white color genotypes). Such an interaction between bulb skin color and chemical composition was also suggested by Hong et al. [17] regarding the fructan content in garlic bulbs.
The aim of the present study was to assess various garlic genotypes, including local landraces/ varieties, imported genotypes and commercial cultivars cultivated in the main growing areas of Greece, for their nutritional value, chemical composition and bulb morphological traits.
2. Results and Discussion
14). Fanaei et al. [13] and Mohammadi et al. [9] have also reported significant differences among Iranian garlic varieties and landraces in bulb yield, bulb weight, number of cloves per bulb and clove weight, while Jabbes et al. [14] and Singh et al. [11] have detected a great diversity in agro-morphological traits of various Tunisian and Indian garlic landraces and accessions, respectively. Dry matter and total soluble solids content ranged from as low as 31.67% (sample 9) and 31.8% (sample 10) respectively, to 42.64% (sample 11) and 40.4% (sample 12) respectively, with significant differences being observed not only between the various areas but also between genotypes of the same area. This could be attributed to different cultivation practices, soil properties and postharvest handling, as has been already reported by Diriba-Shiferaw et al. [15] and Argüello et al. [19].
However, despite the diversity between the garlics of different growing areas, similarities in most of the studied morphological features were observed between genotypes of the same growing areas, for example samples from ‘Nea Vissa’ (1 and 2), ‘Neapoli’ (3 and 14), and ‘Tripoli’ regions (11–13), indicating that adaptation to specific growing conditions and clonal selection from farmers throughout the centuries has led to uniformity of the final products [20]. Figliuolo et al. [8] suggested that selection over time according to specific agronomic traits (e.g., bulb weight and number of cloves per bulb) may be achieved by farmers, however for traits that are negatively correlated to bulb size (e.g., number of cloves per bulb and clove circumference) the adequate trade-offs have to be considered for the overall quality of the final product based on market standards [11]. Moreover, any slight differences in bulb and clove size, as well as in number of cloves per bulb, such as in the case of samples 11–13 could be attributed mainly to different cultivation practices (fertilization regime, set size, etc.), as has been already reported by Minard [21] and Rosen and Tong [22]. Since the available garlic cultivars are the result of successive accumulation of somatic mutations in ancestral mother cultivars, it is very usual for the same clone to be cultivated in different areas under different names [23].
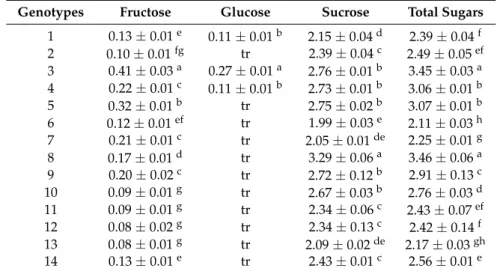
Table 1.Morphological features of dry bulbs of the studied garlic genotypes according to International Plant Genetic Resources Institute (IPGRI, 2001) [18].
Genotypes Bulb * Shape
Bulb Skin Colour
Clove Skin Colour
Number of Cloves
Bulb Structure
Type
Shape of the Compound Bulb in
Horizontal Section
Average Weight of 10
Cloves
Dry Matter (%)
TSS (Brix◦)
1 3 1–6 2 4 1 1 4 37.60 37.9
2 3 1–6 2 4 1 1 4 39.91 36.4
3 2–3 1 1–2 6 1 1 1 38.86 39.4
4 3 1–6 3–5 4 1–2 1 4 35.80 35.2
5 3 1 1–2 4 1–2 1 3 32.61 33.7
6 2 2–3 2 4 1 1 4 34.02 34.2
7 3 2–3 2 4 1 1 2 32.60 34.3
8 3 1 2 5 1 1 4 35.71 37.7
9 3 1–6 2–5 4 1–2 1 2 31.67 33.6
10 3 1–6 2 4 1–2 1 3 32.27 31.8
11 2 2–3–5 3–5 4 1–2 1 4 42.64 40.4
12 2 2–3–5 3–5 6 1–2 1 4 40.52 37.6
13 2 2–3 3–5 5 1–2 1 5 36.65 36.8
14 2–3 1 1–2 6 1 1 1 33.94 39.0
Table 2.Nutritional value of the studied garlic genotypes (mean±SD;n= 3).
Genotypes Humidity (%) Ash (g/100 g f.w.) Proteins (g/100 g f.w.) Fat (g/100 g f.w.) Carbohydrates (g/100 g f.w.) Energy (kcal/100 g f.w.)
1 62.38±1.79defg 1.44±0.02fg 6.44±0.07c 0.21±0.01g 29.53±1.76bcd 145.76±7.25bcd
2 60.09±1.78fgh 1.47±0.03ef 6.25±0.05d 0.27±0.01e 31.92±1.77bc 155.08±7.17ab
3 61.14±0.96efgh 1.40±0.03g 5.15±0.07g 0.32±0.01bc 31.99±1.03bc 151.44±3.87abc
4 64.20±0.93bcde 1.65±0.02c 6.23±0.02d 0.30±0.01d 27.62±0.93def 138.16±3.72cdef
5 67.39±2.16abc 1.87±0.01a 7.27±0.05b 0.33±0.02b 23.13±2.19h 124.60±8.72f
6 65.33±1.13abcd 1.52±0.03de 7.34±0.05ab 0.28±0.01e 25.53±1.14efgh 133.96±4.44def
7 67.39±0.78abc 1.25±0.03h 7.45±0.18a 0.36±0.01a 23.54±0.90gh 127.20±3.20ef
8 64.29±1.57bcde 1.55±0.04d 6.42±0.02c 0.37±0.01a 27.38±1.58defg 138.48±6.40cdef
9 68.33±1.00a 1.26±0.03h 6.27±0.03d 0.26±0.01e 23.87±0.97fgh 122.94±3.94f
10 67.73±0.96ab 1.16±0.03i 5.63±0.03f 0.24±0.02f 25.24±0.96efgh 125.64±3.85ef
11 57.36±0.40h 1.87±0.03a 4.62±0.06h 0.12±0.01h 36.03±0.35a 163.69±1.51a
12 59.48±1.14gh 1.75±0.04b 6.07±0.02e 0.12±0.01h 32.58±1.15ab 155.69±4.57ab
13 63.65±1.85cdef 1.45±0.03efg 6.42±0.02c 0.20±0.01g 28.28±1.85cde 140.58±7.39bcde
14 66.06±0.71abcd 1.31±0.02h 5.12±0.04g 0.31±0.01cd 27.19±0.69defg 132.05±2.80def
Mineral composition of garlic bulbs is presented in Table3. The main minerals were K (ranging from 446 to 675 mg g–1f.w.) and Ca (ranging from 163 to 963 mg g–1f.w.), while Fe and Zn were also detected in considerable amounts. Apart from the differences between the genotypes from different growing areas, there were also differences between the ecotypes from the same region. According to Vadalàet al. [25] mineral composition of garlic bulbs could be used as a means for origin discrimination
between samples of different growing areas in Spain, Tunisia and Italy. Hacısefero˘gulları et al. [24] and Akinwande and Olatunde [26] have also reported significant amounts of K in garlic bulbs, while Mg, Na and Ca were also detected in considerable amounts. In addition, fertilizer application rates and soil properties may have a significant effect on the mineral composition of garlic bulbs, as previously supported by Diriba-Shiferaw et al. [15] Põldma et al. [27] have also reported that
although Se fertilization is recommended for larger bulbs and better antioxidant activity of garlic, high Se application rates can result in the replacement of S by Se in plant metabolism and consequently the decrease in the content of essential macronutrients such as P, K and Ca.
Table 3.Mineral composition of the garlic genotypes studied (mg/100 g f.w.; mean values±SD;n= 3).
G * K Na Ca Mg Mn Fe Zn
1 529±16de 18.1±1.5d 359±47c 23.1±4.3e 1.39±0.08abc 3.52±0.64efg 0.81±0.08cde
2 492±5ef 12.0±1.6e 551±76b 49.0±5.2b 1.39±0.20abc 5.12±0.32abc 0.69±0.18defg
3 446±47g 36.0±3.5a 321±78cd 33.9±2.7cde 1.26±0.16bc 3.45±0.36efg 0.55±0.06g
4 508±7ef 12.4±2.1e 332
±49cd 37.5±13.0bc 1.31±0.19bc 5.43±0.57ab 0.86±0.06cd
5 583±29bc 23.9±2.1b 259±42d 31.7±1.9cde 1.23±0.20c 4.62±0.81bcd 1.52±0.21a
6 605±48b 12.1±1.4e 347±73cd 32.9±9.3cde 1.35±0.06abc 2.89±0.24g 0.82±0.08cde
7 472±4fg 20.0±1.4cd 163±30e 30.2±7.0cde 1.44±0.12ab 3.37±0.92fg 0.83±0.04cde
8 552±25cd 12.1±1.2e 404±22c 31.4
±5.0cde 1.37±0.07abc 4.04±0.85def 1.28±0.21b
9 469±13fg 22.8±2.9bc 361±37c 25.5
±1.3de 1.29±0.07bc 2.88±0.21g 0.89±0.06c
10 480±21fg 19.4±1.7d 322±57cd 34.4±8.2cde 1.30±0.07bc 4.69±0.55bcd 1.19±0.07b
11 585±13bc 12.8±1.7e 264±95d 26.4±11.2cde 1.54±0.04a 4.38±0.65cde 0.63±0.04efg
12 675±19a 7.0±0.5f 333±19cd 25.4±6.9de 1.52±0.04a 5.78±0.59a 0.76±0.03cdef
13 603±26b 7.8±1.1f 5557±22b 23.5±5.5e 1.36
±0.13abc 3.75±0.66defg 0.72±0.12cdefg
14 505±27ef 18.8±0.4d 963±38a 63.1±2.0a 1.31±0.06bc 3.27±0.46fg 0.58±0.06fg
* G: genotypes; In each column different Latin letters mean significant differences between samples (p< 0.05).
Organic acid content of the garlic genotypes studied is presented in Table4. The major organic acid was pyruvic acid which constituted up to 61% of total organic acids, while citric, malic and oxalic acids were detected in lower amounts. Citric and malic acid were also detected in Italian garlic varieties by Ritota et al. [28], while they additionally reported the presence of fumaric and formic acids which were not detected in the samples of the present study. This difference between the two studies regarding the organic acid composition could be due to the different assays implemented in each case (Nuclear Magnetic Resonance and Liquid Chromatography analysis). Moreover, a great diversity in organic acids composition was observed between the genotypes studied, regardless of the growing area, suggesting that apart from the genotype other factors may affect chemical composition of dry garlic bulbs. Vargas et al. [29] have reported similar results for Argentinian garlics, where they observed significant differences in the pyruvic acid content not only between different cultivars from the same area but also between the same cultivar grown in different areas. According to Põldma et al. [27]
sulfur fertilizer rates may have a significant effect on pyruvic acid content and consequently on bulb pungency.
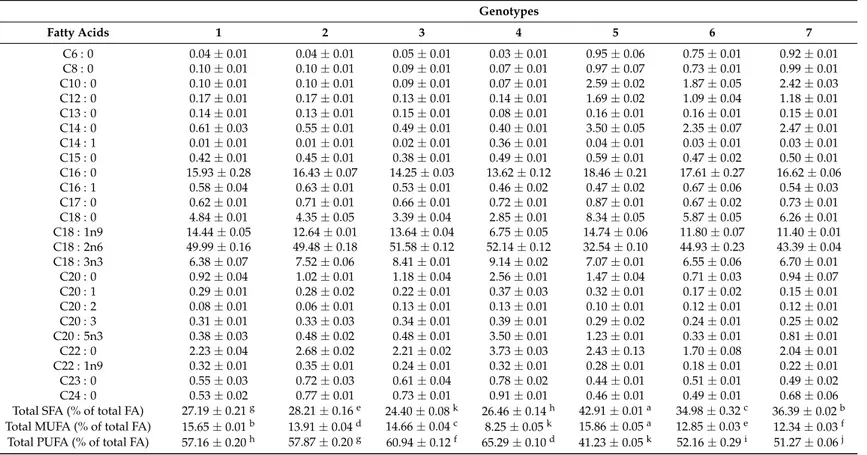
genotypes where stearic acid (C18 : 0),α-linolenic acid (ALA, C18 : 3n3), and behenic acid (C22 : 0).
Myristic acid (C14 : 0) was detected in higher amount in samples 5, 6 and 7, eicosapentaenoic acid (C20 : 5n3) in sample 4 and arachidic acid (C20 : 0) in samples 4, 5, 8, 9 and 14. Similarly, Ritota et al. [28] and Chhokar et al. [30] have also identified linoleic acid and palmitic as the main fatty acids in garlic bulbs, whereas they also reported that unsaturated fatty acids content and the ratio of unsaturated to saturated fatty acids decreases from the inner to the outer cloves of the bulb.
Table 4.Organic acids of the studied garlic genotypes (g/100 g f.w.; mean±SD;n= 3).
Genotypes Oxalic Acid Malic Acid Pyruvic Acid Citric Acid Total
1 0.20±0.01h 0.48±0.01c 1.67±0.01c 0.61±0.01i 2.96±0.01e 2 0.14±0.01k 0.36±0.01d 1.09±0.01j 0.61±0.01i 2.20±0.01i 3 0.30±0.01b 0.60±0.01a 1.30±0.01i 1.07±0.01c 3.27±0.01c 4 0.23±0.01g 0.44±0.01c 1.55±0.01e 0.85±0.01e 3.07±0.01d 5 0.35±0.01a 0.54±0.01b 1.77±0.01b 1.20±0.01a 3.86±0.01a 6 0.29±0.01c 0.36±0.01d 1.41±0.01g 0.68±0.03g 2.74±0.04f 7 0.27±0.01e 0.31±0.01e 1.53±0.01e 0.60±0.02i 2.72±0.01f 8 0.28±0.01d 0.32±0.01de 1.91±0.01a 1.15±0.01b 3.66±0.02b 9 0.27±0.01e 0.54±0.08b 1.06±0.01k 0.89±0.01d 2.77±0.06f 10 0.24±0.01f 0.19±0.02f 1.33±0.03h 0.84±0.02e 2.60±0.03g 11 0.11±0.01l 0.20±0.01f 1.46±0.01f 0.60±0.01i 2.38±0.01h 12 0.18±0.01i 0.10±0.01g 1.07±0.01jk 0.81±0.01f 2.16±0.01i 13 0.23±0.01g 0.30±0.01e 1.58±0.01d 0.65±0.02h 2.75±0.02f 14 0.15±0.01j 0.18±0.01f 0.95±0.01l 0.68±0.01g 1.96±0.01j
In each column different Latin letters mean significant differences between samples (p< 0.05).
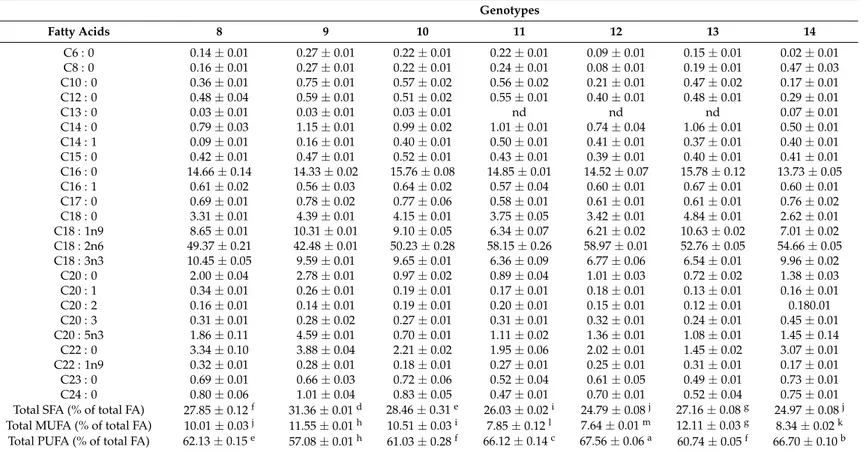
Sugar composition of the garlic genotypes studied is presented in Table6. The main sugar was sucrose which ranged from 1.99 to 3.29 g 100 g–1f.w. and constituted up to 97% of total sugar content. Fructose was also detected in relatively low amounts, while glucose was detected in only three of the studied genotypes (samples 1, 3 and 4). Ritota et al. [28] have also identified sucrose as the main carbohydrate in Italian garlics, while they also detected 1H signals that correspond to fructose and glucose. Moreover, Cardelle-Cobas et al. [31] studied garlic samples from Spanish markets and reported similar results to our study regarding sucrose, fructose and glucose content of dry bulbs, as well as other fructo-oligosaccharides with degree of polymerization from 3 to 7. Argüello et al. [19] have also detected significant amounts of scorodose, especially at the end of the bulbing period (about 170 days after sowing) when it was identified as the main carbohydrate.
Table 5.Composition of fatty acids (relative %) of the studied garlic genotypes (mean±SD;n= 3).
Genotypes
Fatty Acids 1 2 3 4 5 6 7
C6 : 0 0.04±0.01 0.04±0.01 0.05±0.01 0.03±0.01 0.95±0.06 0.75±0.01 0.92±0.01 C8 : 0 0.10±0.01 0.10±0.01 0.09±0.01 0.07±0.01 0.97±0.07 0.73±0.01 0.99±0.01 C10 : 0 0.10±0.01 0.10±0.01 0.09±0.01 0.07±0.01 2.59±0.02 1.87±0.05 2.42±0.03 C12 : 0 0.17±0.01 0.17±0.01 0.13±0.01 0.14±0.01 1.69±0.02 1.09±0.04 1.18±0.01 C13 : 0 0.14±0.01 0.13±0.01 0.15±0.01 0.08±0.01 0.16±0.01 0.16±0.01 0.15±0.01 C14 : 0 0.61±0.03 0.55±0.01 0.49±0.01 0.40±0.01 3.50±0.05 2.35±0.07 2.47±0.01 C14 : 1 0.01±0.01 0.01±0.01 0.02±0.01 0.36±0.01 0.04±0.01 0.03±0.01 0.03±0.01 C15 : 0 0.42±0.01 0.45±0.01 0.38±0.01 0.49±0.01 0.59±0.01 0.47±0.02 0.50±0.01
C16 : 0 15.93±0.28 16.43±0.07 14.25±0.03 13.62±0.12 18.46±0.21 17.61±0.27 16.62±0.06 C16 : 1 0.58±0.04 0.63±0.01 0.53±0.01 0.46±0.02 0.47±0.02 0.67±0.06 0.54±0.03 C17 : 0 0.62±0.01 0.71±0.01 0.66±0.01 0.72±0.01 0.87±0.01 0.67±0.02 0.73±0.01 C18 : 0 4.84±0.01 4.35±0.05 3.39±0.04 2.85±0.01 8.34±0.05 5.87±0.05 6.26±0.01 C18 : 1n9 14.44±0.05 12.64±0.01 13.64±0.04 6.75±0.05 14.74±0.06 11.80±0.07 11.40±0.01 C18 : 2n6 49.99±0.16 49.48±0.18 51.58±0.12 52.14±0.12 32.54±0.10 44.93±0.23 43.39±0.04 C18 : 3n3 6.38±0.07 7.52±0.06 8.41±0.01 9.14±0.02 7.07±0.01 6.55±0.06 6.70±0.01
C20 : 0 0.92±0.04 1.02±0.01 1.18±0.04 2.56±0.01 1.47±0.04 0.71±0.03 0.94±0.07 C20 : 1 0.29±0.01 0.28±0.02 0.22±0.01 0.37±0.03 0.32±0.01 0.17±0.02 0.15±0.01 C20 : 2 0.08±0.01 0.06±0.01 0.13±0.01 0.13±0.01 0.10±0.01 0.12±0.01 0.12±0.01 C20 : 3 0.31±0.01 0.33±0.03 0.34±0.01 0.39±0.01 0.29±0.02 0.24±0.01 0.25±0.02 C20 : 5n3 0.38±0.03 0.48±0.02 0.48±0.01 3.50±0.01 1.23±0.01 0.33±0.01 0.81±0.01 C22 : 0 2.23±0.04 2.68±0.02 2.21±0.02 3.73±0.03 2.43±0.13 1.70±0.08 2.04±0.01 C22 : 1n9 0.32±0.01 0.35±0.01 0.24±0.01 0.32±0.01 0.28±0.01 0.18±0.01 0.22±0.01
C23 : 0 0.55±0.03 0.72±0.03 0.61±0.04 0.78±0.02 0.44±0.01 0.51±0.01 0.49±0.02 C24 : 0 0.53±0.02 0.77±0.01 0.73±0.01 0.91±0.01 0.46±0.01 0.49±0.01 0.68±0.06 Total SFA (% of total FA) 27.19±0.21g 28.21±0.16e 24.40±0.08k 26.46±0.14h 42.91±0.01a 34.98±0.32c 36.39±0.02b
Total MUFA (% of total FA) 15.65±0.01b 13.91±0.04d 14.66±0.04c 8.25±0.05k 15.86±0.05a 12.85±0.03e 12.34±0.03f
Table 5.Cont.
Genotypes
Fatty Acids 8 9 10 11 12 13 14
C6 : 0 0.14±0.01 0.27±0.01 0.22±0.01 0.22±0.01 0.09±0.01 0.15±0.01 0.02±0.01 C8 : 0 0.16±0.01 0.27±0.01 0.22±0.01 0.24±0.01 0.08±0.01 0.19±0.01 0.47±0.03 C10 : 0 0.36±0.01 0.75±0.01 0.57±0.02 0.56±0.02 0.21±0.01 0.47±0.02 0.17±0.01 C12 : 0 0.48±0.04 0.59±0.01 0.51±0.02 0.55±0.01 0.40±0.01 0.48±0.01 0.29±0.01 C13 : 0 0.03±0.01 0.03±0.01 0.03±0.01 nd nd nd 0.07±0.01 C14 : 0 0.79±0.03 1.15±0.01 0.99±0.02 1.01±0.01 0.74±0.04 1.06±0.01 0.50±0.01 C14 : 1 0.09±0.01 0.16±0.01 0.40±0.01 0.50±0.01 0.41±0.01 0.37±0.01 0.40±0.01 C15 : 0 0.42±0.01 0.47±0.01 0.52±0.01 0.43±0.01 0.39±0.01 0.40±0.01 0.41±0.01
C16 : 0 14.66±0.14 14.33±0.02 15.76±0.08 14.85±0.01 14.52±0.07 15.78±0.12 13.73±0.05 C16 : 1 0.61±0.02 0.56±0.03 0.64±0.02 0.57±0.04 0.60±0.01 0.67±0.01 0.60±0.01 C17 : 0 0.69±0.01 0.78±0.02 0.77±0.06 0.58±0.01 0.61±0.01 0.61±0.01 0.76±0.02 C18 : 0 3.31±0.01 4.39±0.01 4.15±0.01 3.75±0.05 3.42±0.01 4.84±0.01 2.62±0.01 C18 : 1n9 8.65±0.01 10.31±0.01 9.10±0.05 6.34±0.07 6.21±0.02 10.63±0.02 7.01±0.02 C18 : 2n6 49.37±0.21 42.48±0.01 50.23±0.28 58.15±0.26 58.97±0.01 52.76±0.05 54.66±0.05 C18 : 3n3 10.45±0.05 9.59±0.01 9.65±0.01 6.36±0.09 6.77±0.06 6.54±0.01 9.96±0.02
C20 : 0 2.00±0.04 2.78±0.01 0.97±0.02 0.89±0.04 1.01±0.03 0.72±0.02 1.38±0.03 C20 : 1 0.34±0.01 0.26±0.01 0.19±0.01 0.17±0.01 0.18±0.01 0.13±0.01 0.16±0.01 C20 : 2 0.16±0.01 0.14±0.01 0.19±0.01 0.20±0.01 0.15±0.01 0.12±0.01 0.180.01 C20 : 3 0.31±0.01 0.28±0.02 0.27±0.01 0.31±0.01 0.32±0.01 0.24±0.01 0.45±0.01 C20 : 5n3 1.86±0.11 4.59±0.01 0.70±0.01 1.11±0.02 1.36±0.01 1.08±0.01 1.45±0.14 C22 : 0 3.34±0.10 3.88±0.04 2.21±0.02 1.95±0.06 2.02±0.01 1.45±0.02 3.07±0.01 C22 : 1n9 0.32±0.01 0.28±0.01 0.18±0.01 0.27±0.01 0.25±0.01 0.31±0.01 0.17±0.01
C23 : 0 0.69±0.01 0.66±0.03 0.72±0.06 0.52±0.04 0.61±0.05 0.49±0.01 0.73±0.01 C24 : 0 0.80±0.06 1.01±0.04 0.83±0.05 0.47±0.01 0.70±0.01 0.52±0.04 0.75±0.01 Total SFA (% of total FA) 27.85±0.12f 31.36±0.01d 28.46±0.31e 26.03±0.02i 24.79±0.08j 27.16±0.08g 24.97±0.08j
Total MUFA (% of total FA) 10.01±0.03j 11.55±0.01h 10.51±0.03i 7.85±0.12l 7.64±0.01m 12.11±0.03g 8.34±0.02k
Total PUFA (% of total FA) 62.13±0.15e 57.08±0.01h 61.03±0.28f 66.12±0.14c 67.56±0.06a 60.74±0.05f 66.70±0.10b
Table 6.Free sugars of the studied garlic genotypes (g/100 g f.w.; mean±SD;n= 3).
Genotypes Fructose Glucose Sucrose Total Sugars
1 0.13±0.01e 0.11±0.01b 2.15±0.04d 2.39±0.04f 2 0.10±0.01fg tr 2.39±0.04c 2.49±0.05ef 3 0.41±0.03a 0.27±0.01a 2.76±0.01b 3.45±0.03a 4 0.22±0.01c 0.11±0.01b 2.73±0.01b 3.06±0.01b 5 0.32±0.01b tr 2.75±0.02b 3.07±0.01b 6 0.12±0.01ef tr 1.99±0.03e 2.11±0.03h 7 0.21±0.01c tr 2.05±0.01de 2.25±0.01g 8 0.17±0.01d tr 3.29±0.06a 3.46±0.06a 9 0.20±0.02c tr 2.72±0.12b 2.91±0.13c 10 0.09±0.01g tr 2.67±0.03b 2.76±0.03d 11 0.09±0.01g tr 2.34±0.06c 2.43±0.07ef 12 0.08±0.02g tr 2.34±0.13c 2.42±0.14f 13 0.08±0.01g tr 2.09±0.02de 2.17±0.03gh 14 0.13±0.01e tr 2.43±0.01c 2.56±0.01e tr: traces; In each column, different Latin letters mean significant differences between samples (p< 0.05).
Argüello et al. [19] suggested that the growth stage also has a significant effect on sugar composition, as well as vermicompost application which may result in earlier start of bulbing and consequently in higher carbohydrates content, expressed mainly by scorodose.
3. Materials and Methods
3.1. Plant Material and Sampling
Samples of garlic bulbs were collected during the growing season of 2014–2015 (autumn to summer), at full maturity and after curing, from local farms from different regions of Greece, namely: (a) two samples of “Nea Vissa” garlic (local variety) from Evros Prefecture (samples 1 and 2); (b) three samples of “Neapoli” garlic from Laconia Prefecture, including two samples of the local landrace and one sample of Chinese origin (samples 3, 4, and 14, respectively); (c) one sample (Chinese origin) from Euboea Prefecture (sample 5); (d) two samples from Magnissia Prefecture, including one sample of “Platykampos” garlic (local landrace) and one sample of Chinese origin (samples 6 and 8); (e) three samples of “Tripoli” garlic (local variety) from Arcadia Prefecture (samples 11–13, from the regions “Stadio”, “Lithovounia” and “Mavriki”, respectively). In addition, apart from the samples collected from local farms, three more samples from garlics cultivated at the experimental farm of the University of Thessaly, Velestino, Greece, were included in the analyses, namely the local landrace “Platykampos” (sample 7), one cultivar from Messinia Prefecture (local landrace), (sample 9), and one commercial cultivar (Gardos, AGER S.A.; sample 10).
3.2. Standards and Reagents
Acetonitrile (99.9%), n-hexane (95%) and ethyl acetate (99.8%) were High Pressure Liquid Chromatography (HPLC) grade from Fisher Scientific (Lisbon, Portugal). The water was obtained from a purification system Millipore Direct-Q (TGI Pure Water Systems, Greenville, SC, USA). Fatty acids methyl esters standard mixture (standard 47885-U) sugars and organic acids standards were purchased from Sigma-Aldrich (St. Louis, MO, USA).
3.3. Morphological and Quality Features
type, bulb shape in horizontal section, the weight of 10 cloves and the dry matter content (%) and total soluble solids (◦Brix) of the edible portion of cloves (Table1). All morphology features were recorded according to International Plant Genetic Resources Institute descriptors forAlliumspp. [18]. Pictures of selected genotypes are presented in Figure1.
−
−
Figure 1.Pictures of selected genotypes and local landraces of the studied garlics. Numbers on each picture correspond to specific genotypes as described in the Materials and Methods section (Pictures with numbers 1, 3, 5, 8, 11, 12, 13, 14 have been offered by Mr. Nikolaos Polyzos).
For each bulb, total soluble solids (TSS) content was measured with a hand-held refractometer (TR53000C; T.R. Turoni SRL, Forlì, Italy) on juice taken from the edible part after separating, peeling
and squeezing the cloves with a kitchen garlic press. Dry matter content (%) was estimated after drying peeled cloves in a forced-air oven at 72◦C to constant weight.
3.4. Nutritional and Chemical Composition
For chemical composition sampling, garlic bulbs were peeled in order to obtain separate cloves, which they were further peeled and cut in slices. Samples were taken from cloves from three batches of 15 bulbs from each genotype and all the samples were stored at deep freezing conditions (−80◦C)
and freeze dried prior to analysis. The freeze dried samples from each batch were powdered with pestle and mortar and stored at freezing conditions (−20◦C) until further analysis.
For macronutrients analysis, proteins, fat, carbohydrates and ash were determined using standard analytical methods described by American Organization of Analytical Chemists International (AOAC International) procedures [35]. Nitrogen content (N) was determined using the macro-Kjeldahl method, according to AOAC procedure 978.04 [36], protein content was calculated as N×6.25. Crude fat was
according to the AOAC procedures 923.03 [36]. Total carbohydrates were calculated by difference and energy was calculated following the equation: Energy (kcal) = 4×(g protein) + 4×(g carbohydrate) +
9×(g fat).
For mineral composition analysis, samples of dry bulb tissue were dried in a forced-air oven at 72◦C to constant weight, ground to powder, subjected to dry ashing and extracted with 1 N HCl to determine the mineral. Ca, Mg, Fe, Mn, Zn, and Cu content were determined by atomic absorption spectrophotometry (Perkin Elmer 1100B, Waltham, MA, USA) and Na and K content by flame photometry (Sherwood Model 410, Cambridge, UK).
Organic acids were determined following a procedure previously described by Pereira et al. [37] and the analysis was performed by ultra-fast liquid chromatography coupled to photodiode array detection (UFLC-PDA; Shimadzu Cooperation, Kyoto, Japan), using 215 nm and 245 nm (for ascorbic acid) as preferred wavelengths.
Free sugars were determined by HPLC coupled to a Refractive Index detector (Knauer, Smartline system 1000, Berlin, Germany) using the internal standard (IS, melezitose) methodology as previously described by Guimarães et al. [38] Fatty acids were determined with a gas chromatographer coupled
to a flame ionization detector (GC-FID, DANI model GC 1000 instrument, Contone, Switzerland) as previously described by Guimarães et al. [38] and the results were expressed as relative percentage of
each fatty acid.
3.5. Statistical Analysis
For nutritional and chemical composition, three samples were analyzed for each genotype, and all of the assays were carried out in triplicate. The results were expressed as mean values and standard deviation (SD). The chemical composition and antioxidant activity were analyzed using one-way analysis of variance followed by Tukey’s Honest Significant Difference (HSD) test withα= 0.05 using
the Statistical Analysis Software (SAS) v. 9.1.3 statistical program (IBM Corp., Armonk, NY, USA). All the results are expressed as g/100 g f.w.
4. Conclusions
Overall, the Greek garlics studied showed a great diversity in their quality features and nutritional value, not only between the genotypes from different growing regions, but also between genotypes of the same region. This fact indicates that apart from genotype, growing conditions and cultivation practices may have an important effect on chemical composition and nutritional value and consequently on the quality of the final garlic products. Therefore, garlics of different regions showed similarities in terms of chemical composition and morphology, and vice-versa. Another reason that garlics of different regions were more similar than others from different regions may also be explained by transfer of plant material, especially when considering the vegetative method of propagation for the species, especially in temperate climates where this propagation method is the only one available. The existing diversity in nutritional quality is of great importance for the improvement and valorization of Greek garlics as high added value food products. Moreover, in order to discriminate and identify garlics from different regions, the results from chemical composition should be further exploited in order to create chemical fingerprinting of Greek garlics.
Acknowledgments: The authors are grateful to the Foundation for Science and Technology (FCT, Portugal) and FEDER under Program PT2020 for financial support to CIMO (UID/AGR/00690/2013), LSRE (Project UID/EQU/50020/2013) and L. Barros (SFRH/BPD/107855/2015) grant. We are also thankful to Nikolaos Polyzos for sharing photographs of his personal collection.
Author Contributions:S.A.P. and I.C.F.R.F. designed the experiments;Â.F., G.N. and K.P. performed the analytical assays and analyzed the data; S.A.P. and L.B. wrote the manuscript; S.P. and I.C.F.R.F. revised the manuscript.
References
1. Brewster, J.L.Onions and othe vegetable Alliums, 2nd ed.; CABI: Wallingford, UK, 2008.
2. Kimbaris, A.C.; Siatis, N.G.; Daferera, D.J.; Tarantilis, P.A.; Pappas, C.S.; Polissiou, M.G. Comparison of distillation and ultrasound-assisted extraction methods for the isolation of sensitive aroma compounds from garlic (Allium sativum).Ultrason. Sonochem.2006,13, 54–60. [CrossRef] [PubMed]
3. Lanzotti, V.; Scala, F.; Bonanomi, G. Compounds from Allium species with cytotoxic and antimicrobial activity.Phytochem. Rev.2014,13, 769–791. [CrossRef]
4. Lanzotti, V.; Bonanomi, G.; Scala, F. What makes Allium species effective against pathogenic microbes? Phytochem. Rev.2013,12, 751–772. [CrossRef]
5. Lu, X.; Ross, C.F.; Powers, J.R.; Aston, D.E.; Rasco, B.A. Determination of total phenolic content and antioxidant activity of garlic (Allium sativum) and elephant garlic (Allium ampeloprasum) by attenuated total reflectancefourier transformed infrared spectroscopy.J. Agric. Food Chem.2011,59, 5215–5221. [CrossRef] [PubMed]
6. Rekowska, E.; Skupie ´n, K. The influence of selected agronomic practices on the yield and chemical composition of winter garlic.Veg. Crop Res. Bull.2009,70, 173–182. [CrossRef]
7. Koch HP, L.L. Garlic: The Science and Therapeutic Application of Allium sativum L. and Related Species; Koch HP, L.L., Ed.; Williams & Wilkins Publishing Co.: Baltimore, MD, USA, 1996.
8. Figliuolo, G.; Candido, V.; Logozzo, G.; Miccolis, V.; Zeuli, P.L.S. Genetic evaluation of cultivated garlic germplasm (Allium sativumL. andA. ampeloprasumL.).Euphytica2001,121, 325–334. [CrossRef]
9. Mohammadi, B.; Khodadadi, M.; Karami, E.; Shaaf, S. Variation in agro-morphological characters in Iranian garlic landraces.Int. J. Veg. Sci.2014,20, 202–215. [CrossRef]
10. González, R.E.; Soto, V.C.; Sance, M.M.; Camargo, A.B.; Galmarini, C.R. Variability of solids, organosulfur compounds, pungency and health-enhancing traits in garlic (Allium sativum L.) cultivars belonging to different ecophysiological groups.J. Agric. Food Chem.2009,57, 10282–10288. [CrossRef] [PubMed] 11. Singh, L.; Kaul, V.; Gohil, R.N. Analysis of morphological variability in the Indian germplasm of
Allium sativumL.Plant Syst. Evol.2014,300, 245–254. [CrossRef]
12. Petropoulos, S.; Fernandes,Â.; Barros, L.; Ciric, A.; Sokovic, M.; Ferreira, I.C.F.R. Chemical composition, nutritional value and antioxidant properties of Mediterranean okra genotypes in relation to harvest stage. Food Chem.2018,245, 7–12. [CrossRef] [PubMed]
13. Fanaei, H.; Narouirad, M.; Farzanjo, M.; Ghasemi, M. Evaluation of yield and some agronomical traits in garlic genotypes (Allium sativumL.).Annu. Res. Rev. Biol.2014,4, 3386–3391. [CrossRef]
14. Jabbes, N.; Arnault, I.; Auger, J.; Al Mohandes Dridi, B.; Hannachi, C. Agro-morphological markers and organo-sulphur compounds to assess diversity in Tunisian garlic landraces.Sci. Hortic. (Amsterdam)2012, 148, 47–54. [CrossRef]
15. Diriba-Shiferaw, G.; Nigussie-Dechassa, R.; Woldetsadik, K.; Tabor, G.; Sharma, J.J. Bulb quality of Garlic (Allium sativumL.) as influenced by the application of inorganic fertilizers.African J. Agric. Res. 2014,9, 778–790. [CrossRef]
16. Gadel-Hak, S.-N.H.; Moustafa, Y.M.M.; Abdel-Naem, G.F.; Abdel-Wahab, I. Studying different quantitative and qualitative traits of some white- and colored-bulb garlic genotypes grown under a drip irrigation system. Aust. J. Basic Appl. Sci.2015,5, 1415–1427.
17. Hoon, H.G.; Koo, L.S.; Won, M. Alliin and fructan contents in garlics, by cultivars and cultivating areas. J. Korean Soc. Hortic. Sci.1997,38, 483–488.
18. IPGRI.Descriptors for Allium spp.; International Plant Genetic Resources Institute: Rome, Italy, 2001. 19. Argüello, J.A.; Ledesma, A.; Núñez, S.B.; Rodríguez, C.H.; Díaz Goldfarb, M.D.C. Vermicompost effects on
bulbing dynamics, nonstructural carbohydrate content, yield, and quality of “Rosado Paraguayo” garlic bulbs.HortScience2006,41, 589–592.
20. Baghalian, K.; Naghavi, M.R.; Ziai, S.A.; Badi, H.N. Post-planting evaluation of morphological characters and allicin content in Iranian garlic (Allium sativumL.) ecotypes.Sci. Hortic.2006,107, 405–410. [CrossRef] 21. Minard, H.R.G. Effect of clove size, spacing, fertilisers, and lime on yield and nutrient content of garlic
(Allium sativum).N. Z. J. Exp. Agric.1978,6, 139–143. [CrossRef]
23. Morales-Soto, A.; García-Salas, P.; Rodríguez-Pérez, C.; Jiménez-Sánchez, C.; Cádiz-Gurrea, M.; de la, L.; Segura-Carretero, A.; Fernández-Gutiérrez, A. Genetic divergence among Brazilian garlic cultivars based on morphological characters and AFLP markers.Food Res. Int.2014,58, 35–46.
24. Hacısefero˘gulları, H.; Özcan, M.; Demir, F.; Çalı¸sır, S. Some nutritional and technological properties of garlic (Allium sativumL.).J. Food Eng.2005,68, 463–469. [CrossRef]
25. Vadalà, R.; Mottese, A.; Bua, G.; Salvo, A.; Mallamace, D.; Corsaro, C.; Vasi, S.; Giofrè, S.; Alfa, M.; Cicero, N.; Dugo, G. Statistical analysis of mineral concentration for the geographic identification of garlic samples from Sicily (Italy), Tunisia and Spain.Foods2016,5, 20. [CrossRef] [PubMed]
26. Akinwande, B.A.; Olatunde, S. Comparative evaluation of the mineral profile and other selected components of onion and garlic.Int. Food Res. J.2015,22, 332–336.
27. Põldma, P.; Tõnutare, T.; Viitak, A.; Luik, A.; Moor, U. Effect of selenium treatment on mineral nutrition, bulb size, and antioxidant properties of garlic (Allium sativumL.).J. Agric. Food Chem.2011,59, 5498–5503. [CrossRef] [PubMed]
28. Ritota, M.; Casciani, L.; Han, B.-Z.; Cozzolino, S.; Leita, L.; Sequi, P.; Valentini, M. Traceability of Italian garlic (Allium sativumL.) by means of HRMAS-NMR spectroscopy and multivariate data analysis.Food Chem.2012, 135, 684–693. [CrossRef] [PubMed]
29. Soto Vargas, V.C.; Elizabeth González, R.; Mirta Sance, M.; Luis Burba, J.; Beatriz Camargo, A. Genotype-environment interaction on the expression of allicin and pyruvic acid in garlic (Allium sativumL.). Rev. La Fac. Ciencias Agrar.2010,42, 15–22.
30. Chhokar, V.; Sood, D.R.; Siwach, P.; Rani, M. Fatty acid composition of some promising genotypes of garlic (Allium sativumL.).Ann. Biol.2006,22, 23–26.
31. Cardelle-Cobas, A.; Costo, R.; Corzo, N.; Villamiel, M. Fructo-oligosaccharide changes during the storage of dehydrated commercial garlic and onion samples.Int. J. Food Sci. Technol.2009,44, 947–952. [CrossRef] 32. Bhandari, S.R.; Yoon, M.K.; Kwak, J.H. Contents of phytochemical constituents and antioxidant activity
of 19 garlic (Allium sativumL.) parental lines and cultivars. Hortic. Environ. Biotechnol.2014,55, 138–147. [CrossRef]
33. Pardo, E.J.; Escribano, J.; Gómez, R.; Alvarruiz, A. Physical-chemical and sensory quality evaluation of garlic cultivars.J. Food Qual.2007,30, 607–622. [CrossRef]
34. Imen, A.; Najjaa, H.; Neffati, M. Influence of sulfur fertilization on S-containing, phenolic, and carbohydrate metabolites in rosy garlic (Allium roseumL.): A wild edible species in North Africa.Eur. Food Res. Technol. 2013,237, 521–527. [CrossRef]
35. Association of Official Agricultural Chemists (AOAC).Official Methods of Analysis of AOAC International, 18th ed.; Horwitz, W., Latimer, G., Eds.; MD: AOAC International: Gaithersburg, MD, USA, 2005.
36. Association of Official Agricultural Chemists (AOAC).Official Methods of Analysis of AOAC International, 20th ed.; Horwitz, W., Latimer, G., Eds.; MD: AOAC International: Gaithersburg, MD, USA, 2016.
37. Pereira, C.; Calhelha, R.C.; Barros, L.; Ferreira, I.C.F.R. Use of UFLC-PDA for the analysis of organic acids in thirty-five species of food and medicinal plants.Ind. Crops Prod.2013,49, 61–65. [CrossRef]
38. Guimarães, R.; Barros, L.; Dueñas, M.; Calhelha, R.C.; Carvalho, A.M.; Santos-Buelga, C.; Queiroz, M.J.R.P.; Ferreira, I.C.F.R. Nutrients, phytochemicals and bioactivity of wild Roman chamomile: A comparison between the herb and its preparations.Food Chem.2013,136, 718–725. [CrossRef] [PubMed]
Sample Availability: Sample Availability: Not available.
![Table 1. Morphological features of dry bulbs of the studied garlic genotypes according to International Plant Genetic Resources Institute (IPGRI, 2001) [18]](https://thumb-eu.123doks.com/thumbv2/123dok_br/16974818.762378/4.1262.204.1058.167.432/morphological-features-genotypes-according-international-genetic-resources-institute.webp)