.Joao
======
~~
R.m.
na ,tal ! ~ ln l i"na
"'=~
:===;
69
73
79
85
89
93
97
101
107
111
117
123
131
137
143
149
ISS
161
•
167173
Comparing difTercnt filtcring and enhancemcllt methods to evaluate the impact 011 the geometry
reconstruction for medical images 179
A.1 locio. A. M. Galllbarllfo & A . SeqIleira
Fast identification af individuais based 00 iris characteristics for biometric systems 183
J. G Rogeri, M .A. POllte,l; A.S. Pereira, N. Marrangllelfo, A.F. Araujo &.1. Nf.R.S. Tavares
Monitoring reet temperature using thermography 189
D. Eelllo, F. C. AlolIteiro & A.l Pereira
Identification af faliar diseases in cottoo crop 193
A.A. Bemordes, J.G Rogeri, N. Alarrallghello, A.S. Pereira, A.F. Araujo & 1M.R.S. Tavares
A local invariant features approach for c1assifying acrosome integrity in boar spermatozoa 199 L.F. Robles, V. GOII:úfe:-Castro,
o.
Garcia-O/alia. M. T. Gan:Éa-Ordás & E. AlegreAnalysis of mixing of a c1othoid based passive micromixer: A numerical study 205
F. PelIlIel/a, S. Ripandelli, L. Ridolji, F Mastrangelo, Al.A. Deriu, FM. MOlllevecchi,
U Morbidllcci, M. Rasponi, }.tI. Rossi & CI Kiihler
Flow visualization of trace partic1es and Rcd Blood Cells in a microchannel with a diverging
and converging bifurcation 209
f-:
Leble, C Fernandes, R Dias, R. Lima, T. fshikall'a, Y. filiai & T. YamagllchiDocs tluid shear stress represent lhe degree of a Rcd Blood Cell deformation? 213
AI. Nakal11l1ra &
s.
WadaFlow of Rcd Blood CelIs through a microfluidic extensional device: An image ana1ysis assessment 217
T Yllgilll/lIla, A.l. Pereira, P..I. Rodriguej~ R. Lillla. lvf.S.N. Olil'eira, T. fshikml'{l & T. Yalllagllclli
An automatic method to track Red Blood Cells in microchanne1s 221
D. Pinho, F GaYllbo, A. Isabel & R. Lillla
Speech articulation assessment llsing dynamic Magnetic Resonance Imaging techniques 225 S. R. Ventura, M.I M. Vasconcelos, D.R. Freitas, f. /111. Ramos & 1M. R. S. Tavares
The breast lesions characterization by b values variation in the DW-Magnetic
Rcsonance Imaging 233
A.A. Ferna1/de . ~~ M.R. Ribeiro, IC. JaJlardo, S.D. JaguegiI'Glle & lvl.E. Pereira
Efficient lesion segmentation using Support Vcctor Machines 239
l-E. Fiol, L.D. Cohen, P. Ralliga & I Fripp
Multirnodality irnaging population ana1ysis llsing manifold learning 245
l-E. Fiot, L.D. CoheJl, P. Bourgeat, P. Ralliga,
o.
Acosta.f-:
VillelllagJle,o.
Salmdo & 1 Fripp2D MRI brain segmentation by using feasibility constraints 251
V. Pedoia, E. Binagbi, S. Balbi, A. De Benediclis, E. Nlami & R. l\1inotto
Stochastic bone remodeling process: From is otropy to anisotropy 257
N. M el/oI/li & A. Ricvrdeal/
Carotid artery atherosclerosis plaque analysis using CT and histology 261
F. SallfV.\; A . .llmlsen. 1 Saleniu.l" & H Eskola
Levei set framework for dctccting arterial lumen in llltrasound images 267
A. R Abdel-Dayelll '
Micromovement measuremcnts of endosseous dental implants with
3D Digital Image Correlation (DI e) method 273
A.T Rodrigues. B.A. Ne/o & c.P. Nicolall
Monte Carlo simlllation of PET images for injcction dose optimization 279
J. Boldy.i:, I DJlorúk.
o.
BélohlúJlek & "'I. Skopalol'lÍThc use of medicai thcrmal imaging in obstetrics 285
R. S imões & C. Nogueira-Silva
Computational Vision and Medicallmage Processing -Tavares & Natal Jorge (eds)
© 2012 Taylor & Francis Group, London,lSBN 978-0-415-68395-1
Monitoring reet temperature llsing thermography
D.
Bento &F.c.
MonteiroPolJ'tedmic Il1stitule
01
Bragal/ça, ESTiGIlPB,eSta.
Apolollill. Bragaflça, PO/'lIIg111A_L Pereira
PolJ'leclmic IlIstitute
01
Bragal/ça, ESTiGIIPB, C Sra. Apolollia, Bragall(.'a, Portl/galALGORITkfl, Milllw UlliI'ersil)', Campus dI.! A:/IrJm, G/limariies, Portugal
ABSTRACT: Studies show that regular monitoring of feet temperature may limit the incidence of disabling conditions such as foot ulccrs and lower-limb amputations. Infrared thermometry and liquid crystal thermography were identified as the leading lcchnologies in use today. In this study, we analysed lhe maximum temperaturc and tested some malhematical mode1s for lhe f 001 temperalure distribution.
INTRODUCTION
Diabetic foot (DF) ulcers are one of the major complications in dinbetics, seriously alTecting lhe quality of their lives. The possibility to mea su re the different aspects of DF and its ulcerative pathol-ogy gives to clinicians lhe chance lo both evaluale and weigh up the different components contribut-ing to the genesis and evolution of the cases and to monitor their clinicai course as a consequcnce of the therapeutic intcrventions. Thercfore, it is nec-essary to establish methods of prevention or carly diagnosis for diabetic foot complications (Nishide cl aI., 2009)_
The DF Icsions are a cornbination of severaJ risk factors acting simultaneously and cao be trig-gercd by peripheral diabetic neuropalhy, peripheral vascular diseases and biomechanical ehanges. Thc decreasc in sensory function in the fool and limita-tioo of joiot mobility are some earIy signs for the appearance of f 001 ulcers, meaning high risk Df developing inflammatioos ar other complicatians. These changes ean be asscssed using various tech-niques, lhus preventing the appcarance of ulccrs and reducing lhe risk of foot amputation.
The use of thermal tcehniques to evaluate dia-betie foot has largcly remained a research topie (Lavery et aI., 2004, Sun el ai. , 2006, Armslrong et aI.. 2007, Nagase el aI., 2011). The aulhars bclieve that thermal techniques can be signiJicantly useful in diabetic fool assessment, with lhe intent af determining risk of foot ulceration.
Recent advances of physiological imaging tech-niques havc prompted us to use thermograp!ty for screening skin temperature, deep tissue edema ar nuid eollection due to inflammation (Nishide el ai., 2009)_ lnfrared thcrmography is ane af lhe
189
leading tcchnologies in use today. This lechnology is feasible for lemperature monitoring of the foot and can bc ll sed as a complement to eurrent prac-tices for foot examinations in diabetes.
In lhi s study, we used thermal plantar images in patients withoutdiabcles tosupport a mathematical model for fool normal temperaturc distribution.
2 MATERIALS AND METHODS
2.1 Subjecrs
This study inc1udes healthy volunteers, recruited frem Polytechnic lnstitute of Bragança, represent-ing a feet healthy population who were between 21 to 43 years old. This preliminary slucty includes a set of fineen thermographic imagcs.
2.2 Prolocol
The subjects \Vere guided to keep resling supine position \Vithout shoes ar socks for 10 min-utes, before measurernent, to stabilize the fcet temperature.
The imagcs \Vere colIectcd by a thermal cam-era (FLIR 365) pasitioacd aI a fixed distance af
I metre of subject's feet. A plate Df rigid foam was placcd over lhe ankles to isolate the lcmperature af feel fróm lhe resl af lhe body. Th. IOlal dura-tion of data acquisidura-tion process did nol exceed 15 minutes.
2.3 Image p/'ocessil1g
Infrared thermography is a real-lime tempcrature measurement technique used to produce a colourcd visualization of thermal energy emitted by skin.
However, temperature discrimination threshold, on lhe foot, could be a difficult process due to the large temperature variation bctween the feet and the background.
As we can see fram Figure 1, the large tempera-ture variation in the image produces small colour variations of skin temperature.
Through the application af image processing techniques it is possible to obtain images with a bctter contrast of lhe structures in questiono In order to isolatc the feet fram the background, we apply image segmentation, based on regian growing , fallawed by a histogram cxpansian using only the temperature values af the feet, obtaining discriminative images, as showed in Figure 2.
2.4 C/wracterize foot regicms
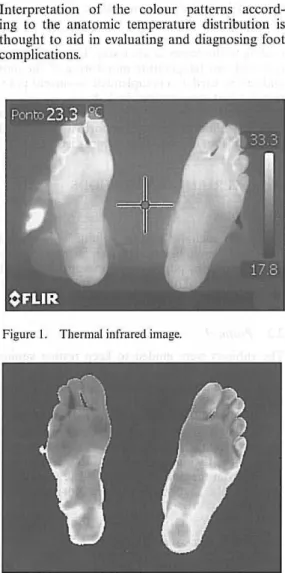
Interpretatian of lhe colaur patterns accord-ing lo the anatomic temperature distribution is thought to aid in evaluating and diagnosing foot complications.
Figure I. Thermal infrared image.
Figure 2. Improving the temperature discrimination.
190
Figure 3. Foot regions.
With lhe nurnerical data, obtained through image processing, we defined ma in areas by meas-uring each fool (length and width) and divided il in three regions. Considering the left foot, Region A is the upper region; Region B is the central region and lhe lower region was defined as Region C.
In a similarway, Regions D, E and F were defined for the right foot, as represented in Figure 3.
3 NUMERICAL RESULTS AND DISCUSSION
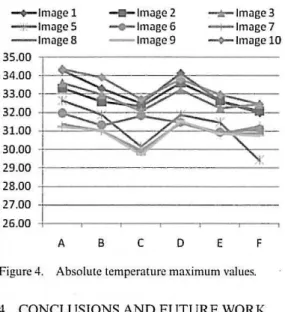
In this study, we used fifteen [eet images. Nine of them follow the same patlern for the maximum tempcrature while lhe other six do not have a defined patlern.
Figure 4 shows the rnaximum temperature value, for each region , frem the set of nine imagcs which followa pattern.
We can observe that the maximum tempcrature value was obtained at Regian A and D (the upper regians af the feet) which agrees with other results presented in the literature.
In this preliminary study, we tested three nonlin-ear mathematical models for the temperature dis-tribution. The parameters i, j represent the pixels positions.
fi
(x,i,j) = xdi + x]/ + x)/ + x4i + x5j + x tj ( 1)I,
(x,i,j) = XI sin (x,i + Xl) + x, sin(x,j + xo) + Xl (2)Il (x,i,j) = XI sin' (x,i + Xl) + X, sin' (x,j + x(, )+ Xl (3)
It was observcd that the bcst rnathcmatical func-tion that approximates the tempcrature distribu-tion was the funcdistribu-tion};. The evaluadistribu-tion was done using the nonlinear least method combincd with ti
~Jmagel
- r - lmageS - - lmageB
35.00 34.00 33.00 32.00 31.00 30.00
1
29.00
I
28.00
I
27.00
I
26.00
,
A B
_ lmage2
-.... Jmage6 - - lmage9
c
D- r - lmage3
~ Jmage7
-o- lmagelO
E F
Figure 4. Absolute tcmpcraturc maximum valucs.
4 CONCLUSIONS AND FUTURE WORK
High tcmpcrature gradients betwcen foot regions may predict the onset of neuropathic uJceration, which makes temperature monitoring a way to reduce the risk of uJceration.
In this study. we observed that the tempera-ture maximum value, in general, is obtained in the upper regions of the fool.
A prcliminary study indicates that the best mathcmatica! model to approximatc the tempera-ture dislribution is a sine sum function. Futempera-ture
191
prospective observation is needed to confirm our mathematica! mo de! or some variation of it.
REFERENCES
Annstrang. D. , Holtz-Neiderer. K .. Wendel. C. ct aL ,
2007. Skin tcmpcraturc monitoring rcduccs the risk for diabctic foot ulceration in high-risk patients, TJu.' Americllll JUII/"/wl
o/
Medicille 120: 1042- 1046. Lavery, L., Higgins, K., Lactot, D. , Constantinitides. G. ,Zamorano, R., Armstrang, D. , et aL , 2004. I'fome monitoring of foot skin temperatures to prevent u1cer-ation, Diabetes Core 27(11): 2641- 2647.
Nagase, T. , Sanada. R. Takehara, K., Oe, M .• Iizaka, S., Ohashi, Y. , Oba, M .• Kadowaki. T. & Nakagami, G. 20 li. Variations of plantar thermographic pattcrns in normal contraIs and non-u1ccr diabetic paticnts: novel c1assification using angiosome concept, }ol/rl/a!
of P!astic, ReCOJ/s/rllc!iI'1! & Al!slhl!Iic SlIrgery 64(7):
860-866.
Nishidc, K., Nagasc, T. , Oba, M., Oe, M. , Ohashi, Y.,
Iizaka , S. , Nakagami, G.. Kadowaki, T. & Sanada. H.
2009. Ultrasonographic and thermographic scrcening for latenl imJlammalion in diabelic fool callus.
Diabe-tf'.~ Research (///(/ ClilliCll! Practicc 85(3 ): 304-309. Sun, P.c., Lin. H.D. , lao, SH., Ku, Y.c., Chan, R.C. &
Cheng, C.K. 2006. Re1ationship Df skin temperature to sympathctic dysfunction in diabctic at-risk fcct.