Carlos Pestana Barros & Nicolas Peypoch
A Comparative Analysis of Productivity Change in Italian and Portuguese Airports
WP 006/2007/DE _________________________________________________________
Tanya Araújo, João Dias, Samuel Eleutério & Francisco Louçã
How fama went wrong: Measures of
multivariate kurtosis for the identification of
the dynamics of N-dimensional market
WP 21/2012/DE/UECE _________________________________________________________
De p a rtm e nt o f Ec o no m ic s
W
ORKINGP
APERSISSN Nº 0874-4548
School of Economics and Management
How Fama Went Wrong: Measures of
Multivariate Kurtosis for the
Identification of the Dynamics of a
N
−
Dimensional Market
Tanya Ara´
ujo
1∗, Jo˜ao Dias
1, Samuel Eleut´erio
2and Francisco Lou¸c˜a
11
ISEG, Technical University of Lisbon and UECE, R. Miguel
Lupi 20, 1249-078 Lisboa, Portugal
2
Instituto Superior T´ecnico, Av. Rovisco Pais 1049-001 Lisboa,
Portugal
Abstract
This paper investigates the common intuition suggesting that dur-ing crises the shape of the financial market clearly differentiates from that of random walk processes. In this sense, it challenges the analysis of the nature of financial markets proposed by Fama and his associates. For this, a geometric approach is proposed in order to define the pat-terns of change of the market and a measure of multivariate kurtosis is used in order to test deviations from multinormality. The emergence of crises can be measured in this framework, using all the available information about the returns of the stocks under consideration and not only the index representing the market.
1
Introduction
The Samuelson theory of asset prices (Samuelson, 1965) was the basis of the Efficient Market Hypothesis (Fama, 1965, 1970, 1991), assuming that
the stock returns are approximated by a random walk and their changes are unpredictable. Nevertheless, many scholars criticized the theoretical as-sumptions of the EMH, namely its informational requisites (e.g. Grossman and Stiglitz, 1980), detected the existence of time dependencies violating the conditions of the theory (e.g. Lo and MacKinley, 1988), and identified the existence of asymmetry and fat tails in the distribution of returns (e.g. Plerou et al, 2001). Consequently, due to these and other discrepancies, the EMH ”is respected but not worshipped” in financial theory and statistics (Pesaran, 2010: 29).
Tools for analysis of deviations from normality existed for long, e.g. the concept of Kurtosis was introduced by Karl Pearson (1905) in order to mea-sure the size of the tails of a distribution as compared with those of the normal. It was assumed, by Pearson and then by ”Student” (1927), who suggested a curious mnemonic based on the shape of animals in order to describe non-normal distributions, that kurtosis, as well as skewness, are common features of nature.
Fat tails are interpreted as the result of a larger part of the variance being provoked by rare extreme events, as compared to the normal distribution. In this sense, Pesaran discusses the effect of the recent punctuation of crashes - such as the dot-com crash of 2000 and the general financial crash after the subprime crisis of 2007 - and argues that periods of bubbles and crashes deviate from market efficiency (Pesaran, 2010). This is precisely the intuition we pursue in this paper, proposing a new approach to the measurement of the dynamics of changes of the distributions representing the stock returns. In the following, we describe the emergence of crises amidst long periods of normal trading and, as we are interested in major changes that occur at the fat tails of the distribution, we use extensions of the concept of kurtosis to the realm of a n−dimensional object.
2
The identification of the dynamics of change
of the market
In the province of statistical research on financial data, the evidence of fat tails is expressed in typical leptokurtic distributions. Recently, Pesaran proposed an empirical verification of four indexes (S&P, FTSE 100, DAX, NIKKEI 225), for 2000-2009, and found evidence of kurtosis, rejecting the null hypothesis of a normal distribution using a Jarque-Bera test (Jarque, Bera, 1987). In the same paper, originated as a contribution to a seminar in honor of Fama, the author mentions the historical data of the monthly re-turns measured by the S&P, as compiled by Shiller (2011): from 1871 to 2009 there is an impressive evidence of kurtosis, and even when shorter periods are chosen, deviations from normality are typical.
As a consequence of this common empirical evidence of non-normality and asymmetric and heavy tailed distributions of financial data, anticipated by no less than Fama himself (Fama, 1965, also Dufour et al, 2003), several adjusted models for skewness and kurtosis have been proposed in financial statistics, namely in the asset pricing applications (e.g., Jarrow and Rudd, 1982, Corrado and Tsu, 1996, Brown and Robinson, 2002, Vahamaa, 2003, Iqbal et al, 2010). In this sense, for instance Dufour, Beaulieu and Khalaf proposed the incorporation of asymmetry of the return distribution on asset evaluation (Dufour et al, 2003, Beaulieu et al, 2005, 2009).
The problem we address in this paper follows these lines of research but, instead of describing the market with the recourse to a single measurement of an index, we propose to capture the whole available empirical information on the dynamics of a population of stocks through time, considering as a consequence the multivariate process. There are sound reasons for this option since, in general, the statistical experiments and empirical approaches ”are multivariate by nature” (Liu et al, 1999: 783).
By using a stochastic geometry technique, we found that the dynamics of the S&P500 set of stocks defines market spaces as low-dimensional entities and that this low-dimensionality is caused by the small proportion of sys-tematic information present in correlations among stocks in normal periods of trade. However, this situation changes dramatically in periods of crashes or crises.
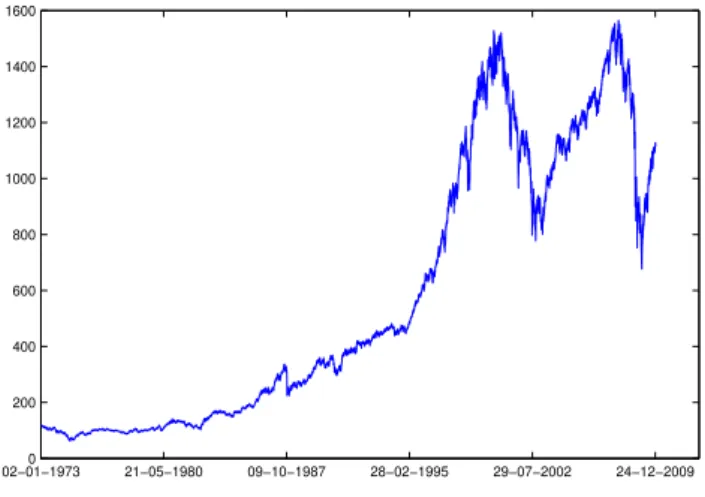
02−01−19730 21−05−1980 09−10−1987 28−02−1995 29−07−2002 24−12−2009 200
400 600 800 1000 1200 1400 1600
Figure 1: The evolution of the S&P500 for 1973-2009.
from 1973 to 2009, and then verified by that of the 471 S&P500 stocks sur-viving from 2005 to 2009 (see Fig 1). These populations are used to study the market dynamics: in both cases, in the subperiods of business-as-usual, the geometric object defined by the dynamics of the market approaches the spherical configuration, typical of a Gaussian distribution; conversely, when a subperiod includes relevant crashes, the shape of that geometric object is distorted, acquiring prominences in some particular directions. Moreover, we found that, during crashes, market spaces contract along their effective dimensions. In this, we also follow a definition by R.A. Fisher (1953), estab-lishing that, measured in an Euclidean space, the multivariate normal errors are described by the surface of a sphere, and suggesting that, whenever large errors occur, the topological deviations have to be considered.
In order to capture the contracting and distortion effects in the mar-ket shape, we measure multivariate kurtosis (b2, p) as presented in the next
section.
3
The measure of the distortion of the space
of the market
historical data of returns over the time interval, and using an appropriate metric (Mantegna, 1999, 2000), we compute the matrix of distances between the stocks. Considering the returns for each stock,
r(k) = log(pt(k))−log(pt−1(k)) (1)
a normalized vector
−
→ρ(k) = −→r(k)−⟨−→r(k)⟩
√
n(⟨r2(k)⟩−⟨r(k)⟩2
) (2)
is defined, where n is the number of components (number of time labels) in the vector −→ρ. With this vector the distance between the stocks k and l is defined by the Euclidean distance of the normalized vectors.
dkl =
√
2 (1−Cij) =∥−→ρ(k)− −→ρ(l)∥ (3)
with Ckl being the correlation coefficient of the returns r(k),r(l).
Ckl =
⟨−→r (k)−→r(l)⟩ − ⟨−→r(k)⟩ ⟨−→r(l)⟩
√(
⟨−→r2(k)⟩ − ⟨−→r(k)⟩2) (⟨−→r2(l)⟩ − ⟨−→r(l)⟩2)
(4)
As the distance is properly defined according to the due metric axioms, it is possible to obtain, from the matrix of distances, the coordinates for the stocks in a Euclidean space of dimension smaller than N. The standard analysis of reduction of the coordinates is applied to the center of mass and the eigenvectors of the inertial tensor are then computed.
The same technique is also applied to surrogate (time-permuted and ran-dom) data, namely to data obtained by independent time permutation for each stock, and these eigenvalues are compared with those obtained from actual data in order to identify the characteristic directions for which the eigenvalues are significantly different. They define a reduced subspace of di-mension f, which carries the systematic information related to the market correlation structure.
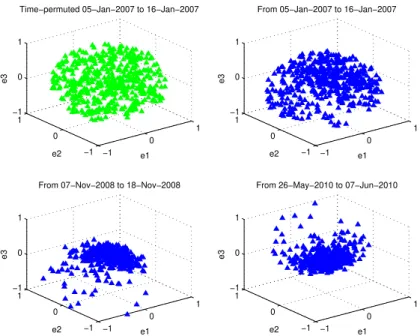
−1 0 1 −1 0 1 −1 0 1 e1 Time−permuted 05−Jan−2007 to 16−Jan−2007
e2 e3 −1 0 1 −1 0 1 −1 0 1 e1 From 05−Jan−2007 to 16−Jan−2007
e2 e3 −1 0 1 −1 0 1 −1 0 1 e1 From 07−Nov−2008 to 18−Nov−2008
e2 e3 −1 0 1 −1 0 1 −1 0 1 e1 From 26−May−2010 to 07−Jun−2010
e2
e3
Figure 2: The market spaces along their main 3 dimensions: each point describes a firm, for surrogate data andbusiness-as-usual periods (the upper plots) correspond to a spherical shape while in periods of crises (the plots in the bottom) proeminences in the market shape are obvious.
small number of coordinates describing their distances is used in the compu-tation of our measures of the multivariate space.
This suggests the definition of a systematic covariance. For this, we denote by −→z(k)(f) the restriction of the k−asset to the subspace V
f. and byd(klf) the distances restricted to this space. Then using Eqs.(3) and (4) we may define a notion of systematic covariance σ(klf)
σkl(f) =µk
√
σkk−r2kµl
√
σll−r2l
(
1− 1
2
(
d(klf))2
)
(5)
where µk=|−→z (k)(f)|/|−→z (k)| , rk =⟨−→r(k)⟩ and σkk=⟨−→r(k)−→r(k)⟩.
As Figure 2 clearly indicates, in periods of normal trade the spherical configuration is maintained, similar to that of surrogate data, whereas in periods of turbulence new shapes emerge.
new shapes emerge in March 2007 as well as in November 2008, two periods of strong turbulence in the financial markets, indicated by a distortion in the shape of the sphere.
4
A Test Based on Multivariate Kurtosis
Given this evidence of contraction and distortion of the market space in dif-ferent periods, we proceed to test deviation from normality. The computation of univariate measures and tests of deviations of general indexes from nor-mality is a common procedure (e.g., Pesaran, 2010). Instead, we propose to consider the available information on the richest detail of a large population of stocks. For this, we recur to heuristic concepts and a test of multivariate kurtosis (b2, p), such as proposed by Mardia (1970). In this case, multivariate
kurtosis is defined as
b2, p(t) = N1Σi[(zi(t)−z)(σ(f))−1(zi(t)−z)]2 (6)
whereσ(f) is the systematic covariance, pis the number of variables and
N the number of observations. In the calculation of σ(f) f = 6 since six
was found (Ara´ujo and Lou¸c˜a, 2007, 2008) to be the number of effective dimensions of the S&P500 market space.
Although the statistical properties of tests of multivariate normality are not as established as those applied to univariate normality (Mardia et al, 1979, Gnanadesikan, 1997), a large body of literature was built in the last decades on the topic. Mardia (1970, 1974, 1983), using Arnold’s results (Arnold, 1964) proposed the affine invariant measures as previously discrim-inated, established their asymptotic distributions and formulated tests for the null of multivariate normality. Different scholars discussed the limit dis-tributions of Mardia’s tests (Schwager, 1985, Baringhaus and Henze, 1992, Kariya and George, 1995, Zhao and Konichi, 1997) and investigated their consistency (Baringhaus and Henze, 1988, Henze, 1994). Others, as Koziol (1982, 1983, 1993, 2005), Srivastava (1984) and Henze (1990), proposed al-ternative approaches to test multivariate normality.
1995, Mecklin and Mundfrom, 2004, 2005, Szekely and Rizzo, 2005, Farrell et al, 2006). Through the comparison of the power of the different tests, using extensive Monte Carlo simulations, some of these authors argued that the Mardia tests have low power (Farrell et al, 2006) in particular against the BHEP test proposed by Henze and his collaborators (Mecklin and Mund-from, 2004, 2005), whereas others obtained an opposite conclusion, favoring the Mardia test (Dufour et al, 2003). Bai and Ng, considering the fact that the sampling distributions of these coefficients is not well known for serially correlated data, proposed a strategy of generalization of the Jarque-Bera test in order to account for these problems (Bai, Ng, 2005, also Doornik and Hansen, 2008).
Considering the stationarity of our series of returns, by construction, we are nevertheless confronted with evidence of serial and cross correlation. It is well known that daily returns tend to be negatively serially correlated, that their statistical significance tends to be greater in periods of unrest and that their cross correlation increases with volatility (Pesaran, 2010). A novel approach to deal with this problem, considering serial correlation in the residuals of overlapping observations, was proposed recently by Pesaran and his colleagues, using a new version of a seemingly unrelated regression equations based estimation (Pesaran et al, 2011). Furthermore, there is evi-dence of cross correlation, which has been rarely discussed in the framework of multivariate analysis, with some exceptions (e.g., Richardson and Smith, 1993).
Considering these suggestions, we checked our data applying the Mardia measure to the stocks in our population, for each period, in order to diagnose deviations from normality and to describe the dynamics of the market in different periods. In each case we proceeded to systematic comparisons with the measures of series of random data obtained from a Gaussian distribution with the same average and variance as in our population.
Mardia’s test of multivariate normality is performed in order to determine if the null hypothesis of multivariate normality is a reasonable assumption regarding the population distribution of a random sample.
Mardia proved that, under the null hypothesis, the statistics
t2 = b2,p(t)−(p2+2p)
√
8p2 +16p N
(7)
business-as-usual from the periods of crises and, in that sense, to test the distortions in the dynamics of the markets, we replace the expected value and standard deviation used in Mardia’s standardization with the empiric counterparts as obtained from the observed values of the statistics in a business-as-usual
period. In this sense, we consider business-as-usual periods 1973-1995 for the longer series and January 2005 to June 2007 for the shorter series. The modified statistics is then
g(t) = b2,p(t)−b2,p(t)
b
σ(b2,p(t)) (8)
whereb2, p(t) andσb(b2, p(t)) are the estimated values of, respectively, the
mean and the standard deviation. In this case, our variables are the six coordinates identifying the relevant dimensions, which represent the relevant information about the market. This is a robust result, unaltered even when other dimensions are considered, confirming our previous result indicating that such dimensions essentially represent noise. Even if the Mardia test -or other tests on multivariate n-ormality - cannot be applied to a very large number of variables, since the asymptotic properties are not known for those cases, this strategy allows both for considering a large population (236 and 471 firms) and to test the described dynamics of the market, considering all the available information and not just a single index averaging through the market.
5
Results and Discussion
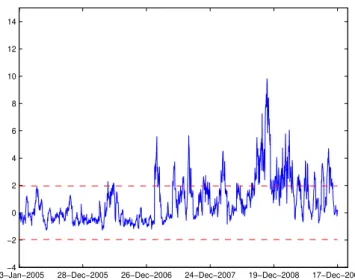
03−Jan−2005−4 28−Dec−2005 26−Dec−2006 24−Dec−2007 19−Dec−2008 17−Dec−2009 −2
0 2 4 6 8 10 12 14
Figure 3: The evolution of g(t) from 2005 to 2009.
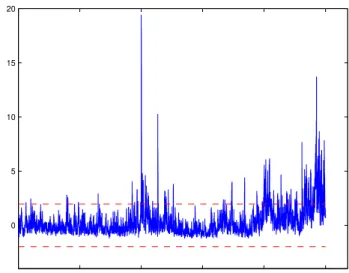
Figure 3 describes the evolution of g(t) for 2005-2009 and Figure 4 the same statistic for the larger period of 1973-2009, and the typical limits of the interval corresponding to a level of significance of 5% are indicated. The hypothesis of normality is clearly rejected in the periods of turbulence, as expected.
In Figure 5 the results of the test for random data with the same standard deviation and expected value as the true data are presented, highlighting by comparison the presence of structure in the market described by our data.
6
Conclusion
re-03−Jan−1973 20−May−1980 05−Oct−1987 21−Feb−1995 19−Jul−2002 16−Dec−2009 0
5 10 15 20
Figure 4: The evolution of g(t) from 1973 to 2009.
search, this avenue favors a new approach to the multidimensional objects constructed by the dynamics of complex markets and interactions among many firms and decisions.
As it was previously found, during periods of financial turbulence the shape of the market changes dramatically, whereas in periods of normal business it resembles the spherical form typical of a random distribution. Our data confirms those results. A moment, kurtosis, is used in order to
0 200 400 600 800 1000 1200 1400
−3 −2 −1 0 1 2 3 4
0 1000 2000 3000 4000 5000 6000 7000 8000 9000 10000
−4 −3 −2 −1 0 1 2 3 4 5
measure the distortions of the distribution, and the results highlight how the distances among stocks contract in periods of unrest. Given this, the hypothesis of well behaved random distribution of the stock returns can be challenged and should be challenged. It does not correspond to the state of nature during a crisis or an episode of turbulence in the financial markets we investigated.
Acknowledgement
This work has benefited from partial financial support from the Funda¸c˜ao para a Ciˆencia e a Tecnologia-FCT, under the 13 Multi-annual Funding Project of UECE, ISEG, Technical University of Lisbon.
7
References
• Ara´ujo T., Lou¸c˜a, F. 2007.The Geometry of Crashes - A Measure of the Dynamics of Stock Market Crises. Quantitative Finance 7(1): 63-74.
• Ara´ujo T., Lou¸c˜a, F. 2008. The Seismography of Crashes in Financial Markets. Physics Letters A 372-4: 429-34.
• Arcones, M. 2007. Two Tests for Multivariate Normality Based on the Characteristic Function. Mathematical Methods of Statistics 16(3): 177-201.
• Arnold, H.J. 1964. Permutation Support for Multivariate Techniques. Biometrika 51: 65-70.
• Averous, J., Meste, M. 1997. Skewness for Multivariate Distributions: Two Approaches. Annals of Statistics 25(5): 1984-97.
• Bai, J., Ng, S. 2005. Tests for Skewness, Kurtosis and Normality for Time Series Data. Journal of Business and Economic Statistics23(1): 49-60.
• Baringhaus, L., Henze, N. 1992. Limit Distributions for Mardia’s Mea-sure of Multivariate Skewness. Annals of Statistics 20(4): 1889-1902.
• Beaulieu, M.-C., Dufour, J.-M., Khalaf, L. 2005. Exact Multivariate Tests of Asset Pricing Models with Stable Asymmetric Distributions. In Numerical Methods in Finance, edited by Breton, M., Ben Ameur, H., pp. 173-91. Dordretch: Kluwer.
• Beaulieu, M.-C., Dufour, J.-M., Khalaf, L. 2009. Finite Sample Multi-variate Tests of Asset Pricing Models with Coskewness. Computational Statistics and Data Analysis 53: 2008-21.
• Brown, C., Robinson, D. 2002. Skewness and Kurtosis Implied by Option Prices: A Correction, Journal of Financial Research 25: 279-82.
• Corrado, C., Tsu, T. 1996. Skewness and Kurtosis in S&P500 Index Returns Implied by Option Prices, Journal of Financial Research 19: 175-92.
• Doornik, J., Hansen, H. 2008. An Omnibus Test for Univariate and Multivariate Normality. Oxford Bulletin of Economics and Statistics
70: 927-39.
• Dufour, J.-M., Khalaf, L., Beaulieu, M.-C. 2003. Exact Skewness-Kurtosis Tests for Multivariate Normality and Goodness-of-fit in Mul-tivariate Regressions with Application to Asset Pricing Models. Oxford Bulletin of Economics and Statistics 65: 891-906.
• Eonomoto, R., Okamoto, N., Seo, T. ND. On the Distribution of Test Statistic Using Srivastava’s Skewness and Kurtosis.
• Fama, E.F. 1965. The Behaviour of Stock Prices. Journal of Business
60: 401-24.
• Fama, E.F. 1970. Efficient Capital Markets: A Review of Theory and Empirical Work, Journal of Finance 25(2): 383-420.
• Fama, E.F. 1991. Efficient Capital Markets: II, Journal of Finance
• Fama, E.F., French, K.R. The CAPM: Theory and Evidence. Working Paper, Center for Research in Security Prices, University of Chicago.
• Farrell, P., Salibian-Barrera, M., Naczk, K. 2006. On Tests for Multi-variate Normality and Associated Simulation Studies. Journal of Sta-tistical Computation and Simulation 0:1-14.
• Fisher, R.A. 1953. Dispersion on a Sphere. Proceedings of the Royal Society 217: 295-305.
• Gnanadesikan, R. 1997. Methods for Statistical Data Analysis of Mul-tivariate Observations. New York: Wiley.
• Gosset, W. 1927. Errors on Routine Analysis. Biometrika 19(1-2): 151-64.
• Grossman, S.J., Stiglitz, J. 1980. On the Impossibility of Information-ally Efficient Markets. American Economic Review 70, 393-408.
• Henze, N. 1994. On Mardia’s Kurtosis Test for Multivariate Normality. Communications in Statistics - Theory and Methods 23: 1031-45.
• Henze, N. 2002. Invariant Tests for Multivariate Normality: A Critical Review. Statistical Papers 43: 467-506.
• Henze, N., Penrose, M.D. 1999. On the Multivariate Runs Test. Annals of Statistics 27(1): 290-8.
• Henze, N., Wagner, T. 1997. A New Approach to the BHEP tests for Multivariate Normality. Journal of Multivariate Analysis 62: 1-23.
• Henze., N., Zirkler, B. 1990. A Class of Invariant and Consistent Tests for Multivariate Normality. Communications in Statistics - Theory and Methods 19: 3595-617.
• Horswell, R., Looney, S. 1992. A Comparison of Tests for Multivariate Normality that are Based on Measures of Multivariate Skewness and Kurtosis. Journal of Statistical Computation and Simulation 42: 21-38.
381-95-• Jarque, C.M., Bera, A.K. 1980. Efficient Tests for Normality, Ho-moskedasticity and Serial Independence of Regression Residuals. Eco-nomic Letters 12: 255-9.
• Jarque, C.M., Bera, A.K. 1987. A Test for Normality of Observations and Regression Residuals. International Statistical Review55: 163-72.
• Jarrow, R., Rudd, A. 1982. Approximate Option Valuation for Arbi-trary Stochastic Processes. Journal of Financial Economics10, 347-69.
• Kariya, T., George, E. 1995. LBI Tests for Multivariate Normality in Curved Families and Mardia’s Test. Sankhya: The Indian Journal of Statistics 57(3), series A: 440-51.
• Klar, B. 2002. A Treatment of Multivariate Skewness, Kurtosis and Related Statistics. Journal of Multivariate Analysis 83(1): 141-65.
• Koziol, J. 1978. Exact Slopes of Certain Multivariate Tests of Hypothe-ses. Annals of Statistics 6(3): 546-58.
• Koziol, J. 1982. A Class of Invariant Procedures for Assessing Multi-variate Normality. Biometrika 69(2): 423-7.
• Koziol, J. 1983. On Assessing Multivariate Normality. Journal of the Royal Statistical Society. Series B, Methodological 45(3): 358-61.
• Koziol, J. 1993. Probability Plots for Assessing Multivariate Normality. Journal of the Royal Statistical Society. Series D, Statistician 42(2): 161-73.
• Liu, R., Parelius, J., Singh, K. 1999. Multivariate Analysis by Data Depth: Descriptive Statistics, Graphics and Inference. Annals of Statis-tics 27(3): 783-840.
• Lo, A., MacKinley. A.C. 1988. Stock Prices do not Follow Random Walks: Evidence from a Simple Specification Test. Review of Financial Studies 1, 41-66.
• Mantegna R.N. 1999. Hierarchical structure in financial markets. Eu-ropean Physics Journal B11: 193-7.
• Mantegna, R.N., Stanley, H.E. 2000. An Introduction to Econophysics: Correlations and Complexity in Finance. Cambridge, Cambridge Uni-versity Press.
• Mardia, K.V. 1970. Measures of multivariate skewness and kurtosis with applications. Biometrika 57: 519-30.
• Mardia, K.V. 1974. Applications of Some Measures of Multivariate Skewness and Kurtosis in Testing Normality and Robustness Studies. Sankhya B36: 115-28.
• Mardia, K.V. 1980. Tests of Univariate and Multivariate Normality. Handbook of Statistics, edited by Krishnaiah, volume 1, 297-221. Am-sterdam: North Holland.
• Mardia, K.V., Kanazawa, M. 1983. The Null Distribution of Multi-variate Kurtosis. Communications in Statistical Simulation and Com-putation 12: 569-76.
• Mardia, K.V., Kent, J., Bibby, J. 1979. Multivariate Analysis. New York: Academic Press.
• Mardia, K.V., Zemroch, P.J. 1975. Algorithm AS 84: Measures of Multivariate Skewness and Kurtosis. Journal of the Royal Statistical Society 24(2), series C: 262-5.
• Mecklin, C., Mundfrom, D. 2004. An Appraisal of Bibliography of Tests for Multivariate Normality. International Statistical Review 72: 123-38.
• Mecklin, C., Mundfrom, D. 2005. A Monte Carlo Comparison of the Type I and Type II Error Rates of Tests of Multivariate Normality. Journal of Statistical Computation and Simulation 75: 93-107.
• Pesaran, M.H. 2010. Predictability of Asset Returns and the Efficient Market Hypothesis. IZA Discussion Papers, Institute for the Study of Labor.
• Pesaran, M.H., Pick, A., Timmermann, A. 2011. Variable Selection, Estimation and Inference for Multi-Period Forecasting Problems. Jour-nal of Econometrics 64(1): 173-87.
• Plerou, V., Gopikrishnan, P., Gabaix, X., Amaral, L.A., Stanley, H.E. 2001. Price Fluctuations, Market Activity and Trading Volume. Quan-titative Finance 1: 262-9.
• Richardson, M., Smith, T. 1993. A Test for Multivariate Normality in Stock Returns. Journal of Business 66: 295-321.
• Samuelson, P. 1965. Proof that Properly Anticipated Prices Fluctuate Randomly. Industrial Management Review Spring 6: 41-9.
• Schwager, S.J. 1985. Multivariate Skewness and Kurtosis. Encyclopae-dia of Statistical Sciences 6: 122-5. New York; Wiley.
• Shiller, R. 2011. http://www.econ.yale.edu/ shiller/data.htm.
• Srivastava, M.S. 1984 A Measure of Skewness and Kurtosis and a Graphical Method for Assessing Multivariate Normality. Statistical and Probability Letters 2: 263-7
• Szekely, G., Rizzo, M. 2005. A New Test for Multivariate Normality. Journal of Multivariate Analysis 93: 58-80.
• Vahamaa, S. 2003. Skewness and Kurtosis Dajusted Black-Scholes Model: A Note on Hedging Performance, Finance Letters 1(5): 6-12.
• Vilela-Mendes, R., Ara´ujo, T. and Lou¸c˜a, F. 2003. Reconstructing an Economic Space from a Market Metric. Physica A 323: 635-50.