Carlos Pestana Barros & Nicolas Peypoch
A Comparative Analysis of Productivity Change in Italian and Portuguese Airports
WP 006/2007/DE _________________________________________________________
João Carlos Graça, Rafael Marques, João Carlos Lopes
Beliefs, values and attitudes of Portuguese populations and
their relationship with human and social capital
WP 26/2010/DE/SOCIUS _________________________________________________________
Department of Economics
W
ORKINGP
APERSISSN Nº 0874-4548
1
Beliefs, values and attitudes of Portuguese population and their relationship
with human and social capital
João Carlos Graça
*1, Rafael Marques*, João Carlos Lopes**
* ISEG, School of Economics and Management – UTL, Technical University of Lisbon, and
SOCIUS, Research Unit on Economic Sociology and Organizations (ISEG/UTL)
** ISEG, School of Economics and Management – UTL, Technical University of Lisbon, and
UECE, Research Unit on Complexity and Economics (ISEG/UTL)
Draft: do not quote without permission
1 Introduction
Studying economic values and beliefs and their relationship with attitudes and behavior has been
common in most social sciences throughout the world, at least since the 1960s. However,
Portugal remained very much outside this research program and, contrary to the majority of
European countries or the United States, it still lacks a coherent an integrative research on
economic values, beliefs and behaviors. On the other hand, the existing data (European and
World Value Surveys, Eurobarometer or the Portuguese Statistics Institute) only offers a partial
view of the individual’s relationship with the economic system, namely consumer confidence or
general ideas of trust. The studies already developed on this subject are normally restricted to the
association of economic values and beliefs with socio-demographic characteristics, failing to
include both the analysis of behaviors and the impact all these variables may have on economic
performance indicators. The current study is intended as a first step towards a deeper
comprehension of these phenomena.
2
The general purpose of this study was to describe and explain the economic values, beliefs and
attitudes of the Portuguese population and how they were associated with behaviors linked to
economic performance. The research was oriented to four main goals:
1 – The description and explanation of the formation of economic values, beliefs, attitudes and
behaviors, based on questionnaire submitted to a national sample, stratified by regional areas.
2 – The identification of the existent linkages between these micro-sociological variables and
regional and national economic performance (e.g. GDP, unemployment rates, inflation,
investment, debt and wages).
3 - The exploration of the role of human and social capital as moderators between
micro-sociological variables and a support for different types of economic values.
In this paper we explore the third goal, offering a tentative typology of economic values’
support.
2 Theoretical framework
The study of economic values and beliefs and their relationship with attitudes and behaviors has
a long tradition in social research. Political studies centered on the concepts of political and civic
3
that tried to establish a set of expected relations between these variables, according to the levels
of political development of each country. The standardization of groups of questions and the
construction of attitudinal scales has also enabled comparative studies and the constitution of
data sets which can be mobilized to pursue the analysis of inter-temporal dynamics.
Human capital and social capital are central to this research. Schooling level, taken as proxy for
human capital, is generally considered as one of an important set of predictors of socioeconomic
attitudes. At the same time, the aggregate effects of the growth of human capital should be
expressed in higher levels of development and be consistent with the emergence of less
materialistic values. Human capital would be both a precondition for social and economic
development in a particular society and a strong indicator of the emergence of a set of values
associated with post-modernism and post materialist attitudes. Higher levels of education and
training and the existence of a skilled and qualified workforce would be positively correlated
with values and attitudes centered more on leisure and quality of life and less on monetary and
economic issues.
Trust can be considered a proxy for the evaluation of social capital, even taking into account its
obvious shortcomings. To start with, trusting others (the interpersonal basis of trust) as a general
attitude is probably a poor predictor of economic activity.
Economic development is probably more correlated with high levels of institutional confidence
4
economic endeavors are more dependent on a strong institutional backing and the existence of
enforcing judicial mechanisms than on the presence of strong ties between economic agents.
Low levels of interpersonal trust can limit the number of relevant associations but do not make
them impossible. However, in terms of values and attitudes, it can be considered that trusting
others, and having a positive image of them, predicts stronger levels of support for some types of
social and economic policies expressed in welfarist policies.
The urban-rural divide and the coastline-interior cleavage are taken as good explanatory devices
of the uneven development of Portugal. Taking this into account, it makes good sense to assess if
there is a differentiation of populations towards development, in terms of attitudes and evaluation
modes, according to their spatial distribution.
In European terms, Portugal is a latecomer both in the transition to post industrialism and in the
transition to a more developed polity. These transitions were made possible by the revolution of
1974 which created a new political system and a new economic order. In this context it is
relevant to study if post materialistic values lag behind the socioeconomic transformations or, on
the contrary, if they run on parallel tracks. Assuming the existence of parallel evolutionary stages
of economic development and economic attitudes, it would be interesting to determine whether
Portugal, as a post industrial society, has already evolved into a post materialist society
according to its dominant values. The mismatch between the economic order and the values that
are allegedly needed to support it can identify a situation of recalcitrant modernization or weak
5
emerging post modern values. If this is indeed true we should expect the co-presence of values
usually taken to be antagonistic and self contradictory espoused by the same groups.
In transition countries, the level of structural and behavioral coherence between values and the
economic order should be lower than the one found in countries where the transitions are already
consolidated. In social theory it is widely assumed that strong levels of consistency should be
found between values and beliefs, and attitudes and behaviors. When it comes to the analysis of
political or economic action, this presumed consistency is usually taken as the basis for
constructing scales and typologies that mirror the left-right ideological divide. In this research we
hypothesized exactly the opposite, expecting the presence of hybrid categories of values and
individuals simultaneously espousing values usually taken to be contradictory, but that fit the
inner logic of citizens facing transitional polities.
3. Empirical results
3.1 Sample construction and description
The sample was constructed, based on previous research (Pereira et al, 2008), obeying to a
double idea of being representative at national level but also at a regional level, reflecting the
wide development differences between Portuguese municipalities in economic, social and
cultural terms. So, the sample was constructed in two stages – first by choosing the
representative municipalities by way of four clustering instruments (rurality, accessibility,
income, and renovation indexes), and then by choosing the individuals in each selected
socio-6
demographic characteristics that mirrored the previously known municipal distribution. The total
sample was divided in four clusters:
Cluster 1 was characterized by its low rurality, high accessibility, high income and medium
renovation;
Cluster 2 was characterized by its medium rurality, medium accessibility, medium income, and
medium renovation;
Cluster 3 was characterized by its high rurality, low accessibility, low income, and low
renovation;
Cluster 4 was characterized by its medium rurality, medium accessibility, low income, and high
renovation;
The global dimension of the sample used in this study was 926 individuals who responded to a
written questionnaire that was presented between April and September 2009.
The gender composition of the sample was 593 women (64%) and 333 men (36%).2 The
minimum age of participants was 16 years old and the maximum 84 years old, with an average
age of 34 (Standard Deviation of 11,9). The age distribution of participants is presented in
Figures 1 and 2.
7
Figure 1. Age distribution in the sample (absolute frequency)
Figure 2. Age distribution in the sample (Box plot)
In these figures we can see that about one half of participants have ages between 25 and 40 years
8
The school level of participants (see Figure 3) includes all the educational grades, from primary
(6,4%) and preparatory (5,2%) teaching3, to post graduated studies (2,7%). Most of the
participants have a complementary graduation, 10th - 12th grades (46%), followed by university
graduation (20,3%) and secondary teaching, 7th - 9th grades (18,6%).
Figure 3. Relative frequency of participant’s schooling
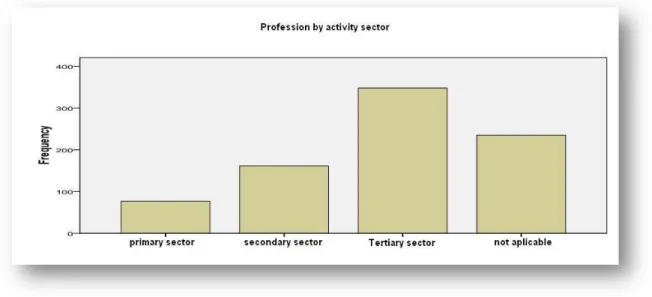
As we can see in Figure 3.4, about one half of participants described themselves as tertiary
workers (42,4%), followed by secondary (19,6%) and primary (6,4%) workers. A significant part
of individuals does not classify itself in any sector of activity (28,6%).
3 In Portugal, “primary” teaching corresponds to the first 4 years of formal schooling and “preparatory” teaching
9
Figure 4. Absolute frequencies of participants by activity sector
Concerning the socioeconomic class (see Figure 5), participants reported to be mainly private
(62,2%) and public sector employees (21,2%). The other individuals divided in self employed
workers (5,5%), agriculture workers (2%) unemployed (2,4%), retirees (1,8%), students (1,6%),
10
Figure 5. Absolute frequencies of participant’s social class
However, a more detailed analysis comparing the sector of activity and the socioeconomic class
of participants shows some discrepancies between these results, probably revealing ignorance
about the precise meaning of these categories. In Table 1, we can see that home workers and
students included themselves in sectors of activity. There are also seven unemployed persons and
five retirees self-classifying in activity sectors, probably, but not for sure, in their corresponding
previous jobs. Six agriculture workers attributed themselves to services and four n.a. (non
applicable). Among the employees, 126 in private sector and 412 in public sector consider not
applicable to them any category. This decision may be wrong and should correspond to the
11 Employee in private sector Employee in public sector Self-employed (excluding agriculture) Farmer or
farmhand Unemployed Retired Student Domestic Other Total
Prim. Sec. 42 10 10 2 1 3 2 2 3 75
Seco. Sec 112 29 4 3 2 1 1 0 1 153
Terc. Sec 218 84 16 6 4 1 0 0 4 333
n.a. 126 41 10 4 13 9 10 2 16 231
Total 498 164 40 15 20 14 13 4 24 792
Table 1. Respondant's socioeconomic class
3.2 The Questionnaire
The questionnaire was built, taking into consideration previous research on the relationship
between psycho-sociological variables and economic behaviour. More specifically, the questions
resulted from the “Economic Values Inventory” (O’Brien and Ingels, 1987); the “Economic
Beliefs Scale” (Leiser and Briskman-Mazliach, 1996); the “Economic Future Scale” (Furnham,
1997); the “Materialism Scale” (Belk, 1984); the “Money Attitude Scale” (Yamauchi and
Templer, 1982) and the “Attitudes to Debt” (Lea et al., 1985). In terms of economic behaviour,
questions were asked concerning savings, investments, consumption and credit use. Human
capital was measured by education levels and social capital was proxied by general trust
questions and associativity and perceptions of associativity.
3.3 Economic values and attitudes
One first point worth mentioning (see Figure 6) are the very high levels of both Egalitarianism
and Anti-tax evasion, which in itself somehow tends to blur the significance of these variables:
since everyone officially agrees in which concerns these questions, the results tend to be
12
state and business, while anti-system values and fatalism are comparatively weak. Even lower
are anti price regulation and anti-unions values.
Figure 6: Support for Economic Values
Another aspect worth mentioning is the fact that a clear majority (around 75%) declares that they
save while only a small minority (roughly 17%) claims to invest. This seems to indicate a strong
13
Do you save?
0% 25% 50% 75% 100%
Yes No
Do you invest?
0% 25% 50% 75% 100%
Yes No
Figure 7: Saving and investing
In order to identify patterns concerning economic values and attitudes, we have proceeded to a
statistical treatment (correlation analysis) of the answers given to the following questions (taken
as proxies to the attitudes mentioned between parenthesis): 1 - Our society owes much to the
contributions of business (Pro Business); 2 - It should be the duty of government to be sure that
everyone has a secure and decent standard of living (Pro Welfare State); 3 - The unemployed
shouldn't blame themselves for their situation; it's the economic system’s fault (Anti Economic
System) ; 4 - Getting ahead is mostly a matter of luck (Fatalism); 5 - It's not the business of the
government to control prices (Anti Price Regulation) ; 6 - Unions are too powerful (Anti Trade
Unions); 7 - We need a way to make incomes more equal in this country (Egalitarianism) ; 8 –
14
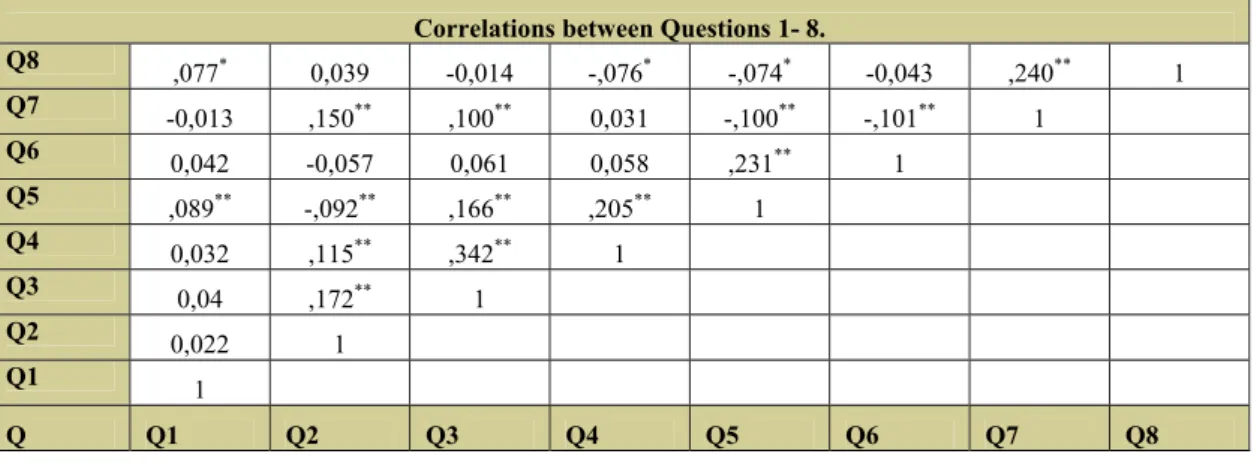
Correlations between Questions 1- 8.
Q8 ,077* 0,039 -0,014 -,076* -,074* -0,043 ,240** 1
Q7 -0,013 ,150**
,100** 0,031 -,100** -,101** 1
Q6
0,042 -0,057 0,061 0,058 ,231** 1
Q5 ,089**
-,092** ,166** ,205** 1
Q4 0,032 ,115**
,342** 1
Q3
0,04 ,172** 1
Q2 0,022 1
Q1
1
Q Q1 Q2 Q3 Q4 Q5 Q6 Q7 Q8
Table 2. Correlations between Questions 1-8
Considering the results shown on Table 2, we can identify groups of affinity, which are based in
pairs of significantly correlated variables. The more striking cases are: a) anti economic system
and fatalism (correlation coefficient of 0,342), which suggests a group we can call Hippies; b)
egalitarianism and anti tax evasion (0,240), which is evidence of a group we call Levellers; c)
anti price regulation and anti trade unions (0,231), pointing to a group of Free marketers; d)
fatalism and anti-price regulation (0,205), suggesting the existence of a group we name True
fatalists; e) 2 pro Welfare State and anti Economic System (0,172), a likely group of Welfarists;
f) 3 anti economic system and anti price regulation (0,166), suggesting a group of Discontents.
Notice that since these groups have been identified on the basis of pairwise correlations, they
may be partly overlapping.
Worth highlighting are the considerably high positive correlations that variable 3 – anti
Economic System has with several others, namely: fatalism; pro Welfare State; anti price
15
Some of the previously mentioned correlations are clearly compatible with conventional
economic wisdom, viz egalitarianism with anti tax evasion or (in an opposite sense) anti price
regulation with anti trade unions, while others indicate ambiguous inclinations, such as anti
economic system with anti price regulation, if not clear incoherence, as in the case of anti
economic system with pro tax evasion. These shifting levels of coherence may partly reflect
different levels of economic literacy, but it is also reasonable to assume they express behavioral
inconsistency of common people.
3.4 The importance of human capital
The influence of human capital (HC) in economic and social behavior is the subject matter of a
long tradition of economic literature (Schultz, 1960; Becker, 1964, Savvides and Stengos, 2009).
In this paper we consider human capital as formal education and quantify the correlations
between HC and the eight variables mentioned above (see Table 3).
Correlation Questions/schooling
Schooling -0,052 -0,048 -0,197 -0,097 -0,134 0,003 -0,026 0,049
Q Q1 Q2 Q3 Q4 Q5 Q8 Q8 Q8
Table 3. Correlations between Questions 1-8 and Schooling
The most relevant aspects to underline have to do with the fact that education correlates
relevantly, if negatively, with anti price regulation, fatalism and anti economic system. If the last
16
The fact that all the other five correlations have values close to zero is also in itself relevant,
although a bit of a disappointment for those assuming a strong importance of human capital.
3.5 The role of social capital/trust
More recently, the role of social capital has been consecrated as distinct field of research,
originating an extended literature (Putnam, 1995; 2000). Here we consider social capital as
measured while trust in others. Three levels of trust are identified: people of the same parish;
people of the same municipality and people of the same country.
More vehemently than in the case of human capital, the main result we have come to indicate
low levels of correlation of all three types of trust with the eight original variables, none of them
statistically significant (see Table 4).
Correlations between Questions and varieties of Trust
Trust 3 ,014 -0,014 0,058 0,01 -0,039
-0,044 0,022 0,037
Trust 2
-0,042 0,018 0,06 0,026 0,021
-0,016 0,052 ,077*
Trust 1 -0,01 0,024 -0,002 0,047 -0,03
-0,021 0,046 0,063
Q8 Q7 Q6 Q5 Q4 Q3 Q2 Q1
Table 4. Correlation between varieties of trust and questions 1-8.
Although we must emphasize the fact that we have taken social capital strictly as trust, the
results somehow infirm what one might expect based on the literature above. This aspect is
reinforced by the fact that all three types of trust have close to zero correlation values with
17
Correlations between varieties of Trusts
Trust 3 1
Trust 2 1 0,593
Trust 1 1 0,737 0,416
Trust 1 Trust 2 Trust 3
Schooling 0,034 -0,043 0,008
Correl Trust/Schooling
Table 5. Correlation between varieties of trust and varieties of trust with schooling.
However, as also shown in Table 5, all three types of trust strongly correlate with each other.
This aspect may be assumed as expectable, notwithstanding the fact that some research lines
have suggested a trade-off between trust concerning close and distant social circles.
4. Concluding remarks
As way of conclusion, we ought to recapitulate by remembering the considerable margins of
incoherence detected in this study, concerning either the relationships between values and beliefs
or the ones regarding attitudes and behaviors. Part of the explanation for that may indeed lie, as
mentioned above, in the merely transitional character of Portuguese society, with only
imperfectly post-materialist (or post-modern) traces. On the other hand, however, we can also
deem how much these incoherencies may be analytically turned upside down, that is to say,
taken as an expression of a “different” modernity, or of its specificities, and therefore appealing
to a broader frame of analysis concerning the processes of change in which nowadays societies
are involved at large, instead of simply be thought of as expressions of “transition”, i. e.,
weaknesses and incompleteness. Concerning this subject, it is surely worth mentioning the points
18
processes of industrialization and economic development occurred after the British one. We must
indeed, in many cases, enlarge and enrich our global vision of social processes, instead of merely
expecting for the strict repetition of patterns, and despair or blame “backwardness” or
“transition” when they simply do not emerge…
Within this context, an important element to consider is also the fact that the main categories we
came up with in section 3.3. are mostly impressive ones, categories that so to speak “popped out”
of the data rather than being previously prepared by us. However, the statistical treatment of
these data remains rather preliminary, since we didn’t advance into cluster analysis. At any rate,
the basic traces identified do really seem quite relevant: surprisingly high levels of egalitarianism
and anti tax evasion sentiments, more modest support for both business and welfare state, quite
low levels of anti-unions and anti price regulation dispositions.
One other aspect worth mentioning concerns the fact that we did not deepen into the
regional-based study of our sample. As it was, we have limited ourselves to take a sample representative
of the totality of Portuguese population according to the variables presented (see above), and
considering the proportions of each identified region, but did not proceed to analyze the
differences between the various regions.
Finally, one word recalling the patently ambiguous correlations identified concerning human
capital and the rather innocuous influences that social capital apparently maintains with most
traces of economic conduct. In spite of partly disappointing, these officially “blurred” results
19
relevant focuses, and proceed to the necessary recombination of ideas and judgments. Those will
most certainly be goals of ours in research ahead.
Acknowledgments. We thank the research assistance of Cláudia Niza and Diogo Machado, as
well as the generous cooperation of our colleague Helena Carvalho (CIES, ISCTE). The
financial support of FCT (Pluri-annual funding program of SOCIUS and UECE) is grateful
acknowledged.
References
Almond, G. A., Verba, S. (1965), The Civic Culture. Boston, MA: Little, Brown and Company.
Becker, G. (1964), Human Capital: A Theoretical and Empirical Analysis, with Special
Reference to Education. Chicago, University of Chicago Press.
Belk, R. W. (1984), "Three Scales to Measure Constructs Related to Materialism: Reliability,
Validity, and Relationships to Measures Of Happiness", in Advances in Consumer
Research Volume 11, eds. Thomas C. Kinnear, Provo, UT: Association for Consumer
Research, Pages: 291-297.
Coleman, J.S. (1988), “Social capital in the creation of human capital”. American Journal of
Sociology 94, pp. 95–120.
Fukuyama, F., (1995), Trust: The social virtues and the creation of prosperity, Penguin, London.
Gerschenkron, A. (1962), Economic backwardness in historical perspective, a book of essays,
20
Inglehart, R. (1997), Modernization and Postmodernization. Princeton, Princeton University
Press.
Lea, S. E. G., Webley, P. and Walker, C. M. (1995), “Psychological factors in consumer debt:
Money management, economic socialization, and credit use”, Journal of Economic
Psychology, Volume 16, Issue 4, December 1995, Pages 681-701
Leiser, D. and Briskman-Mazliach, R., (1996). “The economic model questionnaire”,
Ben-Gurion University, Beer Sheva.
O'Brien, M. U. and Ingels, S. J. (1987), “The economic values inventory”, Journal of Economic
Education, 18, 7-17.
Pereira, E., Pereirinha, J., Passos, J. (2008) Desenvolvimento de índices de caracterização do
território para o estudo da pobreza rural em Portugal Continental, Revista Portuguesa de
Estudos Regionais, 21: 1-30.
Putnam, R. (1995), Bowling Alone: America's Declining Social Capital". Journal of Democracy
6 (1): 65–78.
Putnam, R. (2000), Bowling Alone: The Collapse and Revival of American Community. New
York: Simon & Schuster.
Savvides, A. and Stengos, T. (2009), Human Capital and Economic Growth, Stanford University
Press.
Schultz, T. (1960), “Capital Formation by Education”, Journal of Political Economy, 68.
Yamauchi, K. T., and Templer, D. I. (1982). “The development of a money attitude scale”.