UNIVERSIDADE DO ALGARVE
Drug Repurposing in the Treatment of Melanoma Brain
Metastasis
Billy Samuel Hill
Dissertação de Mestrado
Mestrado em Biologia Molecular e Microbiana
Trabalho efectuado sob a orientação de:
Professor Doutor Frits Thorsen
Professora Doutora Maria Leonor Cancela
2015
Declaração de Autoria de Trabalho
“Drug Repurposing in the Treatment of Melanoma Brain Metastasis”
Declaro ser o autor deste trabalho, que é original e inédito. Autores e trabalhos e
consultados estão devidamente citados no texto e constam da listagem de
referências incluída.
Assinatura: _____________________________
Universidade do Algarve, 30 de Setembro 2015© Billy Hill
A Universidade do Algarve tem o direito, perpétuo e sem limites geográficos, de
arquivar e publicitar este trabalho através de exemplares impressos reproduzidos
em papel ou de forma digital, ou por qualquer outro meio conhecido ou que
venha a ser inventada, de o divulgar através de repositórios científicos e de
admitir a sua cópia e distribuição com objectivos educacionais ou de
investigação, não comerciais desde que seja dado crédito ao autor e editor.
III
Acknowledgements
First and foremost I would like to sincerely thank Professor Frits Thorsen, for accepting me, a student that he had never met and for allowing me to work on this really amazing project. There were good moments and not so good moments, but Professor Thorsen you helped me along every step of the way. To add to this a huge thank you for introducing me to this field of research. My most heart felt thanks.
I am also most grateful to Stian Krog, for all of his help in establishing the agreements and taking care of all the necessary paperwork, and having time to answer all my silly
questions and doubts, Cheers Stian.
I would also like to thank all the staff and members at the MIC facility, Jebsen center and all the 6th floor lab personnel, for all the help and patience.
To all the researchers and students who used the same lab, big thanks for helping when I had problems or questions, for putting up with my loud music, and for all being great people to work with. I would like to give a special shout out to Nazanin Mola, the person I got to know the most, my right hand women, for all of what you did and helped me with, will never be forgotten, cheers sweetie.
I could not forget of course Birgitte de Martens, who was my little confidant, and was there in all the good and bad times J
I have to also thank my course committee, emphasizing Professor Filomena Fonseca, and my Co-coordinator Professor Leonor Cancela, for all the availability and help that they have provided throughout all this experience.
I am very grateful for all the support my best friend Renata Moreira gave me, a person who has always been there and always will be.
Also to all the people who kept in touch during the period of my absence, who kept me updated about all that’s been going on, and for great conversations and support. Especially Margarida Castro.
And finally last but not least to my parents without whom this all would not have been possible, who have supported me no matter what, thank you for everything, lots of love.
V
Resumo
O melanoma maligno é considerado a forma mais letal de cancro de pele, com uma elevada tendência para metastizar para o cérebro. Atualmente, as metástases cerebrais são tratadas através de cirurgia, quimioterapia, radioterapia e radiocirurgia, mas o sucesso destes tratamentos são mínimos, como tal novas estratégias terapêuticas são importantes e necessárias.
A fim de determinar novas estratégias de terapia cancerígena, são precisos modelos animais adequados para investigar os efeitos dos tratamentos. Em trabalhos anteriores, desenvolveu-se um novo modelo animal, através de injecção, na corrente sanguínea de organismos imunodeficientes (nod/scid), de células de melanoma humano . Estes animais imunodeficientes, para além de desenvolver tumores cerebrais, também desenvolveram metástases em outros órgãos. A partir dos tumores desenvolvidos, foi determinada, por sequenciamento de RNA, uma lista de genes candidatos responsáveis pelas metástases cerebrais,. Com uma análise bioinformática, utilizando o connectivity map (cMAP), foi possível encontrar várias drogas, administradas em pacientes para outros fins terapêuticos, que podem ser também eficazes no tratamento de metástases cerebrais.
O objetivo deste trabalho foi testar os fármacos candidatos, determinados pelas sequencias de RNA, em quatro linhas celulares diferentes de melanoma humano. Dos ensaios in vitro realizados com 9 drogas candidatas, apenas 5 mostraram ter algum potencial, mas só 3 foram selecionadas (Tricostatina A, Metildopa e Pentamidina) para serem testadas in vivo. Esta seleção baseou-se na análise do peso molecular, devido às limitações da passagem pela barreira hematoencefálica.
Nos resultados in vivo, observou-se um efeito positivo, ainda que transitório, sobre a carga tumoral e o volume do tumor após quatro semanas de tratamento, quando eram expostos com metildopa. Assim, estudos adicionais têm de ser realizados utilizando a metildopa, para se confirmar e validar os resultados obtidos, e perceber se é suficientemente eficaz para ser utilizada de forma preventiva.
Com este trabalho também foi possível otimizar-se protocolos de ressonância magnética para facilitar a observação dos tumores, especialmente os de menores dimensões. Para além disso, a ressonância magnética também permite verificar se os tumores estão a invadir tecidos circundantes. Este protocolo tornou-se uma boa ferramenta que pode ser usado em futuros
estudos, permitindo estudar de forma mais eficaz as alterações dos tumores, e contribuir assim para o desenvolvimento de melhores tratamentos.
VII
Abstract
Malignant melanoma is the most lethal form of skin cancer, with a high propensity to metastasize to the brain. Melanoma brain metastases are currently treated with surgery, chemotherapy, radiotherapy and radiosurgery. Positive treatment results are, however minimal, and new therapeutic strategies are therefore needed.
In order to determine new treatment strategies, suitable animal models to study effects of treatment are crucial. In previous work done in the group, a novel animal model was developed, by injecting human melanoma brain metastasis cell lines into the blood stream of immunodeficient (nod/scid) mice, with subsequent metastasis to the animal organs. From these tumors, a candidate gene list responsible for melanoma brain metastasis was determined by RNA sequencing. Subsequent bioinformatics analysis using Connectivity Map was used to find several drugs already used on patients for other purposes than cancer, which may also be effective in the treatment of melanoma brain metastasis.
The aim of this work was to test the identified potential new drug candidates, on melanoma metastatic cell lines. In the first part of the work, in vitro assays were performed to investigate the potential effects of nine of the drug candidates on four different human melanoma metastatic cell lines. From these 9 candidates 5 showed potential and three were selected for
in vivo studies (Trichostatin A, Methyldopa and Pentamidine). Only these were selected due
to molecular weight and limitations of the blood brain barrier.
In vivo results showed a transient positive effect on tumor burden and volume around week 4
when treated with Methyldopa. Further studies need to be performed utilizing this drug to verify its capacity when applied as a preventive form of treatment. With this work MRI protocols have been optimized allowing easier detection of the tumors, in particular the smaller ones. In addition it is also possible to verify whether the tumors are leaky or not. This can then be used in future animal studies, to see whether leakiness changes as a function of treatment.
IX
Index
Abbreviations ... X List of Figures ... XIII
1) Introduction: ... 1
1.1) Principles of Cancer ... 1
1.2) The Cell Cycle ... 7
1.3) Melanoma ... 8
1.4) Brain Metastasis ... 9
1.5) Current Treatments ... 9
1.6) Blood Brain Barrier and Drug Delivery ... 10
2) Material and methods ... 12
2.1) Establishing Animal Models ... 12
2.2) cMAP and drug selection ... 12
2.3 Drugs ... 13
2.4) Cell Culturing Techniques ... 14
2.4.1) Cell culturing ... 14
2.4.2) Cell counting ... 15
2.4.3) Freezing Cells ... 16
2.5) Cell Lines ... 16
2.6) Monolayer viability assay ... 18
2.7) DNA Cell Cycle Analysis ... 19
2.8) Apoptosis Assay ... 21
2.9) Soft Agar proliferation assay ... 21
2.10) Principles of Animal Handling ... 23
2.11) MRI ... 25
3) Results ... 29
3.1) cMAP and Drug Selection ... 29
3.2) In Vitro Studies ... 31
3.2.1) Monolayer Viability Assay ... 31
3.2.2) Soft Agar proliferation ... 34
3.2.3) Summary of all IC50 Results ... 36
3.2.4 DNA Cell Cycle Analysis ... 37
3.2.5) Apoptosis assay ... 40
3.3) In Vivo Studies ... 45
3.3.1) Experimental Layout ... 45
3.3.2) In vivo Trichostatin A (TSA) treatment ... 45
3.3.3) In vivo Pentamidine and Methyldopa treatment ... 46
3.3.4) In vivo TSA ... 47
3.3.5) In vivo Pentamidine/Methyldopa ... 50
3.3.6) MRI Protocol Optimization ... 54
4) Discussion/Conclusion ... 55
5) Future aspects ... 58
Abbreviations
Abbreviation Full name
ATP
Akt
BBB
BLI
CAS
CNS
cMAP
CD36
CTC
Da
DNA
DMSO
ECM
EMT
ERK
EtOH
FACS
FDA
FGF
FCS
FS
GFP
GLUT1
IC
50IGF-1R
Adenosine Triphosphate
Protein kinase B
Blood Brain Barrier
Bioluminescent Imagining
Chemical Abstracts Service
Central Nervous System
Connectivity Map
Thrombospondin receptor
Circulating Tumor Cells
Dalton
Deoxyribonucleic acid
Dimethyl Sulfoxide
Extracellular Matrix
Epithelial – Mesenchymal Transition
Extracellular signal-regulated kinases
Ethanol
Fluorescence-activated cell sorting
Food and Drug Administration
Fibroblast Growth Factor
Fetal Calf Serum
Forward Scatter
Green Fluorescent Protein
Glucose Transporter 1
The half maximal inhibitory concentration
Insulin-like growth factor 1 receptor
XI
IL-3
MET
Melanoma
MRI
MMP
MT-MMP
MW
NSD
nod/scid
NS
PBS
PEN-STREP
PI
PMT
pRB
RT
RF
RPM
REC
RCF
SD
SLC
SRS
SS
T
1T
2T
Interleukin 3
Mesenchymal – Epithelial Transition
Malignant Melanoma of the Skin
Magnetic Resonance Imaging
Matrix Metalloproteinases
Membrane Tethered matrix Metalloproteinases
Molecular Weight
Norwegian Directorate of Health
Nonobese-diabetic/severe combined immunodeficient mouse
Not Significant
Dulbeccos phosphate-buffered saline
Penicillin/Streptomycin
Propidium Iodide
Photomultiplier Tube
Retinoblastoma Protein
Room Temperature
Radio Frequency
Rotations per Minute
The Regional Ethical Committee
Relative Centrifugal Force
Standard Deviation
Solute Carrier Family
Stereotactic Radiosurgery
Side Scatter
Relaxation Time of Longitudinal Magnetisation
Relaxation Time of Transverse Magnetisation
Tesla
TSA
UV
UoB
VEGF
WBRT
Trichostatin A
Ultraviolet
University of Bergen
Vascular Endothelial Growth Factor
Whole-Brain Radiotherapy
XIII
List of Figures
Figure 1.1
Figure 1.2
Figure 1.3
Table 2.1
Table 2.2
Figure 2.1
Figure 2.2
Figure 2.3
Figure 2.4
Figure 2.5
Figure 3.1
Figure 3.2
Figure 3.3
Figure 3.4
Table 3.1
Figure 3.5
Illustration of the hallmarks of cancer;
EMT in local invasion and intravasation;
The cell cycle;
Table containing list of compounds;
Components comprising cell culture medium and freezing
solution;
Figure showing morphological aspect of cell lines used in this
work;
Schematic representation of flow cytometry data analysis;
Image of a nod/scid mouse used in In vivo experiments;
Absorption of RF energy;
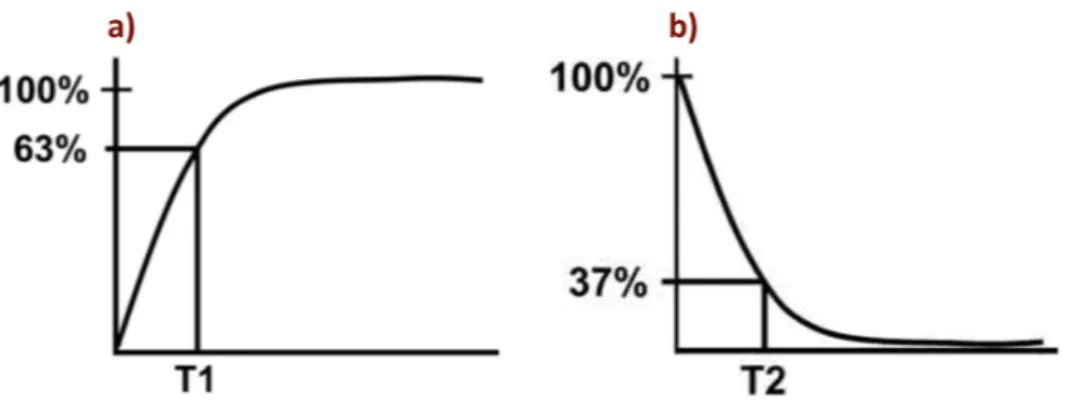
Representation of T1 and T2 curves;
Tissue sample generation, expression profiling, and Connectivity
Map analysis;
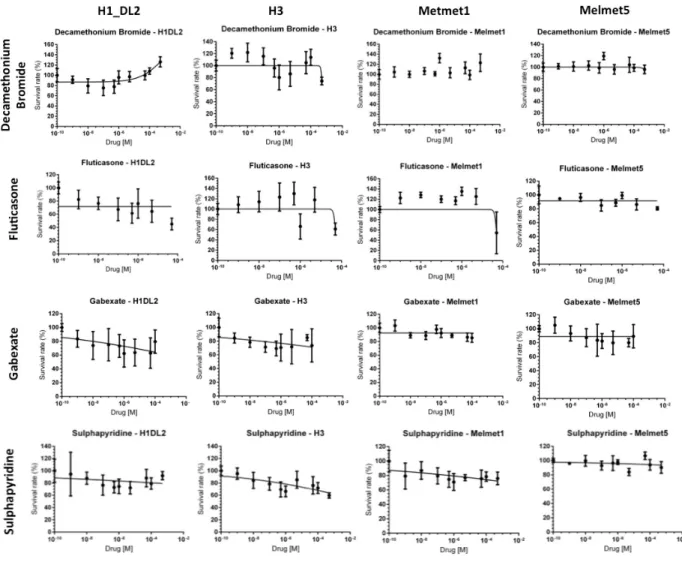
Monolayer proliferation assay for Decamethonium Bromide,
Fluticasone, Gabexate and Sulphapyridine in all cell lines;
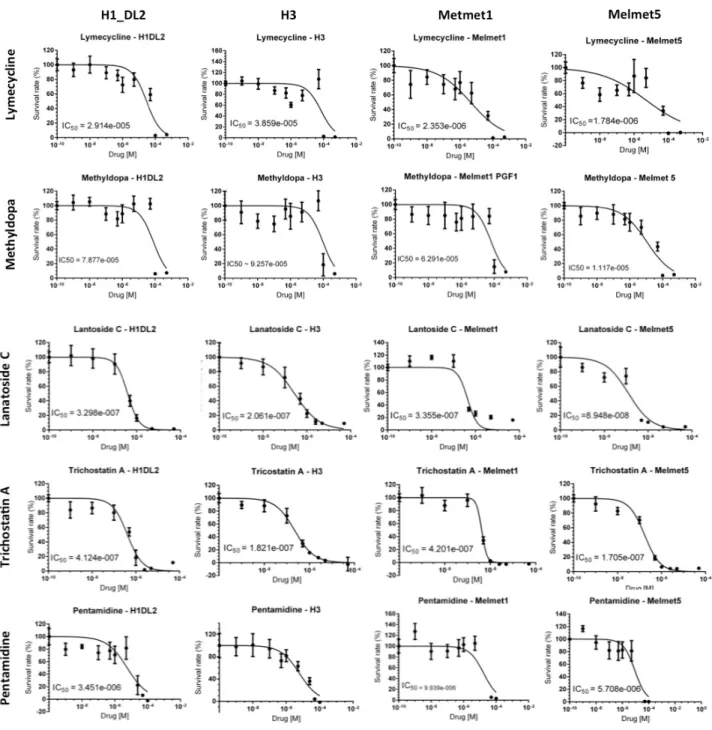
Monolayer Viability assay for Lymecycline, Methyldopa,
Lanatoside C, Trichostatin A and Pentamidine in all cell lines.
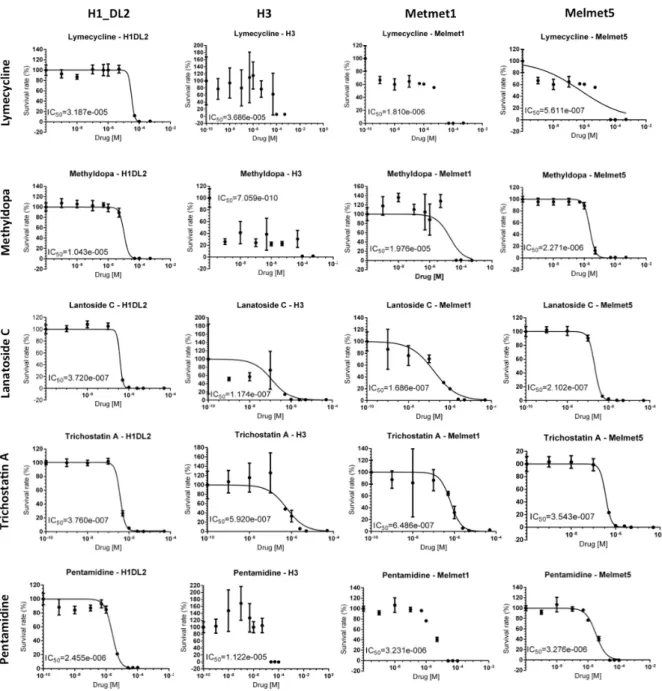
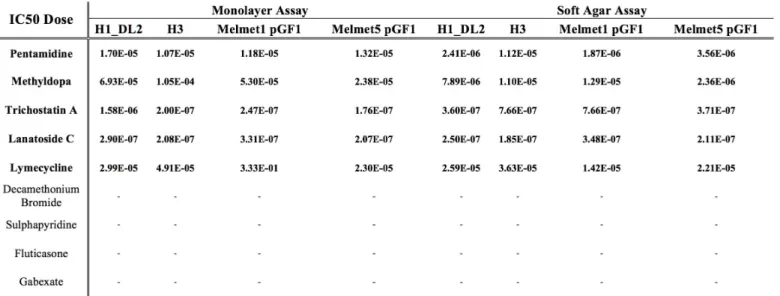
Soft agar proliferation assay for Lymecycline, Methyldopa,
Lanatoside C, Trichostatin A and Pentamidine.
Table containing IC
50values for all In vitro studies.
Cell cycle analysis of H1_DL2, H3, Melmet1 pGF1, and
Melmet5 pGF1 by flow cytometry.
Table 3.2
Figure 3.6
Figure 3.7
Figure 3.8
Figure 3.9
Table 3.3
Figure 3.10
Figure 3.11
Figure 3.12
Figure 3.13
Figure 3.14
Figure 3.15
Figure 3.16
Figure 3.17
Statistical information relative to cell cycle analysis, mean values
± SD of the whole experiment.
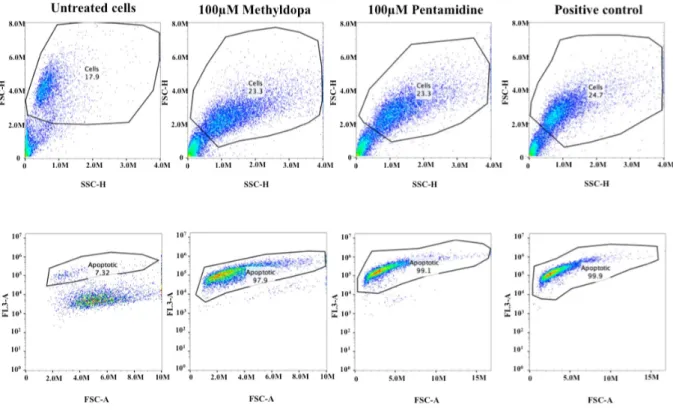
Apoptosis assay on H1_DL2 human melanoma metastasis cell
line;
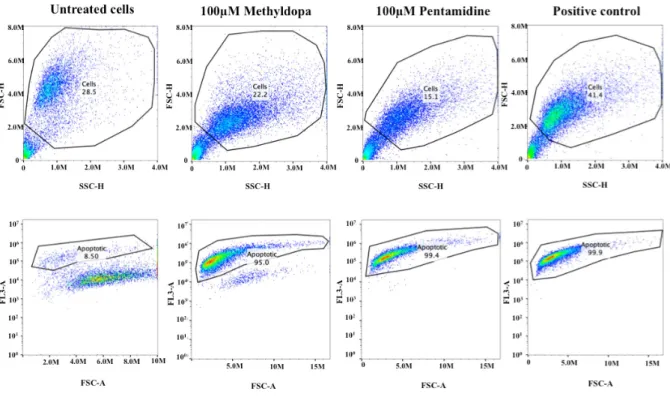
Apoptosis assay on H3 human melanoma metastasis cell line;
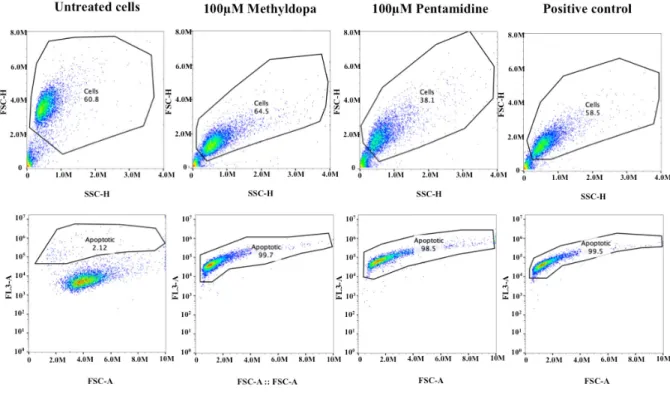
Apoptosis assay on Melmet1_pGF1 human melanoma metastasis
cell line;
Apoptosis assay on Melmet5_pGF1 human melanoma metastasis
cell line;
Percentage of apoptotic cells for untreated cells, and cells treated
with 100mM Pentamidine or 100mM Methyldopa:
Illustration of intercardiac injection and interperitoneal treatment
Representative MRI Scans of mice brains during TSA In vivo
treatment over the period of the experiment;
Graph representing tumor burden and volume during treatment at
week 8;
Graphic illustrating animal survival thought the course of the
experiment;
Graphic illustrating animal weights thought the course of the
experiment;
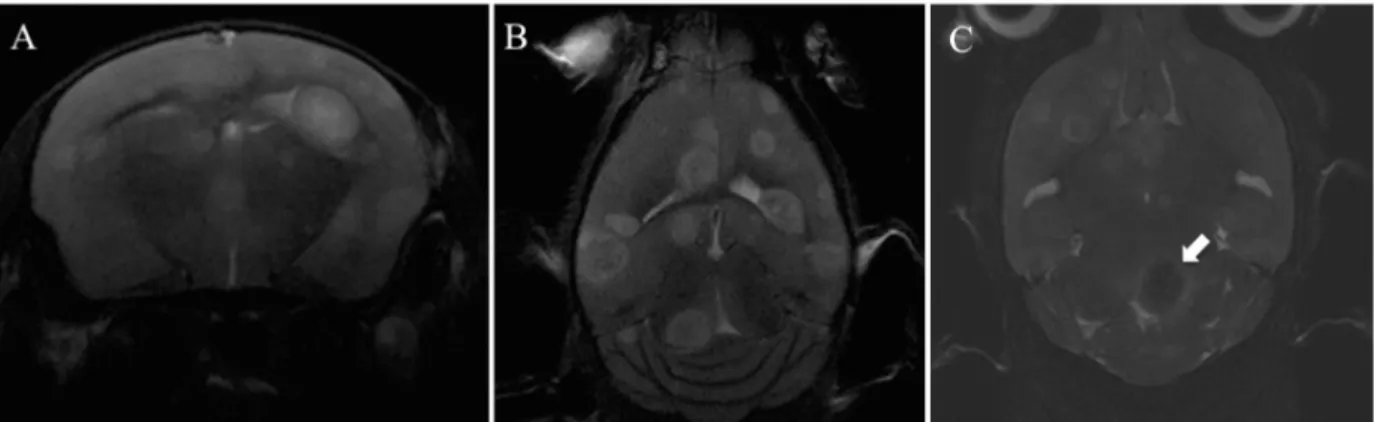
Representative
MRI
Scans
of
mice
brains
during
Methyldopa/Pentamidine In vivo treatment over the period of the
experiment;
Graph representing tumor burden and volume during treatment at
week 4;
Graph representing tumor burden and volume during treatment at
week 6;
XV
Figure 3.18
Figure 3.19
Figure 3.20
Graphic illustrating animal survival through the course of the
experiment;
Graphic illustrating animal weights throughout the course of the
experiment;
Representative MRI Scans showing progress of MRI protocol
optimization
.1) Introduction:
1.1) Principles of CancerIn 2012, the worldwide burden of cancer rose to an estimated 14 million new cases per year, a figure expected to rise to 22 million annually within the next two decades. Over the same period, cancer deaths are predicted to rise from an estimated 8.2 million annually to 13 million per year. Globally, in 2012 the most common cancers diagnosed were those of the lung (1.8 million cases, 13.0% of the total), breast (1.7 million, 11.9%), and large bowel (1.4 million, 9.7%). The most common causes of cancer death were cancers of the lung (1.6 million, 19.4% of the total), liver (0.8 million, 9.1%), and stomach (0.7 million, 8.8%) (1).
Cancer cells are unlike most cells in the human body, which only divide when exposed to extracellular signals such as growth factors. Instead, cancer cells divide more or less continuously, ultimately forming tumors. By the time the tumor can be felt or found using current technologies, it already contains millions of cells. Tumors can be benign or malignant. The most fearsome characteristic of cancer cells is their ability to invade surrounding tissues and spreading to other parts of the body using the circulatory and lymphatic system. When malignant cells become lodged in a distant part of the body, they divide and grow forming a new tumor at that new site. This process is called metastasis, (explained in more detail ahead); this often results in organ failures and makes cancer treatment very complicated (2).
Cancer has specific traits that are important to comprehend, as to fully understand the capacities of this disease and therefore be able to give a more generalized form of treatment. These traits are known as the “hallmarks of cancer” and are described below:
2
Figure. 1.1 – illustration of the hallmarks of cancer, adapted from (3).
• Sustaining proliferative signaling
Normal cells require external growth signals to proliferate, and these signals are transmitted through receptors that pass through the cell membrane. In contrast, cancer cells can grow and divide without external growth signals. Some cancer cells are autosufficent, generating their own growth factor molecules. Receptors themselves can be overexpressed. Or mutated ones can send signals without any growth factors at all (3).
• Evading growth suppressors
Cancer cells are generally resistant to growth-preventing signals from the neighbouring normal cells. The growth of normal cells is kept under control by growth inhibitors in the surrounding environment, in the extracellular matrix and on the surfaces of neighboring cells. These inhibitors act on the cell cycle clock, by interrupting cell division (mitosis) in the interphase.
Ultimately, the growth inhibitor signals are funneled through the downstream retinoblastoma protein (pRB), which prevents the inappropriate transition from (G1) to S. If pRB is damaged through a mutation in its gene, or by interference from human papilloma virus, the cell can divide uncontrollably (3).
• Avoiding immune destruction
By disrupting the processes of the cancer immunity cycle throughout the body, tumors can avoid detection by the immune system and limit the extent of immune destruction. Some processes by which tumor cells avoid immune destruction is by disrupting antigen detection, inhibiting T-cell activation by dendritic cells, blocking T-cell infiltration into tumor and suppressing cytotoxic T-cell activity (3, 4, 5).
• Enabling replicative immortality
Non-cancer cells die after a certain number of divisions or go into quiescence. Some types of cells, such as nerve and heart muscle cells, become quiescent when they reach maturity but continue to perform their main functions for the rest of the organism's life. Multinucleated muscle cells that do not undergo cytokinesis are also often considered to be in the G0 stage. Cancer cells escape this limit and are apparently capable of indefinite growth and division, becoming immortal. But those immortal cells have damaged chromosomes, and can become cancerous.
Mammalian cells have an intrinsic program, the Hayflick limit, that limits their multiplication to about 60–70 doublings, at which point they reach a stage of senescence. This limit can be overcome by disabling their pRB and p53 tumor suppressor proteins, which allows them to continue.
The counting device for cell doublings is the telomere, which loses DNA at the tips of every chromosome during each cell cycle. Many cancers involve the upregulation of telomerase, the enzyme that maintains telomeres length (3).
4 • Activating invasion & metastasis
Initiation of metastasis requires invasion, which is enabled by EMT (Epithelial – Mesenchymal Transition) (Figure. 1.2). Carcinoma cells in primary tumors lose cell-cell adhesion mediated by E-cadherin repression and break through the basement membrane with increased invasive properties, and enter the bloodstream through intravasation. Later, when these circulating tumor cells (CTCs) exit the bloodstream to form micrometastases, they undergo MET (Mesenchymal – Epithelial Transition) for clonal outgrowth at these metastatic sites. Thus, EMT and MET form the initiation and completion of the invasion-metastasis cascade.
A partial loss of E-cadherin, the caretaker of the epithelial state, is associated with carcinoma progression (6). During EMT, E-cadherin gene transcriptional repression, promoter methylation, and protein phosphorylation and degradation have all been observed (7, 8). In order to invade through local basement membrane (surrounding the tumor or the tumors vasculature), these mesenchymal tumor cells up-regulate several secreted (MMPs) and membrane-tethered (MT-MMPs) proteases to break down ECM components (3).
Figure. 1.2 - EMT in local invasion and intravasation. Activation of the EMT program is mostly characterized by loss of E-cadherin expression. In order to invade through local basement membrane, these mesenchymal tumor cells up-regulate several secreted (MMPs) and membrane-tethered (MT-MMPs) proteases to break down ECM components. Adapted from (9)
• Tumor promoting inflammation
The tumor microenvironment is often infiltrated by innate and adaptive immune system cells, which enable tumors to mimic inflammatory conditions seen in normal tissues. This will promote tumor progression by supplying the tumor microenvironment with growth factors, survival factors, pro-angiogenic factors, extracellular matrix (ECM) – modifying enzymes that promote angiogenesis, invasion, and metastasis and also inductive signals that activate epithelial-mesenchymal transition (EMT) (3).
• Inducing angiogenesis
Angiogenesis is the process by which new blood vessels are formed. Cancer cells appear to be able to kickstart this process, ensuring that such cells receive a continual supply of oxygen and other nutrients.
Cancer cells initially lack angiogenic ability, limiting their ability to expand. In order to progress, they must develop a blood supply. Inducers and inhibitors balance angiogenesis. Inducers include vascular endothelial growth factor (VEGF) and acidic and basic fibroblast growth factor (FGF 1/2), which bind to transmembrane tyrosine kinase receptors displayed on endothelial cells. An inhibitor is thrombospondin-1, which binds to CD36. Thrombospondin-1 is regulated by p53, so loss of p53 can promote angiogenesis.
Angiogenesis is involved in the growth of all tumors, but most pronounced in cervix, breast and melanoma tumors (3).
• Genome instability & mutation
Multiple alterations in the genomes of cancer cells serve as the foundation for many oncogenic processes. Cancer cells take advantage of increased rates of mutations in order to accumulate several mutations needed to foster carcinogenesis. They do this through increased sensitivity to mutagenic agents and/or a breakdown in one or more of the cell’s DNA repair mechanisms mediated by genes such as p53 or breast cancer type 1 susceptibility protein (BRCA1). Also when caretaker genes are inactivated or suppressed, tumor cells can increase the rate of mutations and, subsequently, tumorigenesis (3, 10).
6 • Resisting cell death
Apoptosis is a form of programmed cell death (cell suicide), the mechanism by which cells are programmed to die in the event they become damaged.
Apoptosis can be triggered by an overexpressed oncogene, and this may be the primary means by which such mutant cells are continually removed. Conversely, cancer cells must overcome apoptosis to progress.
The apoptotic machinery can be divided into sensors, which monitor the cell for abnormal behavior, and effectors, which cause apoptosis. The sensors include survival signals and their receptors, which monitor the cell for DNA damage, oncogene overexpression, and low oxygen (hypoxia). They monitor survival signals from the cell matrix and neighboring cells.
Sensors include IGF-1/IGF2 and their receptor IGF-1R; and IL-3 and its receptor. The effectors include FAS ligand and its receptor, and TNF-α and its receptor. The p53 tumor suppressor protein elicits apoptosis in response to DNA damage, and is a major mechanism of cancer control. In order for cancer to progress, it must overcome p53, and in fact, p53 is mutated in half of all cancers (3).
• Deregulation of cellular energetics
To sustain uncontrolled proliferation, cancer cells make adjustments to their energy production by reprogramming their glucose metabolism, upregulating glucose transporters such as glucose transporter 1 (GLUT1) and depending on alternate metabolic pathways.
Although limiting energy production to the glycolysis phase decreases the amount of adenosine triphosphate (ATP) produced, it also allows cancer cells to divert glycolic intermediates to various pathways, including those required to assemble new cells (3).
1.2) The Cell Cycle
The cell cycle is controlled by specific checkpoints, which stop the cells from progressing to next phase or completing the current one. These checkpoints ensure completeness of the genome and that the stage of the cell cycle is properly completed before the next phase is begun. The S phase, which concerns DNA replication, is followed by the M phase or mitosis, which involves chromosome segregation, and the cycle is continued by cell division. There are three internal checkpoints that evaluate the eukaryotic cell cycle:
• G1/S: cells check whether they should continue through division or enter a resting stage and whether their genome is able to divide.
• G2/M boundary: cells check whether their DNA is fully replicated and undamaged before progression into the M phase. If not, the cell cycle is arrested in the S-G2 by inactivation of Cdc25 and activation of Wee1.
• Metaphase/anaphase: cells check whether all chromosomes are attached to the bipolar mitotic spindle via their kinetochores and whether the sister chromatids are ready for separating from each other (11).
Figure.1.3 – The cell cycle. The cell grows continuously in interphase, which consists of three phases: DNA replication is confined to S phase; G1 is the gap between M phase and S phase, while G2 is the gap between S phase and M phase. In M phase, the nucleus and then the cytoplasm divide. Some cells become quiescent when they reach maturity and do not undergo cytokinesis are also often considered to be in the G0 stage, image
8
Checkpoints are meant to stop the cell cycle when genome integrity is damaged. Hence cells with genetic mutations are prevented from further division, and transition of the fault into subsequent cell generations is prevented. Cells with damaged DNA become arrested in these checkpoints. Arrest in G1 prevents copying of damaged bases and arrest in G2 allows cells to repair DNA double-strand breaks.
The cell cycle and its checkpoints are working properly and perfectly in a healthy body. However sometimes some random stimuli like genetic mutations or UV light disturb the natural balance and can induce repression of tumor suppressor genes or overexpression of oncogenes, thus leading to tumor development (13).
1.3) Melanoma
Malignant melanoma is the ninth most common cancer in Europe and the 19th most common cancer worldwide, with around 232,000 new cases diagnosed in 2012 (14, 15). The main known risk factor for melanoma is sunlight exposure. Other risk factors that can increase the incidence of melanoma are ultraviolet radiation, skin and hair type as well as eye color, family history (hereditary mutation), previous cancer (metastasis) and radiotherapy, as well as a weakened immune system (16).
Melanomas most often arise within epidermal melanocytes of the skin, although they can also originate from melanocytes such as those lining the choroidal layer of the eye, gastro intestine & genitourinary system mucosal surfaces, or the meninges. Melanoma is also among the most common cancer to metastasize due to its invasive properties. Clinical staging for primary cutaneous melanoma employs measurements of thickness (in millimeters), presence of ulceration, penetration through cutaneous layers, mitotic rate, evidence of “in transit” metastasis, tumor spread to draining lymph nodes, and evidence of distant metastasis. Management issues in melanoma can be classified in terms of prevention, diagnosis, local disease management, and treatment of metastatic disease (17).
1.4) Brain Metastasis
Brain metastasis is the leading neoplastic disease in the human central nervous system (CNS) (18). It usually ascertains itself at the end stage of the disease's advancement and causes a sharp deterioration in patients' life quality (19). The period of latency differs depending on the tumors origin. Formation of brain metastasis is a common outcome for 40% to 60% of melanoma patients (20, 21, 22)
In general, brain metastatic tumors are resistant to chemotherapy and even some newly emerged targeted therapeutic regimens. The blood-brain barrier (BBB) is known as the major obstacle for delivering drugs to the site of tumor cells inside the brain, due to low drug penetration (18). Therapeutic approaches are being selected based on the type of primary cancer, the number and location of the metastatic lesions as well as the stage of cancer. Current standard treatment for patients with brain metastasis is surgical resection followed by radiotherapy, and sometimes chemotherapy. These treatments may decrease the chance of recurrences of brain metastasis, and can increase the patient's quality of life (23). Precise considerations must be applied before choosing a proper treatment. A convenient selection of pharmacological agents can help patients with certain hindering symptoms. However, an unjustified choice of treatment could lead to a reduction in the patient's quality of life. In general, the life expectancy for patients with brain metastasis is poor, around 6 months regardless of treatment (22).
1.5) Current Treatments
Nowadays treatment for brain metastasis relies mainly on surgery, radiotherapy, chemotherapeutic agents or a combination of these. Due to the poor prognosis and lack of uniform approaches to therapy and assessments, patients with brain metastases have also been routinely excluded from clinical trials of new agents and were also thought unlikely to benefit from immunotherapy, in part because of the immunosuppressive effects of glucocorticosteroids. Standard radiotherapy approaches include stereotactic radiosurgery (SRS) or whole-brain radiotherapy (WBRT) (24). SRS, a precise focusing of radiation (Cyberknife and Gamma Knife) on well-defined individual intracranial lesions, is used just on a few well circumscribed metastatic lesions from melanoma brain metastases, barring issues
10
that warrant urgent surgery such as hemorrhage or mass effect and remains the standard of care (25) SRS without WBRT may also be a viable option in patients with one or few metastases and contraindications for surgery. WBRT, in contrast, involves irradiation of the entire brain with a uniform dose. SRS and WBRT are both used as primary or adjuvant therapies in patients with melanoma and brain metastases; notably, however, comparisons of surgical resection followed by WBRT and WBRT alone in these patients have not yielded definitive results (26).
Chemotherapy alone is generally ineffective for the treatment of melanoma CNS metastases. Failure of systemic treatment for brain metastases in the past has been blamed on the inability of most experimental agents to pass the blood–brain barrier in addition to the low activity of these agents against melanoma (18, 27).
Until recently, no compounds have demonstrated a significant survival benefit for patients with melanoma who develop brain metastases, and the prognosis for these patients has remained poor.
1.6) Blood Brain Barrier and Drug Delivery
Circulating tumor cells that reach the brain must pass through the BBB in order to form metastatic colonies in the brains parenchyma. Previous studies have demonstrated that endothelial cells lining the blood vessels in the brain are distinct from the endothelial cells in other organs (28). There are tight junctions between the endothelial cells that cover the internal walls of the vessels, forming a continuous sheath, which inhibits free, transcapillary movement of polar molecules. In addition, astrocytic endfeet and pericytes make up a continuous outer layer, further restricting access to the brain. Additionally, efflux transport proteins localized on the endothelium further diminish the effectiveness of circulating drugs by pumping them back to the blood circulation (29). Besides being a primary barrier for cancer cells, endothelial cells also play an important role in supporting the development of brain metastasis (30).
The unique anatomy of the BBB provides a cellular barrier between the circulating blood and the interstitial fluid (31). It is also important for the homeostatic regulation of the brain and CNS functions (32). Tome Teese, Morris Karnovsky, and Milton Brightman
demonstrated the role of the BBB for the first time in the 1960s. By using electron microscopy, they showed is the presence of a barrier that prevents passage of injected electron-dense agents such as lanthanum salts. The BBB also works as a detoxification layer in the brain by assisting in removal of xenobiotics compounds from the brain.
Any substances that are trying to reach the brain need to pass through the endothelial cell membranes. However, hydrophilic molecules such as glucose and amino acids, which supply the extensive metabolic needs of the brain, may overcome the lipophilic constrain. The fact that glucose easily pass through the BBB can be considered as proof for the presence of more complicated regulatory systems (33). The main pathway for hydrophobic substances to reach the brain is transcellular diffusion with the help of specialized proteins like solute carrier family (SLC), which has been shown to be effective in the flow of organic compounds, especially organic anions, through the BBB (34, 35). Other methods of transportation through BBB are achieved by energy dependent, active transporters, for instance the adenosine triphosphate (ATP)-binding cassette (ABC) family, which is mostly present at the luminal side of the BBB (36).
In general, substances with a molecular weight above 500 Da are usually not able to penetrate the BBB. However, the complexity of the BBB means that charge, lipophilicity, binding to plasma proteins, and size of a molecule all must be taken into account when determining permeability of a drug through the BBB (37). Previous studies have shown that there was no efficient penetration of several hydrophobic molecules within the preferable range of molecular weight (38).
12
2) Material and methods
2.1) Establishing Animal Models
Many existing animal models for modelling cancer metastasis are murine derived, and thus likely do not reflect the same genetic and epigenetic changes as found in human cancers. Several models have also been derived, using orthotopic xenografts. However, these models show a rare incidence of brain metastasis, making them sub-optimal in brain metastatic research. Therefore, Prof. Thorsens research group has developed novel model systems, where human brain metastasis tumor cell lines from melanoma, lung adenocarcinomas or human breast cancers are injected systemically into nod/scid mice. The cell lines were injected into the left cardiac ventricle in mice, and tumor development was studied by bioluminescent imaging (BLI). During 3-6 weeks, all animals developed new tumors with a clear preference to the brain. T1 and T2 weighted (T1w and T2w) MRI showed multiple metastases within the brain, similar to what is seen in patients, and histology confirmed these findings. The models are thus among the very few which, in a systematic and consistent manner, can mimic the metastatic spread of cancers seen in patients. These models recapitulate most of the steps of the metastatic cascade, and thus provide a better tool to obtain information on the molecular mechanisms behind brain tumor metastasis.
2.2) cMAP and drug selection
After intracardiac injections, tumor burden was seen mainly in the animal brains, and to some extent in bone, adrenals and ovaries. These organs were removed after sacrificing the animals, the organs were dissociated, and tumor cells were sorted out by FACS. Transcriptome profiling with RNA-sequencing was performed on triplicate tumor samples from each organ, on a Illumina HiSeq 2000 platform (at BGI@UC Davis, Sacramento, CA).
2.3 Drugs
The task in my Master work was to screen 9 out of the 10 remaining drugs for in vitro and in
vivo treatment efficacy. These drugs are listed in the table below.
Table. 2.1 - Table containing list of compounds. Also present here are all details relative to molecular weigh, dose usually administered, cMAP score and main applications of these drugs.
Compound MW [Da]
Dose [µM]
cMAP
Score Medical conditions where the drug is used
Decamethonium Bromide
418,2
9 10 -0,871
Interrupts transmission at the skeletal neuromuscular junction by causing sustained depolarization of the motor end plate, skeletal muscle relaxation.
Sulfapyridine 249,29 16 -0,872 A sulfanomide antibacterial.
Pentamidine 340,42 7 -0,873
Antimicrobial medication for prevention and treatment of pneumocystis pneumonia. Also used as prophylactic against PCP in patients receiving chemotherapy.
Lymecycline 602,63 7 -0,878 A tetracycline broad-spectrum antibiotic.
Fluticasone 444,5
1 8 -0,88
Fluticasone propionate is a corticosteroid derived from fluticasone used to treat asthma and allergic rhinitis. It is also used to treat eosinophilic esophagitis.
Lanatoside C 985,12 4 -0,882
A cardiac glycoside, a type of drug that can be used in the treatment of congestive heart failure and cardiac arrhythmia (irregular heartbeat).
Trichostatin A 302,37 1 -0,887
An antifungal antibiotic and selectively inhibits the class I and II mammalian histone deacetylase. TSA has some potential as an anti-cancer drug.
Methyldopa 275,73 15 -0,904 Reduces (antihypertensive). high blood pressure
Gabexate 311,37 19 -0,912
A serine protease inhibitor used (as Gabexate Mesylate) in the treatment of pancreatitis, intravascular coagulation, and as a anticoagulant for haemodialysis.
14
2.4) Cell Culturing Techniques
2.4.1) Cell culturing
The cell culture work was performed under sterile conditions inside a laminar airflow hood. All the working surfaces and equipment were disinfected with 70% ethanol prior to working and when finished. The cells were kept in incubation flasks and multi-well dishes, which were put in the incubator at 37ºC, 5% CO2 and 100% relative humidity. Solutions and disposables frequently used for cell culture are listed below.
Table. 2.2 - Components comprising cell culture medium and freezing solution.
Chemical Supplier
ALT DMEM
Dulbeccos Modified Eagles Medium
Heat inactivated fetal calf serum (FSC) L-Glutamine, 200nM
Penicillin/Streptomycin (PEN-STREP), 100uL/mL Non essential amino acids 100x
Plasmocin, 25mg/mL 450mL 50mL 10mL 10mL 16mL 0.1mL
Sigma-Aldrich Inc. MO, USA
Fischer Scientific, MA, USA BioWhittaker, Verviers, Belgium
BioWhittaker, Verviers, Belgium BioWhittaker, Verviers, Belgium Invivogen, CA, USA
Dulbeccos phosphate-buffered saline (PBS) Sigma-Aldrich Inc.
Trypsin EDTA, 0.25% BioWhittaker
Freezing solution1: ALT DMEM
FCS (Fetal calf serum)
9mL
1mL Freezing solution 2:
1×PBS
Dimethyl sulphoxide (DMSO)
8mL 2mL
The cells were grown in growth medium supplemented with 10% heat-inactivated newborn calf serum, four times the prescribed concentration of non-essential amino acids, 2% L-glutamine, penicillin (100 IU/ml), and streptomycin (100 µl/ml) (hereafter called ALT DMEM). The growth medium was exchanged twice a week. The cells were kept in medium sized blue filtered cap culture flasks (Nunc AS, Roskilde, Denmark) between experiments. The cells were regularly passaged when they reached 70-80% confluency. The old growth medium was removed, and the cells were washed with 3mL PBS. The PBS was then removed, and 3mL trypsin was added into the flask. After 3-4 minutes (when the cells were detached from the plastic surface) 4mL ALT DMEM was added in order to neutralize the effects of the trypsin. One third of the cell solution was then transferred to a new growth flask, and 25mL ALT DMEM was added.
2.4.2) Cell counting
It was important to add the correct amount of tumor cells into each well of the dishes, when performing the proliferation assays. Thus, each experiment started by counting the number of cells in the culture flasks. The large sized flasks containing the cells were trypsinized with 4mL trypsin, followed by adding 5mL ALT DMEM into the culture flask. The cell solution was then transferred into sterile conical centrifuge 15mL tubes (Nunc, Thermo Scientific, NY, USA). We then determined the cell concentration using a Countess ® Automated cell counter (Life Technologies, NY, US) based on the manufactures instructions: 10µl of cell solution were mixed with 10µl of Trypan blue (Life Technologies, NY, US) to exclude dead cells and thereafter pipetted into the Countess ® chamber slides. The chamber slide was placed into the cell counter, and the focus was adjusted to obtain a clear image of the cells. By pushing the "START" button on the machine the number of cells within the slide was automatically calculated and the cell counter showed the number of live cells, dead cells as well as the total number of cells, on the display. Each cell counting experiment was performed in duplicate.
16 2.4.3) Freezing Cells
All cell lines were used only for 12-15 passages before discarded, in order to minimize any potential, phenotypic drift of the cells. Thus, several samples of each cell line were frozen in liquid nitrogen, to ensure that we always had access to new and viable batches.
The cells were first checked using the in-lab light microscope (TMS, Nikon Instruments Inc., NY, USA), to verify whether healthy and adequate in number. The cells were trypsinized, ALT DMEM was added, and the cell solution was transferred into 15mL tubes. The cells were then centrifuged at 900rpm for 4 minutes, and the growth medium was removed from the cell pellet. The freezing solution was then gently added into the tube, the cells were re-suspended, and 1mL of cell solution was transferred into each of 1.5mL cryotubes (Thermo Scientific Inc., MA, USA). The freezing solution was a mix of 2 different solutions, as described in Table 2.2. The vials were wrapped in tissue and placed in a freezer at -80º C over one night, in order to let them cool down slowly. Then they were transformed to the nitrogen liquid tank for long-term storage.
2.5) Cell Lines
Four melanoma metastasis low passage culture cell lines (Melmet1 pGF1, Melmet5 pGF1, H1_DL2 and H3) were used in these experiments. Written consents were obtained from the patients before tumor material was collected. The Regional Ethical Committee (REC Number 013.09) and the Norwegian Directorate of Health (NSD Number 9634) approved the tissue collection and biobank storage of tumor biopsies and derived cell lines.
The H1 and H3 cell lines were previously established in Prof. Thorsens lab, from melanoma brain metastasis of admitted patients at the Haukeland University Hospital, Bergen, Norway. The H1 cells were transduced with two lentiviral vectors, encoding Dendra (a green fluorescent protein (GFP) variant) and luciferase to obtain the H1_DL2 cell line.
The Melmet1 and Melmet5 cell lines were a generous gift from Professor Øystein Fodstad (Dept. of Tumor Biology, the Norwegian Radium Hospital, Oslo, Norway)(5). Melmet1 was established from subcutaneous metastases of a 36-year-old female melanoma patient. This particular cell line have demonstrated invasive potential but low intrinsic proliferation in comparison to Melmet5 which shows a larger proliferation capacity. Melmet5
was established from a lymph node metastases of a 56 year old male melanoma patient. They have low invasive capacity and as mentioned before a rapid proliferation ability. These cells have a strong tendency to metastasize to the brain, lung, liver and bone (in vivo). The Melmet 1 and Melmet 5 cells were transduced with a lentiviral vector, encoding CopGFP (a GFP variant) and Luciferase, resulting in the Melmet 1 pGF1 and Melmet 5 pGF1 cell lines.
All cells were grown in ALT DMEM. The cells were kept in a standard tissue culture incubator at 37 °C with 100% humidity and 5 % CO2. The growth medium was exchanged twice a week.
Figure. 2.1 – Figure showing morphological aspect of cell lines used in this work, scale bar 50µm.
18
2.6) Monolayer viability assay
The monolayer viability assay is based on the enzymatic reduction of resazurin by viable cells. Resazurin comes as a sodium salt (Sigma Aldrich, ST. Louis, MO, US), and was diluted to a stock solution of 1mg/mL in PBS (Sigma Aldrich). The stock solution was frozen at -20ºC until use. Before use, the stock solution was thawed and mixed with PBS to a working concentration of 0.1mg/mL. The amount of applied resazurin was 10% of the current volume of solution in the well or the dish.
Three 96-well plates (Nunc, Thermo Scientific, USA) for each cell line were prepared with 8×10³ cells/100µL into each well of the plate. After 24 hours of incubation to make sure the cells were attached to the surface, 100 µL of drug was added into each well, to obtain the following concentrations, 0.001 µM, 0.01 µM, 0.1 µM, 0.5 µM, 1 µM, 2.5 µM, 5 µM, 50 µM, 100 µM or 500 µM. One column in each 96-well plates contained only cells and medium, without drug (negative control). Another column contained only medium, without adding cells or drug, and was used for calculation of background signal from the medium. As most of the drugs were dissolved in DMSO, a control of DMSO (0.01µM in ALT DMEM) was also prepared to ensure that this had no effect with cell viability, which was proved. After 72 hours of drug exposure, 20µL resazurin was added into all wells in the 96-well dish. Following incubation for 4 hours, the absorbance was measured at dual mode, at wavelengths of 560/590 nm absorbance value with a scanning multiwell spectrophotometer (Victor 3 1420 multi-label counter, Perkin Elmer, Waltham, MA, USA) using WorkOut v2.0 software (Dazdag Solution Ltd. East Sussex, UK), which created an Excel spreadsheet with the measurement data, as the output of the experiment.
All the results were transformed and prepared using the GraphPad Prism v6 software (GraphPad software, Inc, La Jolla, CA, USA). The data was normalized in Excel before being transferred to GraphPad Prism, where the data was transformed into a logarithmic form before fitted into a curve using a normalized response – variable slope logistic nonlinear regression analysis.
2.7) DNA Cell Cycle Analysis
Treatment of cells started by seeding 1.5×10⁵ cells into each well of a 6-well plate (Nunc, Thermo Scientific, USA). After 24 hours of incubation and making sure that the cells had attached to the surface, 100µM of either Methyldopa or Pentamidine was added to three of the wells. The other three wells were controls and only received ALT DMEM. Exposure to drug continued for 48 hrs before the samples were prepared for flow cytometric analysis. The experiments were performed for all four cell lines.
The important point was to collect the cells and prepare the fixed samples while they were at approximately 70% confluency. It is important to avoid 100% confluency, as this will change the cell cycle towards more cells in the G1 phase.
The fixation step began by removing the medium in each well, and adding 0.5mL trypsin. When the cells had detached from the surface, 1.0mL ALT DMEM was then added, the cell solution was transferred into sterile 15mL tubes, and centrifuged at 500rpm for 5 minutes. The growth medium was then gently removed from the cell pellet, 100% ice cold EtOH was added, and the cells were re-suspended to obtain a homogeneous solution of cells. The cells were kept in the fridge (at 4ºC) until analysis.
As final preparation before flow cytometry analysis, the fixed samples were collected from the fridge and centrifuged at 900rcf for 5 minutes, the EtOH was removed and then 50µL 1mg/ml RNase (diluted in 1×PBS) and 150µL PI (Propidium Iodide) (50µg/ml) was added to the tubes. PI is fluorescent molecule that is used to stain the cells nuclei and has an excitation wavelength of 488 nm (39) and emits at a maximum wavelength of 617 nm. The samples were incubated at room temperature (RT) for 30 minutes in the dark to provide enough time for the RNase to dissolve free RNA in the cell solution (which otherwise would have been stained by PI, giving a false readout). The cell solution was transferred into a 2mL Eppendorf tube (Eppendorf AG, Hamburg, Germany) after passing through a cell strainer (Becton Dickinson Biosciences, MA, USA) and was mixed by a vortex mixer to make sure that the pellet was dissolved. All samples were analyzed using a BD AccuriC6 flow cytometer (Becton Dickinson Biosciences, NJ, USA). The fluorescence intensities were quantified by gating a two-parameter FL2-A and FL2-H cytogram to a one-parameter red fluorescence intensity plot. The data was further analyzed using Flowjo software (FlowJo, LLC, Ashland, OR, USA), to determine the % of cells in the different phases of the cell cycle. In this experiment, a peak area of FL2-H was recorded at 561 nm on a linear scale for the determination of cell cycle analysis, (39).
20
Figure. 2.2 – Schematic representation of flow cytometry data analysis: A representing raw flow cytometry data, B represents single cells within the circle, also called gate (the registered point outside the gate is either doublets or debris) and C cell cycle analysis (of the cells shown within the gate in Fig B).
The data was analyzed using FlowJo software (FlowJo, LLC, Ashland, OR, USA). In FlowJo, after sorting the selected cell population into by adjusting the scale of the axis, viable cells were gated from the debris and other residue, see figure 2.4 –B and C. By using the provided software through univariate analysis of fractions of cells, cell cycle for the determined population was derived using DNA binding dye PI. The histogram shows G1, S and G2/M phases of the cell cycle under the categories of 2N, S, and 4N. It also revealed duration of each phase, and possible shift, figure 2.4 – C (40).
2.8) Apoptosis Assay
First, 5×10⁴ cells were seeded into each well of a 24-well plate (Nunc, Thermo Scientific, USA). After 12 hours of incubation, Methyldopa or Pentamidine were added into the wells at a concentration of 100mM. The cells were exposed to the drug for 72 hours. Cells exposed to 10mM H2O2 for 4 hours were used as positive controls. Thereafter, 80µL Rose Bengal (concentration 1mg/mL; Sigma Aldrich, MO, USA) was added into each well, and incubated for 30 minutes at 37ºC.
Cells were then collected and prepared for flow cytometric analysis. The top part of the medium in the wells was carefully collected using a 1mL pipette, and discarded. The remaining 1mL of medium, containing floating apoptotic cells, was collected in a 2mL eppendorf tube. 500 mL of PBS where then immediately added into the well to wash the plate, and the PBS was then transferred into the same eppendorf tube. In the next step, 500mL trypsin was added into the well and left in the CO2 incubator for a few minutes to detach the cells, and then transferred to the previous fractions. This procedure was repeated for all wells in the 24-well plate. All tubes were centrifuged (1×1000 rcf eppendorf centrifuge, 3 minutes at 4ºC). The supernatant was carefully removed, and the cells were washed twice, by re-suspending the cell pellet in 900mL PBS, followed by centrifugation as described above. Finally, the supernatant was removed, and the cell pellet was re-suspended in 100mL PBS. The samples were then analyzed on AccuriC6 flow cytometer, in a two parameter FL2-H by FL2-A cytogram, and thereafter analyzed further using the FlowJo software, as previously described in Chapter 2.7.
2.9) Soft Agar proliferation assay
Agar is a gelatinous substance, which is difficult to work with, as it hardens quickly in room temperature. In this assay, it was necessary to mix the tumor cells with liquid agar, thus it was essential to keep the agar at 37 ºC during this procedure. This assay includes three different steps: first preparing base agar, then preparing soft agarose overlay, and finally adding the drug solution.
1) Preparing base agar: For base agar preparation, 2.4% Difco Agar Noble (Becton Dickinson Biosciences, NJ, USA) was prepared by dissolving 0.48g Agar Noble in 20mL
22
autoclaved water (milliQ) in a glass bottle, warmed in a microwave and stirred until completely dissolved and homogeneous. Agar Noble solution and 60mL ALT DMEM were then warmed to 500C in a preheated water bath, and 3 parts of medium was mixed with 1 part of Agar Noble solution (3:1). 50µL of this mix was administered into each well in a 96-well plate and left at room temperature, to cool down.
2) Soft agarose overlay: A low melting point agarose (Sigma-Aldrich) was then prepared and overlaid on top of the base agar solution. 0.48g of low melting point agarose was mixed with 20mL milliQ water in a glass bottle (2.4% solution), and microwaved until dissolved. The solution was then kept in preheated water bath together with ALT DMEM for approximately 10 minutes. The agarose solution was mixed with ALT DMEM (1 part agarose solution and 3 parts of ALT DMEM) and placed back into the water bath. At this point the temperature of the water bath was decreased to 400C. Meanwhile, the cell solutions were prepared at a concentration of 1.6×10⁵ cells/mL in ALT DMEM and were kept in the 15mL tubes in the CO2 incubator. Two packages of filtered disposable pipette tips were placed in the CO2 incubator as well. One at a time, the tubes containing cell suspension were mixed with agarose overlay/ALT DMEM solution (1:1 mix). 50 µL of this mixture was administered, with preheated filtered pipette tips, on top of base agar in each well of the 96-well plates. Afterwards, the plates were placed in a refrigerator for 30-35 minutes in order to prevent the cells from subsiding to the bottom of the soft agarose layer.
3) Adding the drug solution. After 30 minutes the plates were fetched from the fridge and the wells were overlaid with ALT DMEM containing drugs, to final desired concentrations (0.001 µM, 0.01 µM, 0.1 µM, 0.5 µM, 1 µM, 2.5 µM, 5 µM, 50 µM, 100 µM or 500 µM).
Afterwards, the plates were left in the incubator for several days for the cells to form spheroids. The incubation time was different for the different cell lines. Melmet5 pGF1 had formed a lot of detectable spheroids after 7 days, while it took H1_DL2 and Melmet1 pGF1 10 days to form spheroids. For the H3 cell line, it took 14 days to reach adequate numbers of spheroids. Resazurin was added to each plate and after 4 hours of incubation, each plate was analyzed in the spectrophotometer, followed by analysis in GraphPad Prism v6 as described in Section 2.5. This assay was repeated 3 times for each cell line and each drug.
2.10) Principles of Animal Handling
First and most importantly of all who care for, use, or produce animals for research, testing, or teaching must assume responsibility for their well-being. The principles of animal laboratory science used to uphold the scientific rigor and integrity of biomedical research with laboratory animals are expected to be followed by all.
Both researchers and institutions have affirmative duties of humane care and use that are supported by practical, ethical, and scientific principles. This system of self-regulation establishes a rigorous program of animal care and use and provides flexibility in fulfilling the responsibility to provide humane care. The specific scope and nature of this responsibility can vary based on the scientific discipline, nature of the animal use, and species involved, but because it affects animal care and use in every situation this responsibility requires that all that work with animals carry out purposeful analyses of proposed uses of laboratory animals. Following the European animal welfare (EWA) rights all animals must be treated humanely;
• Freedom from hunger and thirst; • Freedom from discomfort;
• Freedom from pain, injury and disease; • Freedom to express normal behavior; • Freedom from fear and distress. (EWA)
Humane care means those actions taken to ensure that laboratory animals are treated according to high ethical and scientific standards. Implementation of a humane care program, and creation of a laboratory environment in which humane care and respect for animals are valued and encouraged.
24
Figure. 2.3 – Image of a nod/scid mouse used in in vivo experiments.
When it comes to designing humane animal research studies, an accepted system is the implementation of the 3 R’s, Replacement, Refinement & Reduction.
Replacement refers to methods that avoid using animals. The term includes absolute replacements (i.e., replacing animals with inanimate systems such as computer programs) as well as relative replacements (i.e., replacing animals such as vertebrates with cells).
Refinement refers to modifications of husbandry or experimental procedures to enhance animal wellbeing and minimize or eliminate pain and distress.
Reduction involves strategies for obtaining comparable levels of information from the use of fewer animals or for maximizing the information obtained from a given number of animals (without increasing pain or distress) so that in the long run fewer animals are needed to acquire the same scientific information (41).
2.11) MRI
The superior imaging modality MRI, with its excellent tissue contrast, is a risk-free procedure for the patients because it does not use ionizing radiation.
The source of the MRI signal is based on the hydrogen nuclei or protons, which are abundantly present in tissue. Each proton is positively charged, and is also constantly spinning around its own axis. According to physics theory, a moving electrical charge of this kind generates a current, which in turn creates a magnetic field.
The orientations of all these protons in tissue are usually randomly directed, creating a net magnetic moment, which is zero. However, when a biological specimen is placed within the magnet of an MRI system, the protons will align either parallel or anti-parallel with the main magnet field, B0. The majority of protons will align parallel, as this requires the least energy. The difference between the number of protons aligned parallel and the number of protons aligned anti-parallel is usually very small. However, this difference increases with elevated magnetic field strength, and is the source for generating a signal, which in the end is reconstructed to become part of the MR image (42).
In order to detect a signal from the precessing protons, the protons need to be manipulated. Radiofrequency (RF) pulses are therefore switched on and off, knocking the protons out of the alignment with B0. The disturbance occurs when energy with the same frequency as the precession frequency is applied to the tissue, causing resonance. The net magnetic moment will as a consequence move out of alignment with B0, and the protons are moved into the transverse plane, or the x-y plane (42, 43).
26
Figure. 2.4 – Absorption of RF energy, starting with the net magnetization, using a RF pulse at Larmor frequency energy is absorbed by the protons causing net magnetizations to rotate from z plane to x – y plane, adapted from (43).
The use of an RF pulse will move some of the protons from the parallel to the anti-parallel state, resulting in a reduction in overall longitudinal magnetism. Also the RF pulse makes the protons move in the same direction, or phase. The result is that a magnetization occurs in the transverse plane, moves at the Larmor frequency and thus generates an
alternating voltage that can be detected in antennas or RF coils. The Larmor frequency is the sum magnetic field from these protons, which is now regarded a single vector M0, rotates around B0 with a precession frequency determined by the magnetic field. This signal is used in the formation of an MRI signal. When the RF pulse is turned off the protons will start to move out of phase and lose energy, termed «proton relaxation».
This takes place in two ways; transverse magnetism is referred to as T2 or spin-spin relaxation, and longitudinal magnetism returns to the initial situation called T1 or spin-lattice relaxation. The speed at which T1 relaxation occurs is dependent on the properties of the surroundings. Therefore, different tissues or arrangements with hydrogen to other substances will produce different T1 relaxation times. The time constant T1 is the time it takes until longitudinal magnetism is regained to 63 % of its final value (Fig. a). T2 relaxation describes loss of in-phase protons due to in homogeneities within the local tissue and within B0. The time constant T2 describes the time it takes before transverse magnetism is reduced to 37 % (Fig. b) (42, 43).
Fig. 2.5 – Representation of T1 and T2 curves. a) T1 characteristic of tissue, consisting of the time it takes for longitudinal magnetization to recover to 63%. b) T2 characteristic of tissue, consisting of the time it takes for transversal magnetization to decrease to 37%. Adapted from (43).
MRI studies were performed using a Bruker Biospec 7 Tesla (7 T) small animal scanner (Bruker BioSpin MRI, Ettlingen, Germany) equipped with a mouse head transmit/receive coil for transmit and a four channel mouse brain phased array for receive. Images were acquired using ParaVision 5.1 (Bruker BioSpin MRI). MRI was used to study tumor burden with and without drug in a nod/scid mouse after administration of the Omniscan contrast (GE Healthcare, Fairfield, CT, USA) as commonly used in the clinic.
28
3) Results
Prior to my arrival, animal models and drug selection had been established, with cMAP results represented in subsection 3.1. My task consisted of a preliminary in vitro drug screening with the application of possible candidates in in vivo trials, of the remaining 9 candidates.
3.1) cMAP and Drug Selection
After intracardiac injections, tumor burden was seen mainly in the animal brains, and to some extent in bone, adrenals and ovaries (Figs 3.1A, 3.1 B). Principal component analysis showed distinct clustering of the gene data obtained from the different organs (Fig 3.1 C). A bioinformatics analysis was performed, comparing differentially expressed genes in the brain metastatic cells, with gene expression in the metastatic cells from adrenals, bone and ovaries. From the analysis we could determine a list of 108 candidate genes (54 up, 54 down; Fig 3.1 D), potentially important in metastasis to the brain. This gene list was compared to gene profiles published online (Connectivity Map or cMap, Broad Institute, Boston, MA). In cMap, thousands of commonly used compounds and drugs have been tested on several different cancer cell lines, and gene profiles before and after treatment have been determined and published online (Fig 3.1 E). We found that 20 drugs published in cMap resulted in the exact opposite gene profile, compared to our gene profile. The top ten drugs were tested in Prof Thorsens lab prior to my arrival (Fig 3.1 F), if any of them showed efficiency in vitro, they continued to study in vivo. They found that β-sitosterol effectively inhibited brain metastatic tumor cell growth in vitro and in vivo.