online | memorias.ioc.fiocruz.br
The spatiotemporal trajectory of a dengue epidemic
in a medium-sized city
Daniela G Morato1, Florisneide R Barreto1, José U Braga2,3, Marcio S Natividade1,
Maria da Conceição N Costa1, Vanessa Morato1, Maria da Glória Lima Cruz Teixeira1/+
1Instituto de Saúde Coletiva, Universidade Federal da Bahia, Salvador, BA, Brasil 2Escola Nacional de Saúde Pública,
Fundação Oswaldo Cruz, Rio de Janeiro, RJ, Brasil 3Universidade do Estado do Rio de Janeiro, Rio de Janeiro, RJ, Brasil
Understanding the transmission dynamics of infectious diseases is important to allow for improvements of con-trol measures. To investigate the spatiotemporal pattern of an epidemic dengue occurred at a medium-sized city in the Northeast Region of Brazil in 2009, we conducted an ecological study of the notified dengue cases georeferenced according to epidemiological week (EW) and home address. Kernel density estimation and space-time interac-tion were analysed using the Knox method. The evoluinterac-tion of the epidemic was analysed using an animated projec-tion technique. The dengue incidence was 6.918.7/100,000 inhabitants; the peak of the epidemic occurred from 8 February-1 March, EWs 6-9 (828.7/100,000 inhabitants). There were cases throughout the city and was identified space-time interaction. Three epicenters were responsible for spreading the disease in an expansion and relocation diffusion pattern. If the healthservices could detect in real time the epicenters and apply nimbly control measures, may possibly reduce the magnitude of dengue epidemics.
Key words: dengue - epidemiology - epidemic - diffusion - spatiotemporal - trajectory
2006). This mosquito infests more than two-thirds of Bra-zil’s municipalities and large-scale epidemics have repeat-edly occurred in many municipalities. The occurrence of severe disease has also increased in several urban centers. These observations show that the actions that have been taken to reduce Ae. aegypti populations have been inef-fective for reducing viral transmission in the affected cit-ies, suggesting the need for epidemiological studies that produce information that contributes to the improvement of measures for dengue control and increase of its effec-tiveness (Teixeira et al 2002, 2009, Ooi et al. 2006).
Dengue epidemics have occurred in the state of Ba-hia (BA), a northeastern Brazilian state, since 1994. In that year, the DENV-2 serotype was introduced and it quickly spread to other urban centers (Melo et al. 2010). Since then, the incidence of dengue has been high (mini-mum of 49.4 per 100,000 inhabitants in 2004). At times, the incidence has exceeded the national average. In 2009, the incidence increased to 844.7 cases per 100,000 in-habitants (SESAB/DIVEP 2012). Among the epidemics that affected the cities of BA, we highlight the one that occurred in Jequié in 2009 due to its high incidence and severity, which alarmed the inhabitants of the munici-pality. In Brazil, several mid-sized urban centres located in countryside constitute regional economic centers by having higher infrastructure of trade and services that attract populations of the cities of their surroundings, fa-vouring movement intense of people (IBGE 2014). Pos-sibly, this is one of the factors that make them important centres for spreading dengue fever (Melo et al. 2010).
The transmission of dengue is modulate by a multi-plicity of factors such as herd immunity, density of the vector population, climate, socioeconomic status, sani-tation, density demographic, intraurban mobility, life-style, type of home construction, vegetation, among oth-ers (Kuno 1995, Guha-Sapir & Schimmer 2005). Several
doi: 10.1590/0074-0276140388
Financial support: CNPq (550129/2010-3) + Corresponding author: magloria@uf ba.br Received 20 October 2014
Accepted 11 May 2015
Dengue epidemics have affected the inhabitants of more than 100 countries worldwide, especially in tropi-cal areas. There are estimates that approximately 390 million infections and 96 millions of cases of dengue oc-cur per year (Bhatt et al. 2013). Because it is widespread, has great potential to cause severe or lethal disease, in addition to economic and social impacts, dengue is one of the world’s greatest infectious disease problems (Hal-stead 2007, Massad & Coutinho 2011). Currently, coun-tries in Central and South America account for almost 70% of the dengue cases reported to the World Health Organization (WHO) (Teixeira et al. 2009, San Martín et al. 2010, WHO 2014).
In Brazil, successive dengue epidemics have oc-curred; its incidence has ranged from 40.2 cases per 100,000 inhabitants in 2004 to 744,9 cases per 100,000 inhabitants in 2013, with near 1.5 million cases regis-tered in the same year (MS 2014). The Brazilian dengue cases account for almost 80% of the reported cases in the Americas and 61% of worldwide cases (Teixeira et al. 2009, WHO 2013).
authors have search to identify factors involved in this process in specific territories, using analysis tool spa-tial and space-time (Ali et al. 2003, Van-Benthem et al. 2005, Barreto et al. 2008, Mondini & Chiaravalloti-Neto 2008, Jeefoo et al. 2010). This multiplicity of factors hin-ders a more complete approach of research on dengue. Therefore, to identify trends, most affected groups and the formation of spatial or relational “clusters”, the de-scriptive epidemiology can provide important contribu-tions to characterise the behaviour of the disease show-ing their changes over time and space and offershow-ing new strategies for monitoring and control, especially when it employs new methods and computational tools. Thus, understanding the transmission dynamics of infectious diseases is important not only because the information advances our knowledge on the subject, but also because it potentially allows for improvement of the available control measures (Kuno 1995, Barreto et al. 2008).
This study aimed to identify the spatiotemporal pat-tern of dengue cases reported in a medium-sized city located in the Northeast Region of Brazil.
MATERIALS AND METHODS
Study area - We analysed the dengue epidemic that occurred in 2009 in Jequié (Fig. 1), an important regional hub of BA. The epidemiological weeks (EW) from November 2008-December 2009 were used as the unit of time. Census tract (CT) and neighbourhood were the spatial units. This city is located between the Ca-atinga (tropical dry forest) and the Zona da Mata (forest zone). It has a tropical climate and is rainy and semiarid. Jequié experiences high temperatures (maximum 40ºC and minimum 19ºC) and a relative humidity ranging from 40-91%. In 2010, approximately 151,921 inhabit-ants lived in Jequié. The city had a mean density of 50.05 inhabitants per km2 (IBGE 2014).
Data - The dengue data were obtained from the re-cords of the Information System on Notifiable Diseases (SINAN) of the Health Department of the State of Bahia. Duplicate records and cases with incomplete or unregis-tered addresses were excluded.
All of the reported dengue cases registered met the dengue infection criteria adopted by the health services. The criteria are standardised by the Ministry of Health according to the recommendations of the Pan American Health Organization. Dengue fever was defined using the following criteria: (i) living in an endemic area, (ii) acute fever with a maximum duration of seven days and (iii) presence of at least two of the following symptoms: headache, retroorbital eye pain, myalgia, arthralgia, prostration or exanthema (WHO 1997).
Geoprocessing - The cases in each household were georeferenced using a global positioning system. Next, the distribution of the cases was analysed by CT and by neighbourhood. A CT corresponds to the smallest territorial unit with identifiable physical limits and is delimited by the Brazilian Institute of Geography and Statistics (IBGE). Approximately 95% (10,214) of the 10,805 cases registered in the SINAN by the Municipal Health Department of Jequié were georeferenced. The addresses were spatialised in the Arcview GIS 3.3 soft-ware using the IBGE geographical mesh of the munici-pality’s cartographic base. Maps with the distribution of the reported dengue cases during the study period for each EW were created.
Spatial analysis - The diffusion process of the epi-demic was graphically represented using the Kernel method (quadratic function) for density estimation (Ga-trell & Bailey 1996). Simulations were performed to test the bandwidth. The values of 800 m, 1 km and 1.5 km were tested using the formula shown below. The band-width of 1 km was found to be the most adequate to il-lustrate the progression of the epidemic.
λˆ (s) =
Σ
__k [ _____(s-si) ]τ n
i=1
1
τ2
where λˆ (s) is a value estimated per area, τ is a band
-width (smoothing parameter), k is the Kernelweighting function, s is the area center and si is the point location.
A series of 59 Kernel maps was created. The maps corresponded to the time between the EW 47 in 2008 and EW 52 in 2009. These representations showed the distri-bution of the reported dengue cases in this time frame in the CTs of the municipality. In this way, virus trans-mission through time and space was represented. These maps were used to construct images of the epidemic dif-fusion pattern. Then, the images were transformed into an animated projection for ease of visualisation.
Space-time analysis - The space-time interaction was evaluated using the Knox method (Knox & Bar-tlett 1964, Levine 2013). This test, as well as all those who value space-time interaction, identifies the number of cases of a disease that are clustered in space-time. It counts the pairs of events that have occurred within criti-cal pre-determined intervals of time and distance. Given
“n” points located in time and space, there are n*(n-1)/2 distinct pairs that can be divided into a 2 x 2 matrix. By simple statistics, the observed number of pairs of cases clustered in time and space is compared with the expected value (EV), assuming the null hypothesis of no interaction (Kulldorff & Hjalmars 1999). The distance between the cases considered near each other is defined by the researcher, who must observe aspects of the trans-mission of the disease. In this study, dengue cases were considered to be close in space if they belonged to the same CT and close in time if the disease occurred during the same EW. To correct a mistake in the variance struc-ture in Knox it was calculated the p-value based on the Poisson distribution and a Monte Carlo approach were also used to evaluate the significance of Knox’s test for space-time clustering. It was done to handle the issue of interdependency (Levine 2013).
To characterise the anatomy of this event, the authors chose to apply this method in EW with highest and low-est number of reported cases of dengue, specifically in seven different points in time of the epidemic: the begin-ning (47 EW/2008), the peak (9 EW/2009) around the peak (7, 8, 10, 11 EW/2009) and the end (22 EW/2009).
RESULTS
The incidence of reported dengue cases in 2009 was 6.918.7/100,000 inhabitants and only DENV-2 was isolat-ed. The group at highest risk was five-nine year olds, with an incidence of 7.910/100,000 inhabitants. The next most-affected age groups were 10-19 year olds and 20-29 year olds (7.547 and 7.765/100,000 inhabitants, respectively).
Temporal evolution - In 2008, between EWs 29-46, the number of dengue cases in Jequié ranged from one-three. The epidemic began in November during EW 47, when seven cases were registered. In week 52, over 100 cases had already been reported. In the first week of 2009, the number of dengue cases tripled. From that time point, a further increase in the number of cases was reported. Between weeks 6-9 of 2009, 3,616 cases of dengue were registered, which accounted for 34.4% of the total reports in that year. In week 9 of 2009, the incidence increased to 828.7 cases per 100,000 inhabitants. The decline of the epidemic began in week 10 of 2009. In this week, approxi-mately 40% fewer cases were reported compared with the previous week. In week 23 of 2009, only six cases were reported. In the second half of the year, the highest re-ported number was 31 cases, in the EW 43 (Fig. 2).
Spatial distribution - Dengue cases were registered in almost all of the intraurban spaces of Jequié, including the sparsely populated areas. Only 10 CTs showed no record of the disease. In the midwestern region, where most of the CTs were small in size, the Joaquim Romão and Centro neighbourhoods accounted for 42% of the total epidemic cases. The most populous neighbourhood of the munici-pality (Jequiezinho), which is in the central eastern portion of the city, also registered a large proportion of cases (27% of total cases). There are areas of lower population den-sity in the east and west. When compared with the central, northern and southern areas of the city, which have larger CTs, the east and west registered a lower number of cases. The Mandacaru neighbourhood was the only exception. It
is situated in a southern region of the city and accounted for 11% of the total reported cases of dengue (Fig. 3).
Space-time distribution - The seven dengue cases re-ported in EW 47 of 2008 were distributed in five CTs. The 13 cases reported in EW 49 were concentrated in the midwestern region, but cases in the northern and eastern regions of the city were also reported.
With the epidemic progression, the cases became concentrated in the CTs of the Joaquim Romão neigh-bourhood. In total, 74% (113) of the 152 reported cases in epidemiological EW 51 and EW 52 occurred in this neighbourhood in 2008. The concentration of reported cases in Joaquim Romão continued until EW 9 of 2009 (maximum epidemic peak).
The epidemic also significantly affected the eastern and southern regions of the city. The Jequiezinho neigh-bourhood in the east and Mandacaru neighneigh-bourhood in the south registered large numbers of dengue cases. None-theless, isolated reports were registered throughout almost
Fig. 2: temporal evolution of the reported cases and incidence dengue by epidemiological week (EW), Jequié, state of Bahia, Brazil, 2008 [from EW 47 (source: SESAB/DIVEP 2012)]-2009.
the entire city beginning in EW 2 of 2009. This pattern of reports persisted until the end of the epidemic (EW 22), when the number of reports stabilised at six-31 cases.
The distribution of dengue cases by neighbourhood in each of the 52 EW revealed that the virus was spread in waves that started in a primary epicenter, the Joaquim Romão neighbourhood, the second most populous neigh-bourhood in the city. This area was that most contributed to the peak of the epidemic (EW 9) and to viral transmis-sion across the regions of Jequié. This same area pro-duced two secondary epicenters with high transmission rates, including Jequiezinho and Mandacaru. These epi-centers were formed between EW 7-EW 9 of 2009. At this time, the epidemic had affected almost the entire city. This trajectory spatiotemporal can be best viewed in the animated projections (Supplementary data).
The Knox test (Table I) indicated space-time
interac-tions (A = 13,580,769; p = 0.0001) during the epidemic.
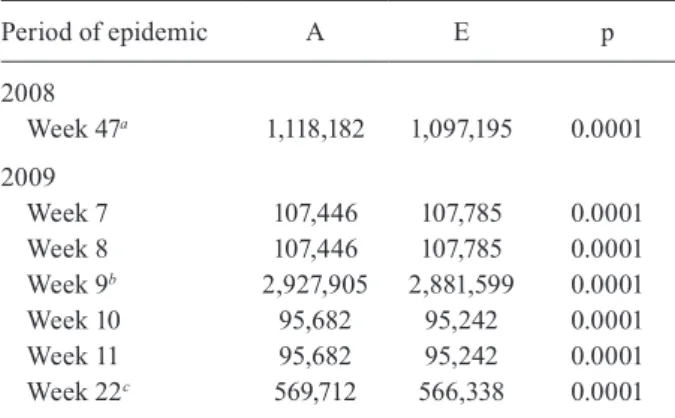
In the Table II, it should be noted that the number ob-served of events (A) that were close in space and in time significantly exceeded the expected of events (E) at the
beginning (EW 47 of 2008: A = 1,118,182; E = 1,097,195), in the peak (EW 9 of 2009: A = 2,927,905; E = 2,881,599; EW 10 and 11: A = 95,682; E = 95,242) and end of the epidemic (EW 22 of 2009: A = 569,712; E = 566,338).
Thus, a greater interaction was observed at the peak of the epidemic curve and a lesser interaction was observed as the curve declined at the end of the epidemic.
DISCUSSION
The surprising value of the incidence (6.918.7/100,000 inhabitants) of dengue during the epidemic that affected Jequié in 2009 was more than nine times upper that ob-served in 2002 (821.19/100,000 inhabitants), that previ-ously was the year with the highest incidence of dengue in that city, when only DENV-3 was isolated . The inci-dence in 2009 was also 13.5 times higher than the mean incidence observed in Brazil in 2010, one of the epidemic years to dengue in this country (Siqueira Jr et al. 2010).
DENV-2, the agent responsible for the 2009 epidem-ic in Jequié, was first time detected in the city in the late 1990s. The intense viral transmission was not contained until more than four weeks following the epidemic peak and 12 weeks after the epidemic onset. This containment may have been a result of a decrease in the number of susceptible individuals because the vector control mea-sures were unsuccessful.
The significant interaction suggested that the disease distribution was not random. This result showed that there was an unexpected increase in dengue cases that were spatially close for events that were also close in time. The pattern of spread of this disease was initially characterised by its expansion around a focus producer of cases with greater intensity and, in a second stage, by displacement of that focus with the formation of several other second-ary focus. Considering as reference the diffusion patterns of communicable diseases defined by Cliff et al. (1981) and Haggett (2000), we conclude that the trajectory of this epidemic sets up a mixed pattern of diffusion, i.e., initially by the expansion and later by re-location.
This pattern found for the Jequié epidemic was dif-ferent than the pattern described for the dengue epidem-ic in the capital city, Salvador, in 1995, in whepidem-ich only one epicenter was responsible for the spread of the disease (Barreto et al. 2008). This difference is difficult to ex-plain due to the numerous factors and complexity of the transmission dynamics of DENV (Kuno 1995, Teixeira et al. 1999, Barreto et al. 2008, Mondini & Chiaravallo-ti-Neto 2008). The three epicenters of Jequié epidemic were formed in neighbourhoods characterised by high population density, low socioeconomic level and more precarious sanitary conditions, especially with regard to poor water supply, forcing their storage in tanks, drums and containers, that promote the proliferation of the mos-quito. Unfortunately, these and other information such as infestation levels of Ae. aegypti, quantitative of breeding of this mosquito and DENV serotypes in prior periods were not available disaggregated by CT, in Jequié, that could help in explaining the origin of these epicenters.
TABLE I
Paired cases of dengue according to both spatial and temporal distancesa during the epidemic in Jequié,
state of Bahia, Brazil, 2008-2009
Pairs
Close in space (dij<d0)
Distant in space (dij≥d0) Total
Close in time (tij<t0)
13,580,769 (A)
12,734,967 (B)
26,315,736 (A + B)
Distant in time (tij≥t0)
12,498,128 (C)
13,343,927 (D)
25,842,055 (C + D)
Total 26,078,897
(A + C)
26,078,894 (B + D)
52,157,791 (N)
a: Knox statistics; d0: critical spatial distance; d0: critical tem-poral difference; dij: spatial distance observed between cases i and j; tij: time difference observed between cases i and j. p value from the chi-square test: 0.0001.
TABLE II
Number of paired cases of dengue observed (A) and expected (E) according the period
Period of epidemic A E p
2008
Week 47a 1,118,182 1,097,195 0.0001
2009
Week 7 107,446 107,785 0.0001
Week 8 107,446 107,785 0.0001
Week 9b 2,927,905 2,881,599 0.0001
Week 10 95,682 95,242 0.0001
Week 11 95,682 95,242 0.0001
Week 22c 569,712 566,338 0.0001
Despite the differences in the patterns of spread of these dengue epidemics, it is important to note that the transmission dynamics of DENV over the course of the epidemics generally favoured the formation of hotspots representing loci of intense transmission of the agent, as shown in this and in similar studies (Barreto et al. 2008, Jeefoo et al. 2010, Toan et al. 2013). It is possible that the formation of new hotspots that occurred in Jequié was due to the displacement of persons who had unap-parent infections or who were in the incubation period of the disease to other areas in the city receptive to vi-ral circulation. In fact, when there are large numbers of individuals susceptible to the virus and Ae. aegypti are present (Morrison et al. 2010) at the site, the spread of the disease is re-inforced, setting up a new epicenter.
Under-reporting, under-registration and misdiagnosis can affect the interpretation of results from studies using secondary data. Dengue cases diagnosed based on clini-cal signs and symptoms of the disease and epidemiologi-cal links were included, even without laboratory confir-mation. However, another study of a dengue epidemic in Brazil showed that 80% of the cases reported based on the clinical-epidemiological criteria that were applied in the present study (WHO 1997) were confirmed by labora-tory testing (da Rosa et al. 2000). Thus, it can be assumed that the reported cases in Jequié have the same proportion of true cases of dengue fever. As most DENV infections are asymptomatic (Endy et al. 2011), the dynamics of the disease when analysed from clinical cases represent only an approximation of the true dynamic. Despite the afore-mentioned limitations, it is possible that the influence of these restrictions did not substantially modify the actual spatiotemporal pattern of this epidemic. Problems con-cerning addresses that were not georeferenced were also assumed to be minimal because the procedure could not be performed in only 5% of the records.
The highest magnitude of the dengue epidemic oc-curred in Jequié, in 2009, suggests that the surveillance and control actions that have been employed to prevent the occurrence of dengue have not been sufficiently ef-fective, similar to what is happening in other parts of the world (Ooi et al. 2006). This fact has encouraged the development of new methods for reducing the transmis-sion of the DENV, such as the use of immunogens and traps to capture vector mosquitoes and genetic modifica-tions and bacterial infection of Aedes colonies. The use of current geoprocessing technologies allows identifica-tion, day by day, of the urban areas responsible for the highest degree of disease spread. Thus, when more ef-fective instruments are available, intervention strategies that integrate various actions directed at these epicenters can be developed, with the aim of reducing the strength of the transmission of the DENV early in an epidemic.
In the context of public health, it is clear that the chain of transmission of infectious diseases should, ide-ally, be interrupted. As nowadays the only link vulner-able in the epidemiological chain to dengue is its vector, the identification of epicenters timely can help develop special strategies of vector control aimed at reducing transmission strength in these areas, in order to reduce the magnitude of the epidemic.
REFERENCES
Ali MY, Wagatsuma Y, Emch M, Breiman RF 2003. Use of geo-graphic information system for defining spatial risk for dengue transmission in Bangladesh: role for Aedes albopictus in an urban outbreak. Am J Trop Med Hyg 69: 634-640.
Barreto FR, Teixeira MG, Costa MCN, Carvalho MS, Barreto ML 2008. Spread pattern of the first dengue epidemic in the city of Salvador, Brazil. BMC Public Health 8: 51.
Bhatt S, Gething PW, Brady OJ, Messina JP, Farlow AW, Moyes CL, Drake JM, Hoen AG, Sankoh O, Myers MF, George DB, Jaenischt T, Wint GRW, Simmons CP, Scott TW, Farrar JJ, Hay SI 2013. The global distribution and burden of dengue. Nature 496: 504-507.
Cliff AD, Haggett P, Ord JK, Versey GR 1981. Spatial diffusion: an historical geography of epidemics in an island community, Cam-bridge University Press, CamCam-bridge, 238 pp.
da Rosa APT, Vasconcelos PF, da Rosa EST, Rodrigues SG, Mondet B, Cruz AC, Sousa MR, da Rosa JFT 2000. Dengue epidemic in Belém, Pará, Brazil, 1996-97. Emerg Infect Dis 6: 298-301.
Endy TP, Anderson KB, Nisalak A, Yoon I-K, Green S, Rothman AL 2011. Determinants of inapparent and symptomatic dengue infec-tion in a prospective study of primary school children in Kam-phaeng Phet, Thailand. PLoS Negl Trop Dis 5: e975.
Gatrell AC, Bailey TC 1996. Interactive spatial data analysis in medi-cal geography. Soc Sci Med 42: 843-855.
Guha-Sapir D, Schimmer B 2005. Dengue fever: new paradigms for a changing epidemiology. Emerg Themes Epidemiol 2: 1-10.
Haggett P 2000. The geographical structure of epidemics, Oxford University Press, Oxford, 149 pp.
Halstead S 2007. Dengue. Lancet 370: 1644-1652.
IBGE - Instituto Brasileiro de Geografia e Estatística 2014. Cidades@. Bahia. Jequié. Available from: cidades.ibge.gov.br/painel/painel. php?lang=&codmun=291800&search=bahia|jequie|infografico s:-dados-gerais-do-municipio.
Jeefoo P, Tripathi NK, Souris M 2010. Spatio-temporal diffusion pat-tern and hotspot detection of dengue in Chachoengsao province, Thailand. Int J Environ Res Public Health 8: 51-74.
Knox EG, Bartlett MS 1964. The detection of space-time interactions.
J R Stat Soc Ser C Appl Stat 13: 25-30.
Kulldorff M, Hjalmars 1999. The Knox method and other tests for space-time interaction. Biometrics 5: 544-552.
Kuno G 1995. Review of the factors modulating dengue transmission.
Epidemiol Rev 17: 321-335.
Levine N 2013. Hot spot analysis of zones. In N Levine, CrimeStat: Spatial Statistics Program for the Analysis of Crime Incident Locations, Version 4.0. Available from: ncjrs.gov/pdffiles1/nij/ grants/242960-242995.pdf.
Massad E, Coutinho F 2011. The cost of dengue control. Lancet 14: 1630-1631.
Medronho RA 2006. Dengue fever and the urban environment. Rev Bras Epidemiol 9: 159-161.
Melo MSS, Barreto FR, Costa MCN, Morato VC, Teixeira MG 2010. Progression of dengue virus circulation in the state of Bahia, Bra-zil, 1994-2000. Rev Soc Bras Med Trop 43: 139-144.
Mondini A, Chiaravalloti-Neto F 2008. Spatial correlation of incidence of dengue with socioeconomic, demographic and environmental variables in a Brazilian city. Sci Total Environ 393: 241-248.
A, Focks DA, Russell KL, Olson JO, Blair PJ, Watts DM, Sihuin-cha M, Scott TW, Kochel TJ 2010. Epidemiology of dengue virus in Iquitos, Peru 1999 to 2005: inter-epidemic and epidemic pat-terns of transmission. PLoS Negl Trop Dis 4: e670.
MS - Ministério da Saúde 2014. Casos de dengue. Brasil, grandes regiões e unidades federadas, 1990 a 2013. Available from: portalsaude.saude.gov.br/images/pdf/2014/julho/31/Dengue-classica-at---2013.pdf.
Ooi EE, Goh KT, Gubler DJ 2006. Dengue prevention and 35 years of vector control in Singapore. Emerg Infect Dis 12: 887-893.
San Martín JL, Brathwaite O, Zambrano B, Solórzano JO, Bouck-enooghe A, Dayan GH, Guzmán MG 2010. The epidemiology of dengue in the Americas over the last three decades: a worrisome reality. Am J Trop Med Hyg 82: 128-135.
SESAB/DIVEP - Secretaria de Saúde do Estado da Bahia/Diretoria de Vigilância Epidemiológica 2012. Situação epidemiológica da dengue. Boletim Epidemiológico da Dengue 3: 2.
Siqueira Jr JB, Vinhal LC, Said RFC, Leônidas J 2010. Dengue no Brasil: tendências e mudanças na epidemiologia com ênfase nas epidemias de 2008 e 2010. Available from: portal.saude.gov.br/ portal/arquivos /pdf/cap_7_saude_brasil _2010.pdf.
Teixeira MG, Barreto ML, Costa MCN, Ferreira LDA, Vasconcelos PFC,
Cairncross S 2002. Dynamics of dengue virus circulation: a silent epidemic in a complex urban area. Trop Med Int Health 7: 757-762.
Teixeira MG, Barreto ML, Guerra Z 1999. Epidemiology and preven-tive measures of dengue. Inf Epidemiol SUS 8: 5-33.
Teixeira MG, Costa MCN, Barreto FR, Barreto ML 2009. Dengue: twenty-five years since reemergence in Brazil (dengue: vinte e cinco anos da reemergência no Brasil). Cad Saude Publica 25
(Suppl. 1): 7-18.
Toan DTT, Hu W, Thai PQ, Hoat LN, Wright P, Martens P 2013. Hot spot detection and spatio-temporal dispersion of dengue fever in Hanoi, Vietnam. Glob Health Action 6: 18632.
Van-Benthem BHB, Vanwambeke SO, Khantikul N, Burghoorn-Maas C, Panart K, Oskam L, Lambin EF, Somboon P 2005.Spatial pat-terns and risk factors for seropositivity for dengue infection. Am J Trop Med Hyg 72: 201-208.
WHO - World Health Organization 1997. Dengue haemorrhagic fe-ver: diagnosis, treatment, prevention and control, 2nd ed., WHO, Geneva, 84 pp.
WHO - World Health Organization 2013. Global health atlas. Avail-able from: apps.who.int/globalatlas/DataQuery/default.asp.

![Fig. 3: spatial distribution of notified cases of dengue per census tract, Jequié, state of Bahia, Brazil, 2008 [from epidemiological week 47 (source: SESAB/DIVEP 2012)]-2009.](https://thumb-eu.123doks.com/thumbv2/123dok_br/16057132.696406/3.892.449.784.786.1058/spatial-distribution-notified-dengue-census-jequié-brazil-epidemiological.webp)