http://www.uem.br/acta ISSN printed: 1679-9275 ISSN on-line: 1807-8621
Doi: 10.4025/actasciagron.v35i1.14955
Comparison of tests for the analysis of vigor and viability in
soybean seeds and their relationship to field emergence
Márcia Santorum1, Lúcia Helena Pereira Nóbrega1*, Eduardo Godoy de Souza1, Diego dos Santos2, Walter Boller3 and Márcia Maria Mauli1
1
Programa de Pós-graduação em Engenharia Agrícola, Universidade Estadual do Oeste do Paraná, Rua Universitária, 2069, 85819-110, Jardim Universitário, Cascavel, Paraná, Brazil. 2Universidade Federal da Fronteira Sul, Campus Avançado da Unioeste, Escola Municipal Padre Gerson Calvino, Laranjeiras do Sul, Paraná, Brazil. 3Universidade de Passo Fundo, São José, Passo Fundo, Rio Grande do Sul, Brazil.
ABSTRACT. The objective of this study was to compare tests used to identify vigor in soybean seeds and to establish a model that relates the seeds’ vigor, as determined in the laboratory, with field emergence. Five soybean cultivars were evaluated based on their germination, sand emergence, immersion in sodium hypochlorite, accelerated aging, controlled deterioration, cold test, seedling growth, electrical conductivity, tetrazolium, emergence percentage, seedling length in the field and seedling dry weight. The experimental design was completely randomized and means were compared by the Tukey test at 5% probability. Assays for accelerated aging, controlled deterioration and tetrazolium showed the closest correlation to field emergence.The regression model included the sand emergence speed, germination speed index and index of sand emergence speed as the variables that best correlated with field emergence.
Keywords: germination, seeds quality, regression model.
Comparação de testes para análise de vigor em sementes de soja e sua relação com a
emergência em campo
RESUMO. O objetivo deste trabalho foi comparar testes utilizados para indicar o vigor de sementes de soja, e estabelecer um modelo que relacione os testes de vigor propostos até o momento com a emergência das plântulas em campo. Foram utilizadas cinco cultivares de soja as quais foram submetidas aos seguintes testes de vigor: germinação, emergência em areia, hipoclorito de sódio, envelhecimento acelerado, deterioração controlada, teste de frio, crescimento de plântulas (comprimento da plântula e peso de matéria seca da plântula), condutividade elétrica, tetrazólio, porcentagem de emergência e comprimento das plântulas no campo e massa seca de plântula. O delineamento experimental utilizado foi o inteiramente casualizado com quatro repetições e as médias foram comparadas pelo teste de Tukey a 5% de probabilidade. Concluiu-se que os testes de envelhecimento acelerado, deterioração controlada e tetrazólio demonstraram mais eficiência quanto a distinguir a diferença de vigor entre as cultivares. O modelo de regressão contemplou a velocidade de emergência em areia, o índice de velocidade de germinação (IVG) e o índice de velocidade de emergência em areia, como as variáveis que melhor se relacionam com a emergência em campo.
Palavras-chave: germinação, qualidade de sementes, modelo de regressão.
Introduction
For those involved in the production of crops, stand establishment is the first real opportunity for a practical evaluation of the quality of the seeds produced and the effect of the procedures used at the time of sowing (MARCOS FILHO, 2005).
Every seed has genetic, physical, physiological and health quality attributes that guarantee good agronomic performance and are critical to the success of a crop (KRZYZANOWSKI et al., 2008).
The germination test is widely used for assessing the quality of seeds, but often shows no correlation
with field emergence. Due to this inadequacy, the concept of vigor was introduced and new tests for evaluating it were devised (SCHUAB et al., 2002). However, not all clearly represent the field emergence, thus making it necessary to evaluate them in a way that would reflect the development of the seeds in the field through laboratory tests.
The ability to obtain results quickly has many advantages in various sectors of seed production, especially in pre-harvest, reception and processing stages, allowing quick decision making (DIAS; MARCOS FILHO, 1995).
A seed’s physiological quality is an important component considered by producers, because the use of an appropriate methodology can estimate the vigor, predicting the seed’s performance in the field and the need to dispose of lots, reducing risks and losses and improving competition in the market. In this situation, there is an increasing need for methods to quickly and efficiently assess the physiological quality of seeds and, thus, enable decisions to be made regarding the collection, processing, storage and marketing of the crop (BARROS; MARCOS FILHO, 1997; PINTO et al., 2007).
In this context, this study aimed to compare the tests used to identify the vigor of soybean seeds, define the most efficient method, and, after comparing the various tests, identify those that can correlate a seed’s vigor as determined in the laboratory with field emergence conditions in both conventional and transgenic soybean cultivars.
Material and methods
The work was performed at the Laboratory for Assessment of Seeds and Plants (LASP) at the Center for Exact Sciences and Technology (CCET), State University of West Paraná (UNIOESTE), Cascavel campus, and in field at the Cooperative Agricultural Research Center (COODETEC), located in BR 467 - km 98, in the city of Cascavel, Paraná State. The five soybean cultivars that were used (CD 208, CD 214RR, CD 215, CD 216 and CD 233RR) were mechanically harvested with a John Deere 1175 SLC harvester with a 16-foot platform, about 4 to 5 km h-1 harvest speed, 500 to 600 rpm cylinder rotation
and a concave opening with 30 mm in front and 20 mm behind. They were produced in the 2008/2009 agricultural year at the COODETEC. All had different morphological characteristics. Seeds were collected with 12.5% (CD 208), 13.5% (RR CD 214), 14.5% (CD 215 and CD 216) and 11.5% (RR CD 233) water content. The seeds had the following water amounts upon laboratory arrival: 11.8% (CD 208), 12.2% (RR CD 214), 14.5% (CD 215), 11.3% (CD 216) and 10.0% (RR CD 233).
The determination of water content was carried out only in order to find out possible interference with the results; therefore, no statistical mean comparison was made among cultivars. According to França Neto et al. (2007), water content can affect
the occurrence of immediate mechanical damage and latent damage at the harvest, among other considerations. This may also occur during reception and drying. Thus, the seeds used for testing in this work with water contents of approximately 12.5% when measured during the harvest, as in case of cultivars CD 214RR, CD 215 and CD 216, could be dried. However, when the seeds arrived in the laboratory, the only cultivar with water content above the recommended level was CD 215 (14.5%).
Until the tests for viability and vigor were performed, the seeds remained wrapped in Kraft paper bags and were stored in laboratory room conditions.
The seeds were sorted through sieves from 5 to 8 mm in diameter at the Seed Analysis Laboratory of COODETEC. The diameters correspond to the highest percentage of seeds retained in the sieve; CD 233RR were 5 mm in diameter, CD 208 and CD 214RR were 6 mm in diameter and CD 215 and CD 216 were 6.5 mm in diameter.
Tests performed in the laboratory for seed quality included the following:
Water content: Approximately 5 g of seeds of each cultivar were weighed and two replicates were placed in the oven at 105 ± 3°C for 24h; results are expressed as percentages (BRASIL, 2009).
Germination: Fifty seeds were sown on two sheets of "germitest" paper, covered by a third sheet and rolled. The paper was moistened with a volume of distilled water equivalent to 2.5 times its mass, and the rollers stayed in the germinator at 25ºC and a relative humidity of approximately 100%. A count of seedling was performed daily from the 5 to the 8th day after sowing (last count), and the results are expressed as percentages. Using the germination test, the germination speed index (GSI) (MAGUIRE, 1962), germination speed (GS) (EDMOND; DRAPALLA, 1958) and coefficient of germination speed (CGS) (FURBECK et al., 1993) were evaluated. The GSI was determined from the 4th day of sowing based on normal seedlings with
shoots of approximately 2 cm. Seedlings that were counted in the germinator remained until the final count (8th day after sowing).
DRAPALLA, 1958) and the coefficient of sand emergence speed (CSES) (FURBECK et al., 1993) were determined.
Sodium hypochlorite:To determine the vigor of the seeds, four samples of 100 apparently intact seeds were used. They were placed in plastic cups and covered with sodium hypochlorite solution (5.25%) for 10 minutes. After the immersion, the seeds were removed and examined for intact and damaged seeds (swollen). Results are expressed as percentages (KRZYZANOWSKI et al., 2004).
Accelerated aging: Forty-two grams of seeds were placed on a gerbox with a screen tray and 40 mL distilled water at the bottom. They were taken to the aging chamber, which was set at 41°C and 95-100% relative humidity for 48h. After this period, seeds were submitted to the between-paper germination test for eight days (MARCOS FILHO, 1992).
Seedling growth in the laboratory: A methodology similar to the germination test was used. Ten seeds of each cultivar with four replications were sown on a line in the upper third of the substrate paper, distributed so as to direct the tip of the radicle downward, and taken to the germinator at 25ºC. After eight days, the roots and shoots of the seedlings were measured (NAKAGAWA, 1999).
Dry mass of seedling growth: Normal seedlings were used in the seedling growth test in the laboratory. Cotyledons were removed from seedlings, which were placed in paper bags, separated by repetition and then dried in an oven at 60°C for 24h, following the methodology of Krzyzanowski et al. (1999). Afterward, samples were taken and cooled in a desiccator, then weighed on a scale with 0.001 g precision, and the total dry matter of the component seedlings was determined. This measurement gave the dry mass per seedling, expressed as mg seedling-1.
Electrical conductivity: Samples of 50 seeds of each cultivar in four replications were weighed and soaked in deionized water for 24h at 25°C. After soaking, samples were shaken slightly, one by one, before the conductivity reading. The value obtained was divided by the mass of the 50 seeds and results were expressed as mmhos cm-1 g-1 (LOEFFLER
et al., 1988).
Tetrazolium: 100 seeds were used in two replicates of 50 seeds. They were wrapped in moist paper towels and incubated at 25°C for 16-20 hours. After preconditioning, they were placed in Petri dishes, completely submerged in tetrazolium solution and remained there for 180 min. at 35-40°C in the dark. After the immersion, the seeds were
washed in water and kept submerged in distilled water inside the refrigerator until they were assayed. Normal seedlings were counted, and the results are expressed as percentages. The seeds were evaluated one by one, noting each occurrence of damage (FRANÇA NETO et al., 1998).
Controlled deterioration: The water content of the seeds of the five cultivars in four replications was set to a value of at least 15.5%. The seeds were then wrapped in aluminum foil and placed in a plastic envelope, allowing no ingression of water, and kept in a water bath at 40°C for 48h. The samples were then germinated. The percentage of normal seedlings is considered to be proportional to the seeds’ vigor (MARCOS FILHO et al., 2001).
Cold test: Four replications of 50 seeds of each cultivar were sown on two sheets of "germitest" paper, covered by a third sheet, rolled, and kept in plastic bags at 10°C for seven days. After this period, bags were opened and the rolls placed in a germinator at 25°C for four days and analyzed as in the germination test (BARROS et al., 1999). The results are expressed as a percentage of normal seedlings.
For field tests, in five cultivars in four replications were sown, using a tray provided by COODETEC, in order to sow 100 seeds per replicate with an approximate depth of 4 cm. The field testing environment was equipped with an oven, which was lowered during the night and erected during the day in attempt to maintain proper temperature for the soybean seedlings. Irrigation was performed every day for about 20 minutes until the soil was adequately moistened, i.e., the environment was controlled to simulate excellent field conditions for proper seed germination and seedling development.
The following parameters were evaluated:
Percentage of seedling emergence in the field:The count was performed once, 21 days after sowing, when seedlings had cotyledons that were completely open and differentiated primary leaves. The results are expressed as a percentage (NAKAGAWA, 1999);
Growth of seedlings: For the seedling height determination, 25 seedlings per replication from the field emergence test, chosen randomly, were used. After 21 days, the measurements were taken from shoots of the seedlings in the field (cm) from ground level to the tip of the stem (bud) (NAKAGAWA, 1999);
in a greenhouse at 60°C until they displayed a constant mass. This material was weighed on a 0.001 g precision scale. The mass obtained was divided by the total number of seedlings in the sample, thus constituting the average dry mass of the seedling shoot per cultivar (NAKAGAWA, 1999).
Based on the results of the field emergence test, the index of speed emergence in field (ISE) (MAGUIRE, 1962), speed of emergence in the field (SE) (EDMOND; DRAPALLA, 1958) and the coefficient of speed emergence in field (CSE) (FURBECK et al., 1993) were analyzed.
The experimental design for the laboratory and field tests was completely randomized with four replications for each cultivar. The results were submitted to analysis of variance, and the means were compared by the Tukey test at a 5% probability cutoff. Data that were expressed as percentage (germination test, accelerated aging, tetrazolium, and sand emergence) were transformed by
100
x
arcsen , and those without normality were
transformed by
x
as described by Banzatto andKronka (2006).
The model was adjusted as a function of the laboratory tests to obtain a regression model capable of explaining the field emergence using the indicator variables (Dummy) to represent the five cultivars, according to Werkema (1996). To do this, we used multiple linear regression, and the model was fit using the least squares method from the software Minitab 15.
Results and discussion
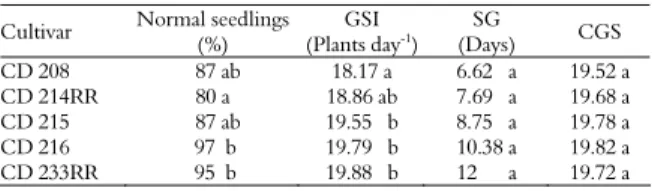
Table 1 presents the mean percentage of normal and abnormal seedlings and dead seeds, the germination speed index (GSI), germination speed (SG) and the coefficient of germination (CVG) for the germination test.
Table 1. Mean percentage of germination, germination speed index (GSI), germination speed (SG) in days and coefficient of germination speed (CGS), obtained by the germination test.
Cultivar Normal seedlings (%)
GSI (Plants day-1)
SG
(Days) CGS
CD 208 87 ab 18.17 a 6.62 a 19.52 a
CD 214RR 80 a 18.86 ab 7.69 a 19.68 a
CD 215 87 ab 19.55 b 8.75 a 19.78 a
CD 216 97 b 19.79 b 10.38 a 19.82 a
CD 233RR 95 b 19.88 b 12 a 19.72 a
Means followed by the same letter, lower case in column, do not differ based on the Tukey test at 5% probability. The data presented were obtained from original
observations, and the percentage results were transformed into arc sin , and
transformation for parameters without normality.
The percentage of normal seedlings obtained from cultivars CD 216 and CD 233RR were not
statistically different from cultivars CD 208 and CD 215, though they differed from CD 214RR. The average number of abnormal seedlings did not differ among cultivars.
Although they differ in the percentage of germination, cultivars analyzed in this work were above the required value (80%) to be used as seeds (SEAB, 1986; BRASIL, 2003). However, according to Baudet (2003), soybean seeds may lose quality during storage especially if the initial quality is low. Quality loss is caused by the deterioration process, which is inexorable and irreversible (DELOUCHE, 2002). One must also take into consideration the fact that the germination test is valid only for six months (SEAB, 1986).
Size did not influence seed germination and CD 233RR, which is smaller, had the second highest average percentage of normal seedlings. This data is in agreement with Carvalho and Nakagawa (2000), who reported that seed size does not influence germination.
The germination speed and the coefficient of germination speed did not differ among cultivars, but the average index of germination speed was the best for CD 215, CD 216 and CD 233RR, though they were not statistically different from the others. According to Nakagawa (1994), seed lots with similar germination percentages showed different germination speeds. Those with higher speeds are more vigorous than others. In tests for germination speed, only the GSI was different among cultivars, and the most vigorous seeds were from the CD 215, CD 216 and CD 233RR cultivars.
The higher the GSI value obtained, the higher the germination speed and the greater the lot vigor (MAGUIRE, 1962). Therefore, cultivars CD 215, CD 216 and CD 233RR had greater vigor. According to Nakagawa (1999), there is a direct relationship between the germination speed and the seed vigor; therefore, seeds that germinated in a shorter period of time have a higher vigor index.
Seeds with a higher germination speed offer advantages over others in their water use and response to light and nutrients; they start the photosynthetic process earlier and have better shoot and root growth (SCHUCH et al., 2000). Thus, cultivars CD 215, CD 216 and CD233RR would stand out based on advantages in competition for environmental resources and would also have a greater uniformity of plants.
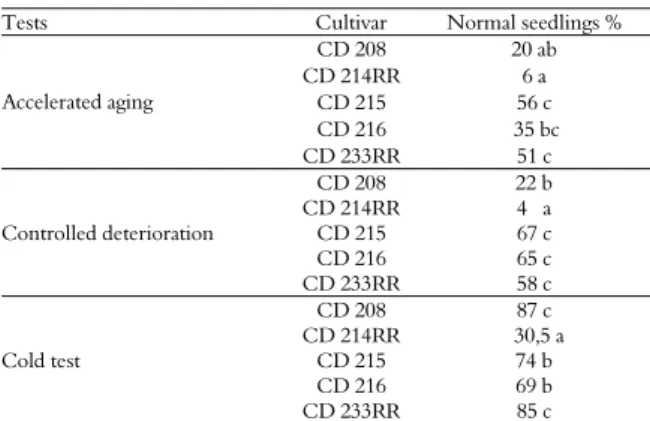
smallest, CD 233RR, followed by the largest, CD 215 and CD 216, though it was not statistically different among the cultivars. The SG showed no difference among cultivars of different seeds sizes. Table 2 presents the mean percentage of the normal seedlings for the accelerated aging test, controlled deterioration and cold test.
Table 2. Mean percentage of normal seedlings, evaluated by the accelerated aging test and mean percentage of normal taken from the controlled deterioration test and cold test.
Tests Cultivar Normal seedlings %
CD 208 20 ab
CD 214RR 6 a
CD 215 56 c
CD 216 35 bc
Accelerated aging
CD 233RR 51 c
CD 208 22 b
CD 214RR 4 a
Controlled deterioration CD 215 67 c
CD 216 65 c
CD 233RR 58 c
CD 208 87 c
CD 214RR 30,5 a
Cold test CD 215 74 b
CD 216 69 b
CD 233RR 85 c
Means followed by the same letter, lower case in column, do not differ by the Tukey test at 5% probability. Data presented were obtained from original observations, followed by letters obtained from means comparison in percentage transformed into arc
sen .
The results of the accelerated aging test showed that the mean variable percentage of normal seedlings for cultivars CD 215, CD 216 and CD 233RR was higher than the others; however, cultivar CD 216 did not differ significantly from CD 208. The cultivar with the lowest percentage of normal seedlings was CD 214RR. In overall context, cultivars CD 215, CD 216 and CD 233RR were most vigorous in relation to CD 208 and CD 214RR. Dutra and Vieira (2004), using the accelerated aging test as a vigor test for soybeans, obtained satisfactory results for determining the difference in vigor among lots, in agreement with this work.
The accelerated aging test showed that the most vigorous cultivars are CD 215 and CD 233RR, followed by the CD 216; it also revealed cultivars with intermediary vigor such as CD 208 and less vigorous cultivars such as CD 214RR. Marcos Filho et al. (2001) could differentiate between lots of soybean cultivars with high, intermediate and low vigor from this test.
Beckert et al. (2000) observed that the speed of water absorption is inversely proportional to the size of soybean seeds. The smaller seeds showed more intense water absorption. However, among the three seed sizes they examined, those of average size showed higher physiological potential, i.e., were more vigorous, unlike the results of this study, in which the smallest,
CD 213RR, and the largest, CD 215 and CD 216, were the cultivars with greater physiological potential. Marcos Filho et al. (2000) reported that the difference in seed size affects the efficiency of the accelerated aging test, given that smaller seeds capture water faster compared to the larger ones; therefore it could distort test results. In this study, CD 233RR is smaller than the others, while CD 215 and CD 216 are larger. However, all three cultivars had high vigor levels, showing that seed size apparently had no influence on the outcome of the test.
According to Marcos Filho (1992), seed germination can be explained by the seeds’ capacity to develop properly when subjected to diverse environmental conditions such as temperature stress and moisture. Thus, under this assumption, cultivars CD 215, CD 216 and CD 233RR would have better field performance under unfavorable conditions.
After assessing the effect of the controlled deterioration test on the seeds, the highest mean percentage of normal seedlings was presented by CD 215, CD 216 and CD 233RR, followed by CD 208, which was significantly different from the preceding three, followed by CD 214RR, which significantly differed from the others. By analyzing the germination test (Table 2) combined with the deterioration test, CD 214RR, followed by CD 208, exhibited the worst performance. The controlled deterioration test is based on the seeds’ resistance to stress by exposure to high heat and humidity; thus, according to Marcos Filho et al. (2001), the percentage of normal seedlings is proportional to the vigor of seeds. Cultivars CD 215, CD 216 and CD 233RR were more vigorous when compared to the other two cultivars, and CD 208 was inferior to those three but more vigorous than CD 214RR.
Marcos Filho et al. (2001) observed that the controlled deterioration test was able to discriminate physiological differences among lots in the same way that the accelerated aging test did. Therefore, the deterioration test is as efficient as the accelerated aging test in the evaluation of the vigor of soybean seeds, which was also observed in this study. However, in agreement with Rosseto and Marcos Filho (1995), the accelerated aging test was more stringent than the controlled deterioration test.
The results from the cold test presented in Table 2 showed a higher percentage of normal seedlings in CD 208 and CD 233RR, which were significantly different from CD 214RR, CD 215 and CD 216. CD 215 and CD 216 were also different form CD 214RR. In sum, CD 208 and CD 233RR showed greater vigor than the other cultivars.
although this cultivar showed high vigor in the cold test. Some tests have greater sensitivity for seed vigor determination, such as the accelerated aging test, which seems to be more sensitive than the deterioration test, which itself is more sensitive than the cold test. Still, one must take into account the issue of temperature sensitivity; in this case, CD 208 would be more vigorous because it showed greater cold resistance.
Table 3 shows the mean percentage of seedlings emerged, the emergence speed index (SESI), emergence speed (SES) and the coefficient of emergence speed (SCES) in the test for sand emergence.
Table 3. Means in percentage of seedling emergence, emergence speed index (SESI), germination speed (SES) and coefficient of germination speed (SCES) obtained in the test for sand emergence.
Cultivar Emergence (%) (SESI)
(Plants day-1)
(SES)
(Days) (SCES)
CD 208 86 b 16.68 b 5.30 b 18.92 a
CD 214RR 75 a 13.77 a 5.55 b 18.01 a
CD 215 84 b 19.29 c 4.80 a 20.82 b
CD 216 96 c 20.21 cd 4.82 a 20.74 b
CD 233RR 97 c 21.79 d 4.55 a 21.98 b
Means followed by the same letter, lower case in column, do not differ by the Tukey test at 5% probability. Data presented were obtained from original observations, followed by letters obtained from means comparison and results in percentage transformed into arc sin and transformation for parameters without normality.
In the test for sand emergence (Table 3), CD 216 and CD 233RR stood out for the highest number of emerged seedlings. Their SESI, SES and SCES values were statistically superior to those from CD 215, CD 216 and CD 233RR.
According to Nakagawa (1999), there is a direct relationship between the SESI and seed vigor, such that the seed that emerges in the shortest period of time has the highest vigor. Fleck et al. (2002), in agreement with Nakagawa (1999), emphasized that seedlings with rapid emergence and uniform appearance can compete more effectively for environmental resources.
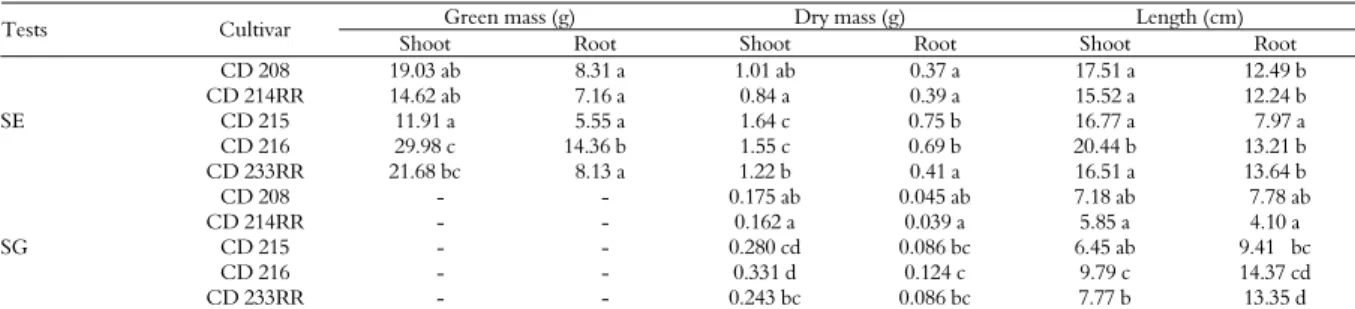
Table 4 shows the mean values of green mass, dry mass and lengths of the shoots and roots of soybean seedlings subjected to the test for sand emergence.
Based on the test results for sand emergence (Table 4), the green mass of shoots was highest for
CD 216, which did not differ from CD 233RR, CD208 or CD 214RR. For the root green mass, CD 216 had the highest mean, which was significantly different from all the others.
For the dry mass of shoot and root, cultivars CD 215 and CD 216 had the highest means, which were significantly different from the other cultivars.
According to Nakagawa (1999), cultivars with a higher dry mass are considered to be more vigorous, transferring a greater amount of dry matter from the reserve tissues to the embryonic axis during seed germination. Thus, seedlings with greater mass originate from greater plant matter accumulation. If the more vigorous seeds are under unfavorable environmental conditions, they will have greater ability to emerge as seedlings with good initial development and consequently achieve greater translocation and accumulation of dry matter (NAKAGAWA, 1994).
Analyzing the shoot length, CD 216 had the highest mean, which was significantly different from that of the other cultivars. CD 215 was also statistically different from the others, having the lowest mean root length.
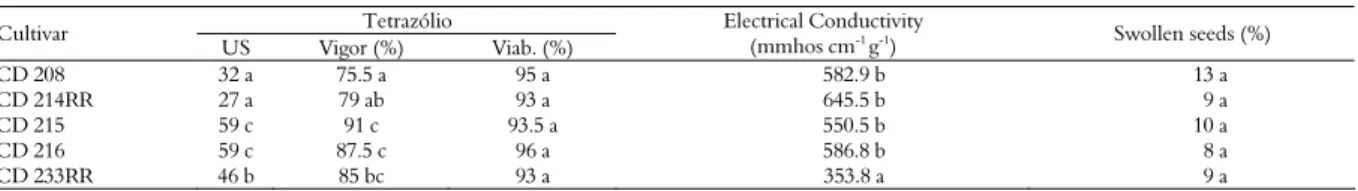
Table 5 shows the mean percentage of undamaged seeds (US), the vigor and viability of soybean seeds obtained from the tetrazolium test and the electrical conductivity and percentage of swollen seeds in the sodium hypochlorite test.
Analyzing the percentage of seeds undamaged seeds, CD 215 and CD 216 have statistically relevant higher means than the others, followed by CD 233RR, which was statistically different from CD 208 and CD 214RR. The cultivar with the highest average percentage of vigor was CD 215, but it was not significantly different from CD 216 and CD 233RR. The lowest average percentage of vigor was presented by CD 208 and CD 215. There was no statistical difference in viability. Overall, cultivars with lower amounts of damage had greater vigor, which was expected.
Table 4. Mean green mass of shoot and root obtained by the test for sand emergence, dry mass of shoot and root and lengths of shoot and root of soybean seedlings obtained in the test for sand emergence (SE) and seedling growth (SG).
Green mass (g) Dry mass (g) Length (cm)
Tests Cultivar
Shoot Root Shoot Root Shoot Root
CD 208 19.03 ab 8.31 a 1.01 ab 0.37 a 17.51 a 12.49 b
CD 214RR 14.62 ab 7.16 a 0.84 a 0.39 a 15.52 a 12.24 b
SE CD 215 11.91 a 5.55 a 1.64 c 0.75 b 16.77 a 7.97 a
CD 216 29.98 c 14.36 b 1.55 c 0.69 b 20.44 b 13.21 b
CD 233RR 21.68 bc 8.13 a 1.22 b 0.41 a 16.51 a 13.64 b
CD 208 - - 0.175 ab 0.045 ab 7.18 ab 7.78 ab
CD 214RR - - 0.162 a 0.039 a 5.85 a 4.10 a
SG CD 215 - - 0.280 cd 0.086 bc 6.45 ab 9.41 bc
CD 216 - - 0.331 d 0.124 c 9.79 c 14.37 cd
CD 233RR - - 0.243 bc 0.086 bc 7.77 b 13.35 d
Means followed by same letter in column do not differ by the Tukey test at 5% probability. Data presented were obtained from original observations, followed by letters found in
According to França Neto et al. (1999), vigor level is classified as very high for values greater than or equal to 85%, high for values between 84 and 75%, medium for values between 74 and 60%, low for values between 59 and 50 % and very low for values below 49%. Thus, CD 208 and CD 214RR can be classified as seeds with high vigor and CD 215, CD 216 and CD 233RR as seeds with very high vigor.
In seed production fields, desirable vigor levels are above 90 and 95%; however, this level may vary according to the quality requirement of each seed producer company (FRANÇA NETO et al., 2007; KRZYZANOWSKI et al., 2008). Based on this principle, only CD 215 would be acceptable as a high quality seed.
In comparing the vigor levels of the tetrazolium test to the results of the other tests, CD 215, CD 216 and CD 233RR, which had higher vigor levels, showed better results in most tests performed.
In the electrical conductivity test, only CD 233RR differed from the others; it had the lowest mean conductivity. Perhaps this is due to having the lowest mean for mechanical damage observed in the tetrazolium test; thus, the coat is less damaged, preventing the leaching of substances. Lower electrical conductivity supposedly indicates higher vigor.
Custódio (2005) concluded that tests based on membrane permeability are important for the verification of seed quality, because the decrease in germination and vigor are directly proportional to the increase of the leachate solutes. Thus, the electrical conductivity method is sufficient to evaluate seed vigor. In contrast to that report, CD 233RR had the lowest average of leachate, differing from other cultivars, and when analyzing most other tests, this cultivar stands out for its vigor. However, CD 215 and CD 216 also showed good performance in most tests, but had a high average leachate in the electrical conductivity test. CD 214RR, which is the least vigorous cultivar, showed electrical conductivity similar to the seeds with the highest vigor.
Vieira et al. (2002) evaluated the effect of initial water content on the results of electrical
conductivity of soybean seeds and observed that in three vigor levels, there was a reduction in the electrical conductivity as the water content increased from 7 to 17%. Within the highest vigor level, there were minor variations in the results for electrical conductivity, which increased with the reduction in vigor. In contrast, in this study we observed that the seeds with the lowest water content, from cultivar CD 233RR, showed the lowest electrical conductivity. Still, other cultivars with different water content, such as CD 215, with a 14.6% water content, and CD 216, with 11.3% water content, showed no statistical difference, thus disagreeing with Vieira et al. (2002).
Analyzing the test results from the sodium hypochlorite test, the cultivars did not differ significantly in the percentage of swollen seeds. However, CD 208 had 13% swollen seeds and is therefore not recommended for use as a seed. According to Krzyzanowski et al. (2004), if the rate of damage in the sodium hypochlorite test exceeds 10%, use as a seed is not recommended.
According to Krzyzanowski et al. (2008), 10% swollen seeds resulting from the hypochlorite test correspond to about 75% vigor by the tetrazolium test. Although not required, this value is the minimum accepted among producers for seeds being marketed. In contrast with this report, our study shows that CD 215, with 10% swollen seeds, had 91% vigor in the tetrazolium test. Thirteen percent of the CD 208 cultivar seeds were swollen in the hypochlorite test, but 75.5% had vigor of the tetrazolium test. Thus, this cultivar could still be sold if analyzed by the tetrazolium test; however, if only the hypochlorite test is performed, this cultivar would probably be rejected.
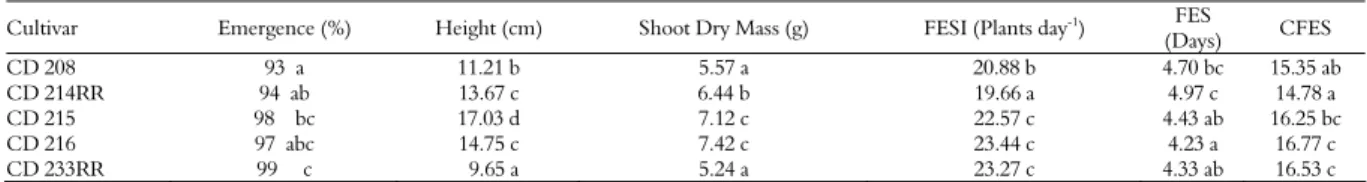
Table 6 shows the average percentage of field emergence, seedling height, shoot dry mass, field emergence speed index (FESI), field emergence speed (FES) and coefficient of field emergence speed (CFES) obtained from the test for field emergence.
Table 5. Average percentage of seeds undamaged seeds (US), vigor and viability (viab.) obtained by the tetrazolium test, electrical conductivity and percentage of swollen seeds in the sodium hypochlorite test.
Tetrazólio Cultivar
US Vigor (%) Viab. (%)
Electrical Conductivity
(mmhos cm-1 g-1) Swollen seeds (%)
CD 208 32 a 75.5 a 95 a 582.9 b 13 a
CD 214RR 27 a 79 ab 93 a 645.5 b 9 a
CD 215 59 c 91 c 93.5 a 550.5 b 10 a
CD 216 59 c 87.5 c 96 a 586.8 b 8 a
CD 233RR 46 b 85 bc 93 a 353.8 a 9 a
Means followed by the same letter, lower case in column, do not differ by the Tukey test at 5% probability. Data presented were obtained from original observations, followed by letters
Table 6. Mean percentage of field emergence, seedling height, seedling dry mass, field emergence speed index (FESI), field emergence speed (FES) and coefficient of field emergence speed (CFES) obtained from the test for field emergence of soybean seeds.
Cultivar Emergence (%) Height (cm) Shoot Dry Mass (g) FESI (Plants day-1) FES
(Days) CFES
CD 208 93 a 11.21 b 5.57 a 20.88 b 4.70 bc 15.35 ab
CD 214RR 94 ab 13.67 c 6.44 b 19.66 a 4.97 c 14.78 a
CD 215 98 bc 17.03 d 7.12 c 22.57 c 4.43 ab 16.25 bc
CD 216 97 abc 14.75 c 7.42 c 23.44 c 4.23 a 16.77 c
CD 233RR 99 c 9.65 a 5.24 a 23.27 c 4.33 ab 16.53 c
Means followed by the same letter, lower case in column, do not differ by the Tukey test at 5% probability. Data presented were obtained from original observations, followed by letters
obtained from means comparison and results in percentage transformed into arc sin and transformation for parameters without normality.
When evaluating the emergence in the field in comparison with the other tests, cultivars CD 215, CD 216 and CD 233RR showed better performance in almost all tests in addition to field emergence and are therefore considered to be the most vigorous. In the test for sand emergence, CD 233RR had lower height and lower seedling dry mass, which can be explained by its smaller seed size; however, when subjected to stress tests, such as accelerated aging and controlled deterioration, it showed good results.
Cultivars CD 215, CD 216 and CD 233RR had the highest indices of FESI, as well as the highest CFES. The FES showed that these cultivars took less time to emerge.
Considering the relationship between emergence speed and seed vigor, according to Nakagawa (1999), CD 215, CD 216 and CD 233RR had both the greatest vigor and the highest averages of emergence. These cultivars, which have faster and more uniform emergence, could compete for environmental resources such as water, light, nutrients, and would stand out from the other cultivars, in agreement with Fleck et al. (2003) and Flores et al. (2002). Because they are more vigorous plants, they would become large plants in a shorter period of time compared to other cultivars.
Einhellig (1996) stated that due to the interaction of microorganism with seeds in the soil, unlike laboratory conditions where this does not occur, there are often different FESI values in relation to IVG. In this study, there was no difference between the FESI and GSI, either in the laboratory or in the field. Regardless of the condition, the same cultivars, CD 215, CD 216 and CD 233RR, stood out with higher averages.
Vanzolini and Carvalho (2002) obtained higher IVE for high-vigor seeds, medium for medium-vigor seeds and low for low-medium-vigor seeds, statistically separating each vigor level. In this work, when correlating the FESI with other tests, CD 215, CD 216 and CD 233RR had higher FES and stood out with better results in most tests in the laboratory. They also showed the highest means for field emergence.
When analyzing the shoot dry mass and the height of seedlings in field, the cultivars that stood out were those with larger seed sizes. CD 233RR was statistically classified as inferior; however, when analyzing the seed size, it was the smallest compared to the others. Table 7 shows the models fit by the least squares method correlating emergence in the field to the tests for vigor and viability evaluation (tetrazolium for vigor, mechanical damage 1-8 and mechanical damage 6-8; germination speed index, germination speed, coefficient of germination speed, sand emergence speed index, sand emergence speed and coefficient of sand emergence speed, electrical conductivity, controlled deterioration and cold test), viability (germination percentage, tetrazolium for viability and sand emergence) and seedling growth (shoot height, root length, shoot dry matter and root dry matter).
Table 7. Models adjusted by least squares for field emergence as a function of the test for vigor assessment and its respective R2.
Parameter Model Coefficient of
Determination (R2
) Vigor FE = 111 – 10.3 SES + 13.11
GSI –1.24 SESI
81.7 %
FE = field emergence; SES = sand emergence speed; GSI = germination speed index; SESI = sand emergence speed index.
The fitted model for vigor was independent of the cultivar used. FE decreased by 10.3% for each unit increase of emergence speed in sand with a constant speed germination index and index of emergence speed in sand. Similarly, the field emergence increased by 13.11% for each unit increase in the germination speed index with a constant speed of emergence in sand. Field emergence decreases by 1.24% for each unit increase of speed of emergence in sand with a constant speed of emergence in sand and a constant speed of germination index.
The explanation given by the models suggests that the dependent variable (FE) was responsible for 81.7% of the variables accounting for vigor.
relevant to the evaluation of seed vigor, showing better correlation with field emergence. This agrees with Nakagawa (1999), who noted that cultivars with similar germination percentages may differ by the GSI test. According to Maguire (1962), the higher the GSI value, the greater the germination speed and therefore the greater the lot vigor. Similarly, the higher the SGI and emergence speed, the lower the vigor. As foremergence speed in sand, according to Edmond and Drapalla (1958), the lower the value, the higher the seed vigor.
Conclusion
In the conditions in which this experiment was performed, we conclude that the accelerated aging, controlled deterioration and tetrazolium tests were more effective in distinguishing vigor among cultivars. Moreover, the tetrazolium test is one of the fastest tests to evaluate seeds.
From the adjusted regression model (R2 =
81.7%), we conclude that the rate of speed of emergence in sand, the germination speed index and the emergence speed in sand are the tests that correlate best with field emergence.
References
BARROS, A. S. R.; DIAS, M. C. L. L.; CÍCERO, S. M.; KRZYZAZOWSKI, F. C. Teste de frio. In: KRZYZANOWSKI, F. C.; VIEIRA, R. D.; FRANÇA NETO, J. B. (Ed.). Vigor de sementes: conceitos e testes. Comitê de Vigor de Sementes. Londrina: Abrates, 1999. Cap. 5, p. 1-15.
BARROS, A. S. R.; MARCOS FILHO, J. Testes para avaliação rápida do vigor de sementes de soja. Revista Brasileira de Sementes, v. 19, n. 2, p. 288-294, 1997. BAUDET, L. M. L. Armazenamento de sementes. In: PESKE, S. T.; ROSENTHAL, M. D.' A.; ROTA, G. R. M. (Ed.). Sementes: ciência e tecnologia. Pelotas: Edufpel, 2003. p. 545.
BECKERT, O. P.; MIGUEL, M. H.; MARCOS FILHO, J. Absorção de água e potencial fisiológico em sementes de soja de diferentes tamanhos. Scientia Agricola, v. 57, n. 4, p. 671-675, 2000.
BRASIL. Congresso Nacional. Lei nº 10.711, de 05 de agosto de 2003. Dispõe sobre o sistema nacional de sementes e mudas e dá outras providências. Brasília, 2003. BRASIL. Ministério da Agricultura e Reforma Agrária.
Regras para análise de sementes. Brasília: SNDA/ DNDV/ CLAV, 2009.
CARVALHO, N. M.; NAKAGAWA, J. Sementes:
ciência, tecnologia e produção. 4. ed. Jaboticabal: Funep, 2000.
CUSTÓDIO, C. C. Testes rápidos para avaliação do vigor de sementes: uma revisão. Colloquium Agrarie, v. 1, n. 1, p. 29-45, 2005.
DELOUCHE, J. C. Germinação, deterioração e vigor da semente. Reportagem de capa. Revista Seed News, v. 6, n. 6, p. 1, 2002.
DIAS, D. C. F. S.; MARCOS FILHO, J. Testes de vigor baseados na permeabilidade das membranas celulares: I. Condutividade elétrica. Informativo Abrates, v. 5, n. 1, p. 26-41, 1995.
DUTRA, A. S.; VIEIRA, R. D. Envelhecimento acelerado como teste de vigor para sementes de milho e soja.
Ciência Rural, v. 34, n. 3, 2004.
EDMOND, J. B.; DRAPALLA, W. J. The effects of temperature, sana and soil, and acetone on germination oj okra seed. Proceedings of the American Society for Horticuticultural Science, v. 71, n. 2, p. 428-443, 1958. EINHELLIG, F. A. Interactions involving allelopathy in cropping systems. Agronomy Journal, v. 88, n. 6, p. 886-893, 1996.
FLECK, N. G.; RIZZARDI, M. A.; VIDAL, R. A.; MEROTO JÚNIOR, A.; AGOSTINETTO, D.; BALBINOT JÚNIOR, A. A. Período crítico para controle de Brachiaria plantaginea em função de épocas de semeadura da soja após dessecação da cobertura vegetal. Planta Daninha, v. 20, n. 1, p. 53-62, 2002.
FLORES, I. F.; PASSAMANI, S.; BONOW, R. N.; LEMOS, C. A. Tratamento de sementes com ácido giberélico e crescimento de plântulas de arroz (Oryza sativa, L). Revista da Faculdade de Zootecnia, Veterinária e Agronomia, v. 9, n. 1, p. 73-78, 2002. FRANÇA NETO, J. B.; KRZYZANOWSKI, F. C.; PÁDUA, G. P.; COSTA, N. P.; HENNING, A. A.
Tecnologia da produção de semente de soja de alta qualidade – Série Sementes. Londrina: Embrapa, 2007. FRANÇA NETO, J. B.; KRZYZANOWSKI, F. C.; COSTA, N. P. Metodologia do teste de tetrazólio em sementes de soja. In:KRZYZANOWSKIM, F. C.; VIEIRA, R. D.; FRANÇA NETO, J. B. (Ed.). Vigor de sementes: conceitos e testes. Londrina: Abrates, 1999. p. 1-26. (Cap. 8.5).
FRANÇA-NETO, J. B.; KRZYZANOWSKI, F. C.; COSTA, N. P. O teste de tetrazólio em sementes de soja. Londrina: Embrapa, 1998.
FURBECK, S. M.; BOURLAND, F. M.; WATSON JUNIOR, C. E. Relationships of seed and germination measurements with resistance to seed weathering in cotton. Seed Science and Technology, v. 21, n. 3, p. 505-512, 1993.
KRZYZANOWSKI, F. C.; FRANÇA NETO, J. B.; COSTA, N. P. Teste de hipoclorito de sódio para sementes de soja. Londrina: Embrapa, 2004.
KRZYZANOWSKI, F. C.; FRANÇA NETO, J. B.; HENNING, A. A.; COSTA, N. P. A semente de soja como tecnologia e base para altas produtividades – série sementes. Londrina: Embrapa, 2008.
KRZYZANOWSKI, F. C.; VIEIRA, R. D.; FRANÇA NETO, J. B. Vigor de sementes: conceitos e testes. Londrina: Abrates, 1999.
LOEFFLER, T. M.; TEKRONY, D. M.; EGLI, D. B. The bulk conductivity test as an indicator of soybean seed quality.
MAGUIRE, J. D. Speeds of germination-aid in selection and evaluation for seedling emergence and vigor. Crop Science, v. 2, n. 2, p. 176-177, 1962.
MARCOS FILHO, J. Fisiologia de sementes de
plantas cultivadas. Piracicaba: Fealq, 2005.
MARCOS FILHO, J. Teste de envelhecimento acelerado. In: VIEIRA, R. D.; SADER, R.; CARVALHO, N. M. (Coord.). Testes de vigor de sementes. Jaboticabal: Funep, 1992. p. 45-57.
MARCOS FILHO, J. Testes de vigor: importância e utilização. In: KRZYZANOWSKI, F. C.; VIEIRA, R. D.; FRANÇA NETO, J. B. (Ed.). Vigor de sementes: conceitos e testes. Londrina: Abrates, 1999. p. 1-21. (Cap. 1).
MARCOS FILHO, J.; CÍCERO, S. M.; SILVA, W. R.
Avaliação da qualidade das sementes. Piracicaba: Fealq, 1987.
MARCOS FILHO, J.; NOVEMBRE, A. D. C.; CHAMMA, H. M. C. P. Tamanho da semente e o teste de envelhecimento acelerado para soja. Scientia Agricola, v. 57, n. 3, p. 473-482, 2000.
MARCOS FILHO, J.; NOVEMBRE, A. D. C.; CHAMMA, H. M. C. P. Testes de envelhecimento acelerado e de deterioração controlada para avaliação do vigor de sementes de soja. Scientia Agricola, v. 58, n. 2, p. 421-426, 2001.
NAKAGAWA, J. Testes de vigor baseados na avaliação das plântulas. In: VIEIRA, R. D.; CARVALHO, N. M. (Ed.).
Testes de vigor em sementes. Jaboticabal: Funep, 1994. NAKAGAWA, J. Testes de vigor baseados no desempenho de plântulas. In: KRZYZANOWSKI, F. C.; VIEIRA, R. D.; FRANÇA NETO, J. B. (Ed.). Vigor de sementes: conceitos e testes. Londrina: Abrates, 1999. p. 1-21. (Cap. 2). PINTO, T. L. F.; CICERO, S. M.; FORTI, V. A. Avaliação de danos por umidade, em sementes de soja, utilizando a técnica da análise de imagens. Revista Brasileira de Sementes, v. 29, n. 3, p. 31-38, 2007.
ROSSETO, C. A. V.; MARCOS FILHO, J. Comparação entre métodos de envelhecimento acelerado e de deterioração controlada para avaliação da qualidade fisiológica de sementes de soja. Scientia Agricola, v. 52, n. 1, p. 123-131, 1995.
SCHUAB, S. R. P.; BRACCINI, A. L.; FRANÇA NETO, J. B.; SCAPIM, C. A.; MESCHEDE, D. K. Utilização da taxa de crescimento das plântulas na avaliação do vigor de sementes de soja. Revista Brasileira de Sementes, v. 24, n. 2, p. 90-95, 2002.
SCHUCH, L. O. B.; NEDEL, J. L.; ASSIS, F. N.; MAIA, M. S. Vigor de sementes e análise de crescimento de aveia preta. Scientia Agricola, v. 57, n. 2, p. 305-312, 2000. SEAB-Secretaria de Estado da Agricultura e do Abastecimento. Resolução nº 051, de 1986. Estabelece as normas para produção de sementes no estado. Curitiba, 1986.
VANZOLINI, S.; CARVALHO, N. M. Efeito do vigor de sementes de soja sobre o seu desempenho em campo.
Revista Brasileira de Sementes, v. 24, n. 1, p. 33-41, 2002. VIEIRA, R. D.; PENARIOL, A. L.; PERECIN, D.; PANOBIANCO, M. Condutividade elétrica e teor de água inicial das sementes de soja. Pesquisa Agropecuária Brasileira, v. 37, n. 9, p. 1333-1338, 2002. WERKEMA, M. C. C. Análise de regressão: como entender o relacionamento entre as variáveis de um processo. Belo Horizonte: Fundação Christiano Ottoni, Escola de Engenharia da UFMG, 1996.
Received on October 3, 2011. Accepted on March 12, 2012.