T
he increasing importance of vegetables as daily food for families almost everywhere has converted these group of crops into the main topic of several investigations that seek to improve both their quality and productivity (Heldwein et al., 2010; Strassburger et al., 2011). Research depends on experiments carefully planned and carried out to reduce the experimental error to the minimum. When the experimental error decreases, the accuracy of the information provided to users increases. Nevertheless, vegetables present some specificities which are additional sources of experimental error and may severely compromise the experimental precision, such as subjective harvestpoints, multiple harvests, null values in given harvests, and intensive use of protected cultivation, among others (Lorentz et al., 2005; Lúcio et al., 2008).
Vegetable production in protected environments is becoming more frequent and significant. Therefore, it is necessary to develop strategies to allow controlling the experimental error in this condition. The work carried out by Lopes et al. (1998) in tomato, Lúcio et al. (2006) in pepper, and Lúcio et al. (2008) and Carpes et al. (2010) in lettuce, showed that heterogeneity of variances between rows does happen in protected cultivation. Planting rows are set in parallel to the lateral openings of the protected environment and, therefore, have differential exposure
to light, wind, and soil conditions. The shape of the protected environments suggests that interaction between row ends and the external environment may take place as well. Such a hypothesis can be checked by simulating columns arranged perpendicular to the lateral openings and testing the homogeneity of variance among them. However, we did not find papers that have tested it.
The presence of heterogeneity of variances between planting rows justifies designing experiments with vegetables in protected cultivation in complete blocks design, using the row as a block (Plese et al., 1998; Carvalho & Tessarioli Neto, 2005). Such a strategy is effective in minimizing the effect of the heterogeneity of variances between LÚCIO, AD; SANTOS, D. 2018. Variability of production and the planning of experiments in snapbeans. Horticultura Brasileira 36: 382-388. DOI - http://
dx.doi.org/10.1590/S0102-053620180316
Variability of production and the planning of experiments in snapbeans
Alessandro D Lúcio; Daniel Santos11Universidade Federal de Santa Maria (UFSM), Santa Maria-RS, Brazil; [email protected]; [email protected]
ABSTRACT
This work aimed at studying the variability of production of
snapbeans grown in plastic greenhouses and the effectiveness of
experimental borders and plot size in reducing such variability. Data from a uniformity experiment carried out in a plastic greenhouse were used. The analyzes were performed over spatial arrangements
that considered the plants first arranged in planting rows parallel to
the lateral openings of the greenhouse and then arranged in columns,
perpendicular to these openings. Different scenarios were produced by
excluding rows and columns. The homogeneity of variances between the remaining rows and columns was tested in each scenario, and
the variance and the coefficient of variation were calculated as well.
There was heterogeneity of variance between rows in the experiment.
Borders were not effective in reducing the coefficient of variation or
the frequency of cases of heterogeneity of variances between rows. Plots with two or more plants provided homogeneity of variances between rows and columns, creating room for the possibility of using the completely randomized design in experiments with snapbeans in plastic greenhouses.
Keywords: Phaseolus vulgaris, experimental precision, homogeneity of variance, experimental design, borders, plot size.
RESUMO
Variabilidade produtiva e planejamento de ensaios com feijão de vagem
O objetivo do trabalho foi estudar a variabilidade produtiva de
feijão de vagem cultivado em estufa plástica e verificar o efeito de
bordadura e do tamanho de parcela na redução desta variabilidade. Foram utilizados dados de um ensaio de uniformidade conduzido em estufa plástica. As análises foram realizadas sobre arranjos espaciais
que consideraram as plantas dispostas primeiramente em fileiras de
cultivo paralelas às aberturas laterais da estufa e, depois, dispostas em colunas perpendiculares a essas aberturas. Diferentes cenários
foram criados através da exclusão de fileiras e de colunas. Para cada
cenário realizou-se um teste de homogeneidade de variâncias entre
as fileiras e colunas remanescentes e calculou-se a variância e o coeficiente de variação. Ocorreu heterogeneidade de variâncias entre fileiras em ensaios com feijão de vagem em estufa plástica. O uso de bordaduras não foi eficiente em reduzir o coeficiente de variação ou a frequência de casos de heterogeneidade de variâncias entre fileiras.
Parcelas com duas ou mais plantas proporcionaram homogeneidade
de variâncias entre fileiras e colunas, o que possibilita o uso do
delineamento inteiramente casualizado em ensaios com feijão de vagem em estufa plástica.
Palavras-chave: Phaseolus vulgaris, precisão experimental, homogeneidade de variância, delineamento experimental, bordaduras, tamanho de parcelas.
rows on the error variance. Complete blocks design are indicated for situations where there is no homogeneity among experimental units, but it is still possible to form blocks of homogeneous experimental units (Storck et al., 2016). However, the variability of production within blocks may still take place if the hypothesis of heterogeneity of variances among columns arranged in the opposite direction to the rows is correct, thus inflating the variance of the experimental error. Borders are commonly used in field experiments to reduce competition between experimental plots (Storck et al., 2016). Borders could also be used in protected environments to minimize the interaction between lateral rows or between columns and the external environment, possibly reducing the variability in production that occurs in these environments.
Studies dealing with experimental techniques for snapbeans are rare, even those related to the use of borders. One of the few reports was made by Haesbaert et al. (2011), which determined the sample size for snapbeans in different environments, relating variability in production with meteorological conditions. In this work, the variability of pod production increased when sun brightness and air temperature escaped the ideal range to the crop, raising the estimates of the coefficient of variation and, therefore, demanding larger samples. In an experiment carried out in a protected environment, Santos et al. (2012) found that variability of production and the lack of randomness grew when sun brightness and temperatures were outside the snapbeans ideal ranges, but that increases in plot size minimized these effects. In their work, Santos et al. (2012) studied the variability of production between rows and within a single row but did not consider columns perpendicular to the lateral openings of the protected environment.
The objective of this work was to study the variability of production of snapbeans grown in plastic greenhouses and to test whether the use of borders and the increase in plot size are effective in minimizing such variability.
MATERIAL AND METHODS
The study was performed from data of uniformity trial carried out with snapbeans during the autumn-winter crop, belonging to the database of the Plant Experimental Sector, of the Crop Science Department, Federal University of Santa Maria. Trials were carried out in the experimental area of the Department, i n S a n t a M a r i a ( 2 9 ° 4 2 ’ 2 3 ’’ S , 53°43’15’’W, altitude 95 m). The region has a Cfa humid subtropical climate (Köeppen classification), with rains well distributed throughout the year and typical subtropical temperatures (Heldwein et al., 2009). The soil is a Haplic Acrisol (FAO, 1994).
Trials were carried out in plastic greenhouses type Pampean arch, ceiling height of 2.0 m and 3.5 m in the central part, 20 m long and 10 m wide, oriented North-South, and covered with low-density polyethylene film (LDPE), 150 micra thick and anti-UV additive. Snapbeans plants, cultivar Macarrão, were sowed in six planting mounds (cropping rows), 36 plants per mound, arranged in parallel to the greenhouse lateral openings. Mounds were mulched with black LDPE opaque film. The spacing was 0.5x1.0 m between plants and rows, respectively. The total mass of fresh pods, assessed throughout the cycle, was the working variable in all trials. Statistical analysis was performed considering the total production per plant.
Plants were arranged in J (36) planting rows, parallel to the greenhouse lateral openings, and in K (6) columns, perpendicular to the greenhouse lateral openings. The original scenario (J0K0 scenario) was used as the starting point to evaluate the border effect in the variability of production. From the original scenario, new scenarios were created by excluding rows and columns to work as borders (Figure 1). A row in each lateral end of the greenhouse was simultaneously excluded (Figure 1). Columns were also excluded one by one, simultaneously at each end of the greenhouse, until 50% of the available columns were excluded (Figure 1).
Different plot sizes were simulated to study the effect of plot size on
the variability of production in each scenario. Different plot sizes were mimicked by summing up adjacent plants in the planting row. Only plot sizes which were multiples of the total number of plants per row were considered. Therefore, all plants contributed to the results regardless of the plot size. Finally, we tested only plot sizes that allowed for at least three plots per planting row, so that the simulated plot size could be used for experimental purposes.
The mean, variance and coefficient of variation per row and column were calculated for each scenario and plot size. We used the Lilliefors test to check data normality, and the Bartlett test, in each situation, to check the homogeneity of variances between rows and columns. Statistical analyzes were performed using the software SAEG 9.1 and the package Office Excel, with 5% significance.
RESULTS AND DISCUSSION
Lilliefors test indicated the data had a normal distribution in all tested scenarios. Therefore, the homogeneity of variances was evaluated using Bartlett’s test.
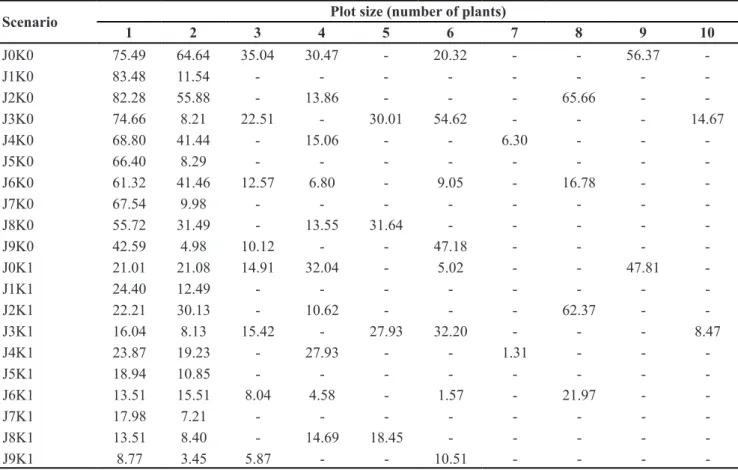
Considering the number of times the null hypothesis was rejected in each scenario, i.e., the cases in which variances between rows were heterogeneous, there was an increase in the frequency of heterogeneity of variance between rows in scenarios where borders were used comparing to those without borders (scenario J0K0) (Table 1). This result shows that the exclusion of rows or columns did not affect reducing the heterogeneity of variances between rows and, therefore, it is not expected to offer advantages for experiments carried out under similar conditions.
Increasing plot size resulted in reducing the heterogeneity of variances between rows in the scenario without the use of borders (scenario J0K0) (Table 1). Santos et al. (2012) also
found that the increase in plot size was effective in reducing the cases of heterogeneity of variances between crop rows in snapbeans grown in protected cultivation. The plot size effect is very likely related to the occurrence of areas either more or less favorable to plant growth within the same cropping row, generating variability among plants. When we increase the plot size, we also increase the chances of diluting these areas within the plot, reducing the variance between plots. Besides, by increasing plot size, we also reduce the frequency of null values, contributing to the reduction of the variance within the row (Lúcio et al., 2016) and also to the homogenization of variances between rows. However, too large plots in experiments in a limited area restrict the number of replications. Thus,
it is recommended to use plots with eight basic units, the optimal plot size recommended for snapbeans (Santos et al., 2012).
Results similar to that observed for the J0K0 scenario also occurred for other scenarios. All tests indicated heterogeneity of variances between rows with one-plant plots. However, homogeneity of variances between rows started to appear as plots increased in size (Table 1). This result strengthens the idea previously mentioned that one-plant plots should be avoided.
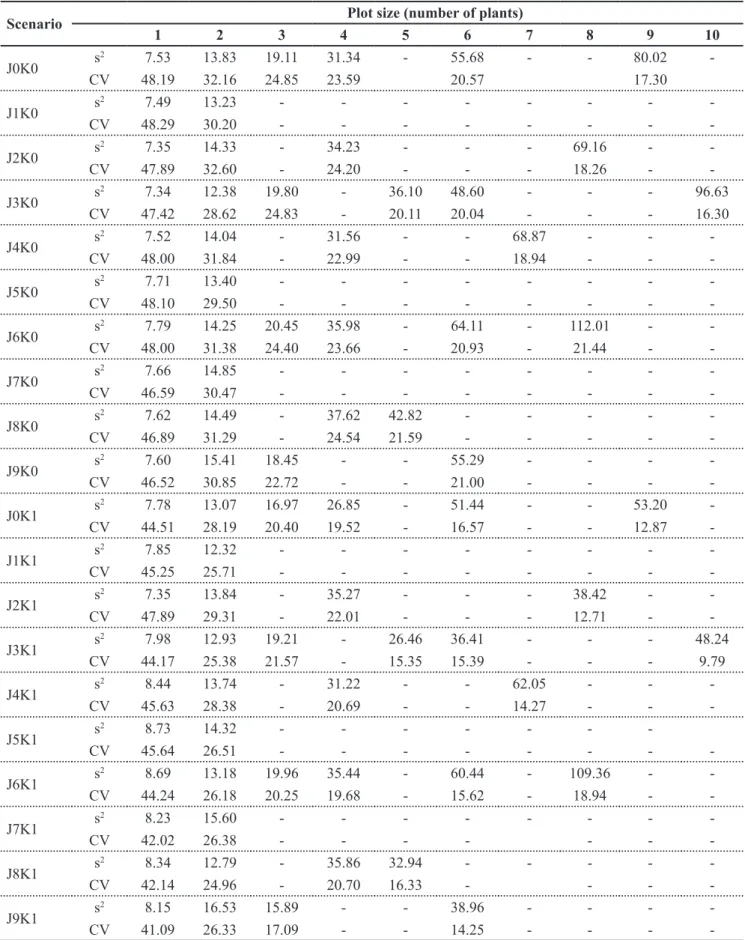
T h e r e w a s n o s i g n i f i c a n t heterogeneity of variances between columns in the J0K0 scenario, regardless of plot size (Table 2). In other words, the openings at the ends of the plastic greenhouse were not large enough to cause heterogeneity of variances
Table 1. Minimum level of significance of Bartlett test (p-value, in %) between rows of snapbeans in the scenarios produced by excluding rows (K) and columns (J), in different plot sizes, in trials carried out in a plastic greenhouse in the fall-winter season. Santa Maria, UFSM, 2016.
Scenario Plot size (number of plants)
1 2 3 4 5 6 7 8 9 10
J0K0 0.24 52.86 29.61 33.92 - 7.38 - - 72.68
-J1K0 0.38 0.12 - - -
-J2K0 0.68 40.33 - 6.95 - - - 99.44 -
-J3K0 0.71 0.62 19.52 - 83.72 58.90 - - - 67.07
J4K0 0.59 23.93 - 14.86 - - 19.03 - -
-J5K0 0.40 0.23 - - -
-J6K0 0.77 16.41 1.17 3.00 - 1.87 - 1.03 -
-J7K0 1.27 0.11 - - -
-J8K0 0.22 26.26 - 12.76 71.06 - - - -
-J9K0 0.26 0.17 1.62 - - 19.26 - - -
-J0K1 1.01 36.98 19.47 38.66 - 31.66 - - 78.05
-J1K1 1.42 0.31 - - -
-J2K1 2.12 27.12 - 17.02 - - - 96.90 -
-J3K1 1.29 1.05 20.49 - 78.52 47.71 - - - 60.22
J4K1 1.34 16.93 - 21.13 - - 15.07 - -
-J5K1 1.22 0.94 - - -
-J6K1 1.41 7.54 1.08 4.23 - 1.69 - 27.14 -
-J7K1 1.39 0.19 - - -
-J8K1 0.16 10.43 - 10.37 53.62 - - - -
-J9K1 0.13 0.16 0.63 - - 9.57 - - -
between columns in experiments with snapbeans. In contrast, lateral openings may influence the heterogeneity of variances between rows (Santos et al., 2012). There were some cases of significant heterogeneity of variances between columns in the scenarios where borders were used (Table 2). However, this is not relevant once the use of borders is not recommended in experiments with snapbeans in plastic greenhouses, as discussed in previous paragraphs. Therefore, attention should be given to the result achieved without using borders.
Plots of two or more plants provided homogeneity of variances between rows, unlike row and column borders, which were not useful in homogenizing of variances between rows. This result points to the possibility of using the completely randomized design in experiments with snapbeans, provided that the plot size is large enough. Storck et al. (2016) state the completely
randomized design should be preferred whenever experimental units are homogeneous. Completely randomized experiments are more flexible regarding the number of replications and treatments and allow the highest possible number of degrees of freedom for the experimental error, consequently resulting in greater experimental accuracy. Hence, combining plots of two or more plants with the completely randomized design can build on the precision of experiments with snapbeans.
The use of column borders did not substantially alter the magnitude of the coefficient of variation (CV) (Table 3). However, in some cases, row borders reduced the CV in comparison to the scenario without borders (J0K0). The decrease in CV values caused by the use of borders seems to be due to the reduction in the experimental mean since variances were less impacted. Santos et al. (2012), working with snapbeans in different environments, emphasize that
lateral rows suffer different conditions of temperature and soil moisture in protected environments. Hence, it is plausible to suppose the reduction in CVs due to row borders resulted from the decrease in the production mean. Since these rows were in unfavorable conditions, as they were excluded, the production average in the experiment increased, reducing the CV.
Lateral row borders had a minimal effect on reducing CV values and no effect in the homogenization of rows or columns, as already discussed. Therefore, it is not recommended to use borders in experiments with snapbeans in protected environments. In addition, borders would take up an experimental area that could be better used with new treatments or replications. The reduction in the number of replications may result in increases in the estimate of the experimental error since replications and the estimation of the experimental error are closely related (Storck et al.,
Table 2. Minimum level of significance of Bartlett test (p-value, in%) between planting columns of snapbeans in the scenarios produced by excluding rows (K) and columns (J), in different plot sizes, in an experiment carried out in a plastic greenhouse in the fall-winter season.
Santa Maria, UFSM, 2016.
Scenario Plot size (number of plants)
1 2 3 4 5 6 7 8 9 10
J0K0 75.49 64.64 35.04 30.47 - 20.32 - - 56.37
-J1K0 83.48 11.54 - - -
-J2K0 82.28 55.88 - 13.86 - - - 65.66 -
-J3K0 74.66 8.21 22.51 - 30.01 54.62 - - - 14.67
J4K0 68.80 41.44 - 15.06 - - 6.30 - -
-J5K0 66.40 8.29 - - -
-J6K0 61.32 41.46 12.57 6.80 - 9.05 - 16.78 -
-J7K0 67.54 9.98 - - -
-J8K0 55.72 31.49 - 13.55 31.64 - - - -
-J9K0 42.59 4.98 10.12 - - 47.18 - - -
-J0K1 21.01 21.08 14.91 32.04 - 5.02 - - 47.81
-J1K1 24.40 12.49 - - -
-J2K1 22.21 30.13 - 10.62 - - - 62.37 -
-J3K1 16.04 8.13 15.42 - 27.93 32.20 - - - 8.47
J4K1 23.87 19.23 - 27.93 - - 1.31 - -
-J5K1 18.94 10.85 - - -
-J6K1 13.51 15.51 8.04 4.58 - 1.57 - 21.97 -
-J7K1 17.98 7.21 - - -
-J8K1 13.51 8.40 - 14.69 18.45 - - - -
-J9K1 8.77 3.45 5.87 - - 10.51 - - -
Table 3. Variance (s2, in g2.104) and coefficient of variation (CV, in %) for fresh mass of pods of snapbeans in the scenarios produced by
excluding rows (K) and columns (J), in different plot sizes, in an experiment carried out in a plastic greenhouse in the fall-winter season.
Santa Maria, UFSM, 2016.
Scenario Plot size (number of plants)
1 2 3 4 5 6 7 8 9 10
J0K0 s
2 7.53 13.83 19.11 31.34 - 55.68 - - 80.02
-CV 48.19 32.16 24.85 23.59 20.57 17.30
J1K0 s
2 7.49 13.23 - - - - - - -
-CV 48.29 30.20 - - -
-J2K0 s
2 7.35 14.33 - 34.23 - - - 69.16 -
-CV 47.89 32.60 - 24.20 - - - 18.26 -
-J3K0 s
2 7.34 12.38 19.80 - 36.10 48.60 - - - 96.63
CV 47.42 28.62 24.83 - 20.11 20.04 - - - 16.30
J4K0 s
2 7.52 14.04 - 31.56 - - 68.87 - -
-CV 48.00 31.84 - 22.99 - - 18.94 - -
-J5K0 s
2 7.71 13.40 - - - - - - -
-CV 48.10 29.50 - - -
-J6K0 s
2 7.79 14.25 20.45 35.98 - 64.11 - 112.01 -
-CV 48.00 31.38 24.40 23.66 - 20.93 - 21.44 -
-J7K0 s
2 7.66 14.85 - - - - - - -
-CV 46.59 30.47 - - -
-J8K0 s
2 7.62 14.49 - 37.62 42.82 - - - -
-CV 46.89 31.29 - 24.54 21.59 - - - -
-J9K0 s
2 7.60 15.41 18.45 - - 55.29 - - -
-CV 46.52 30.85 22.72 - - 21.00 - - -
-J0K1 s
2 7.78 13.07 16.97 26.85 - 51.44 - - 53.20
-CV 44.51 28.19 20.40 19.52 - 16.57 - - 12.87
-J1K1 s
2 7.85 12.32 - - - - - - -
-CV 45.25 25.71 - - -
-J2K1 s
2 7.35 13.84 - 35.27 - - - 38.42 -
-CV 47.89 29.31 - 22.01 - - - 12.71 -
-J3K1 s
2 7.98 12.93 19.21 - 26.46 36.41 - - - 48.24
CV 44.17 25.38 21.57 - 15.35 15.39 - - - 9.79
J4K1 s
2 8.44 13.74 - 31.22 - - 62.05 - -
-CV 45.63 28.38 - 20.69 - - 14.27 - -
-J5K1 s
2 8.73 14.32 - - - - - -
-CV 45.64 26.51 - - -
-J6K1 s
2 8.69 13.18 19.96 35.44 - 60.44 - 109.36 -
-CV 44.24 26.18 20.25 19.68 - 15.62 - 18.94 -
-J7K1 s
2 8.23 15.60 - - - - - - -
-CV 42.02 26.38 - - -
-J8K1 s
2 8.34 12.79 - 35.86 32.94 - - - -
-CV 42.14 24.96 - 20.70 16.33 - - -
-J9K1 s
2 8.15 16.53 15.89 - - 38.96 - - -
-CV 41.09 26.33 17.09 - - 14.25 - - -
2016).
T h e r e w a s h e t e r o g e n e i t y o f variances between planting rows in experiments with snapbeans carried out in plastic greenhouses. The use of borders, either consisting of lateral rows or columns perpendicular to the sides of the plastic greenhouse, did not bring benefits concerning the reduction of the coefficient of variation, nor reduction of the heterogeneity of variances between rows or columns. The use of plots of two
or more plants provided homogeneity of variances between rows and columns in experiments with snapbeans in plastic greenhouses, making room for the use of the completely randomized design.
ACKNOWLEDGMENTS
The National Council for Scientific and Technological Development (CNPq) for granting a fellowship of productivity
in research.
REFERENCES
CARPES, RH; LÚCIO, AD; LOPES, SJ; BENZ, V; HAESBAERT, FM; SANTOS, D. 2010. Variabilidade produtiva e agrupamentos de colheitas de abobrinha italiana cultivada em ambiente protegido. Ciência Rural 40: 294-301.
CARVALHO, LA; TESSARIOLI NETO, J. 2005. Produtividade de tomate em ambiente protegido, em função do espaçamento e
J
1 2 3 4 5 6 1 2 3 4 5 6 1 2 3 4 5 6 1 2 3 4 5 6 1 2 3 4 5 6 1 2 3 4 5 6 1 2 3 4 5 6 1 2 3 4 5 6 1 2 3 4 5 6 1 2 3 4 5 6 1 X X X X X X
2 X X X X X X X X X X X X
3 X X X X X X X X X X X X X X X X X X
4 X X X X X X X X X X X X X X X X X X X X X X X X
5 X X X X X X X X X X X X X X X X X X X X X X X X X X X X X X
6 X X X X X X X X X X X X X X X X X X X X X X X X X X X X X X X X X X X X
7 X X X X X X X X X X X X X X X X X X X X X X X X X X X X X X X X X X X X X X X X X X
8 X X X X X X X X X X X X X X X X X X X X X X X X X X X X X X X X X X X X X X X X X X X X X X X X
9 X X X X X X X X X X X X X X X X X X X X X X X X X X X X X X X X X X X X X X X X X X X X X X X X X X X X X X
10 X X X X X X X X X X X X X X X X X X X X X X X X X X X X X X X X X X X X X X X X X X X X X X X X X X X X X X X X X X X X . . . . . . . . . . . . 27 X X X X X X X X X X X X X X X X X X X X X X X X X X X X X X X X X X X X X X X X X X X X X X X X X X X X X X X X X X X X 28 X X X X X X X X X X X X X X X X X X X X X X X X X X X X X X X X X X X X X X X X X X X X X X X X X X X X X X
29 X X X X X X X X X X X X X X X X X X X X X X X X X X X X X X X X X X X X X X X X X X X X X X X X 30 X X X X X X X X X X X X X X X X X X X X X X X X X X X X X X X X X X X X X X X X X X
31 X X X X X X X X X X X X X X X X X X X X X X X X X X X X X X X X X X X X 32 X X X X X X X X X X X X X X X X X X X X X X X X X X X X X X
33 X X X X X X X X X X X X X X X X X X X X X X X X 34 X X X X X X X X X X X X X X X X X X
35 X X X X X X X X X X X X 36 X X X X X X
J
1 2 3 4 5 6 1 2 3 4 5 6 1 2 3 4 5 6 1 2 3 4 5 6 1 2 3 4 5 6 1 2 3 4 5 6 1 2 3 4 5 6 1 2 3 4 5 6 1 2 3 4 5 6 1 2 3 4 5 6 1 X X X X
2 X X X X X X X X
3 X X X X X X X X X X X X
4 X X X X X X X X X X X X X X X X
5 X X X X X X X X X X X X X X X X X X X X
6 X X X X X X X X X X X X X X X X X X X X X X X X
7 X X X X X X X X X X X X X X X X X X X X X X X X X X X X
8 X X X X X X X X X X X X X X X X X X X X X X X X X X X X X X X X
9 X X X X X X X X X X X X X X X X X X X X X X X X X X X X X X X X X X X X
10 X X X X X X X X X X X X X X X X X X X X X X X X X X X X X X X X X X X X X X X X . . . . . . . . . . . . 27 X X X X X X X X X X X X X X X X X X X X X X X X X X X X X X X X X X X X X X X X 28 X X X X X X X X X X X X X X X X X X X X X X X X X X X X X X X X X X X X
29 X X X X X X X X X X X X X X X X X X X X X X X X X X X X X X X X 30 X X X X X X X X X X X X X X X X X X X X X X X X X X X X
31 X X X X X X X X X X X X X X X X X X X X X X X X 32 X X X X X X X X X X X X X X X X X X X X
33 X X X X X X X X X X X X X X X X 34 X X X X X X X X X X X X
35 X X X X X X X X 36 X X X X
J5K1 J6K1 J7K1 J8K1 J9K1 J0K1 J1K1 J2K1 J3K1 J4K1
K K K K K K K K K K
K K K K
K K K K K K
J6K0 J7K0 J8K0 J9K0 J0K0 J1K0 J2K0 J3K0 J4K0 J5K0
número de ramos por planta. Horticultura Brasileira 23: 968-989.
COSTA, JGC; ZIMMERMANN, FJP. 1998. Efeitos de bordaduras laterais e de cabeceira no rendimento e altura de plantas de feijoeiro comum. Pesquisa Agropecuária Brasileira
33: 1297-1304.
FAO. 1994. World reference base for soil resources: draft. Paris: Unesco. 161p. FILGUEIRA, FAR. 2000. Novo manual de
olericultura: agrotecnologia moderna na produção de hortaliças. Viçosa: UFV. 402p. HAESBAERT, FM; SANTOS, D; LÚCIO, AD;
BENZ, V; ANTONELLO, BI; RIBEIRO, ALP. 2011. Tamanho de amostra para experimentos com feijão-de-vagem em diferentes ambientes.
Ciência Rural 41: 38-44.
HELDWEIN, AB; BURIOL, GA; STRECK, N. 2009. O clima de Santa Maria. Ciência e Ambiente 38: 43-58.
HELDWEIN, AB; STRECK, N; STRUZA, VS; LOOSE, LH; ZANON, AJ; TOEBE, M; SOUZA, AT; PETERS, MB; KARLEC, F. 2010. Plastocrono e rendimento de feijão-de-vagem cultivado sob ambiente protegido e no ambiente externo em semeadura tardia no outono. Ciência Rural 40: 768-773. HELDWEIN, AB; BURIOL, GA; STRECK,
N.2009. O clima de Santa Maria. Ciência e Ambiente 38: 43-58.
LOPES, SJ; STORCK, L; HELDWEIN, AB; FEIJÓ, S; ROS, CA. 1998. Técnicas experimentais para tomateiro tipo salada sob estufas plásticas. Ciência Rural 28: 193-197. LORENTZ, LH; LÚCIO, AD; BOLIGON, AA;
LOPES, SJ; STORCK, L. 2005. Variabilidade da produção de frutos de pimentão em estufa plástica. Ciência Rural 35: 316-323. LÚCIO, AD; CARPES, RH; STORCK, L;
LOPES, SJ; LORENTZ, LH; PALUDO, AL. 2008. Variância e média da massa de frutos de abobrinha-italiana em múltiplas colheitas.
Horticultura Brasileira 26: 335-341. LÚCIO, AD; LORENTZ, LH; BOLIGON,
AA; LOPES, SJ; STORCK, L; CARPES, RH. 2006. Variação temporal da produção de pimentão influenciada pela posição e características morfológicas das plantas em ambiente protegido. Horticultura Brasileira
24: 31-35.
LÚCIO, AD; NUNES, LF; REGO, F; PASINI,
MPB. 2016. Relations between zero-inflated
variables in trials with horticultural crops.
Spanish Journal of Agricultural Research
14: 1-14.
PLESE, LPM; TIRITAN, CS; YASSUDA, EI;
PROCHNOW, LI; CORRENTE, JE; MELLO, SC. 1998. Efeitos das aplicações de cálcio e de boro na ocorrência de podridão apical e produção de tomate em estufa. Scientia Agricola 55: 114-148.
RIBEIRO, ND; STORCK, L; MELLO, RM. 2001. Bordadura em experimentos de competição de genótipos de feijoeiro relacionados à precisão experimental. Ciência Rural 31:13-17. SANTOS, D; HAESBAERT, FM; LÚCIO, AD;
LOPES, SJ; CARGNELUTTI FILHO, A; BENZ, V. 2012. Aleatoriedade e variabilidade produtiva de feijão-de-vagem. Ciência Rural
42: 1147-1154.
SANTOS, D; HAESBAERT, FM; PUHL, OJ; SANTOS, JRA; LÚCIO, AD. 2010. Suficiência amostral para alface cultivada em diferentes ambientes. Ciência Rural 40: 800-805.
STRASSBURGER, AS; PEIL, RMN; FONSECA, LA; AUMONDE, TZ, MAUCH, CR. 2011. Dinâmica de crescimento da abobrinha italiana em duas estações de cultivo. Acta Scientiarum Agronomy 33: 283-289.
STORCK, L; LOPES, SJ; ESTEFANEL, V; GARCIA, DC. 2016. Experimentação Vegetal.