Série Zoologia
Fundação Zoobotânica do Rio Grande do Sul Museu de Ciências Naturais
www.scielo.br/isz e-ISSN 1678-4766
Iheringia
Iheringia
Environmental assessment in tropical streams by using
abundance-biomass curves and W index in fish assemblages
Fábio T. Mise
1, Hugo J. Message
2, João P. A. Pagotto
3& Erivelto Goulart
41. Programa de Pós-Graduação em Biologia Comparada, Faculdade de Filosofia Ciências e Letras de Ribeirão Preto, Universidade de São Paulo, Ribeirão Preto, SP, Brasil. ([email protected])
2.Programa de Mestrado em Ciência Ambientais, Universidade Estadual do Oeste do Paraná, campus de Toledo, PR, Brasil. 3.Universidade Estadual do Paraná, campus de Paranavaí, PR, Brasil.
4.Universidade Estadual de Maringá, Departamento de Biologia, Maringá, PR, Brasil.
Received 26 May 2017 Accepted 28 June 2018 Published 17 September 2018
DOI 10.1590/1678-4766e2018029
ABSTRACT. We investigated the fish fauna response to different environmental conditions of urban (three) and rural (seven) streams through biomass/
abundance curves and W index of environmental stress. Negative values of W indicate some level of stress, while positive values suggest environments with lower stress. Dissolved oxygen, marginal erosion (both left and right margins), mesohabitat diversity, and percentage of canopy cover were measured to characterize the 10 streams analysed around Maringá city, Southern Brazil. Fish were sampled by electrofishing, then identified and weighed. Results showed negative values of W to the urban streams and positive to the rural. Urban streams showed a tendency to have assemblages of fish with lower biomass and greater abundance (r-strategists).
KEYWORDS. Neotropical region, biotic indices, stream ecology, biodiversity.
RESUMO. Avaliação ambiental em riachos tropicais utilizando curvas de biomassa-abundância e índice W em assembleias de peixes. A resposta da fauna de peixes a diferentes condições ambientais foi verificada em riachos urbanos (três) e rurais (sete), por meio de curvas de abundância/biomassa e o índice W de estresse ambiental. Valores negativos de W indicam níveis consideráveis de estresse, enquanto valores positivos sugerem ambientes com menos estresse. Para caracterizar os 10 riachos no sudeste do Brasil foram medidos oxigênio dissolvido, erosão das margens (direita e esquerda), diversidade de mesohabitats, e porcentagem de dossel. Os peixes foram amostrados por meio de pesca elétrica, identificados e pesados. Os resultados mostraram valores negativos de W para os riachos urbanos e positivos para os rurais. Os riachos urbanos mostraram uma tendência a ter assembléias de peixes com menor biomassa e maior abundância (r-estrategistas).
PALAVRAS-CHAVE. Região Neotropical, índices bióticos, ecologia de riachos, biodiversidade.
Despite its ecological and socioeconomic relevance,
tropical streams have been very impacted by human activities.
These impacts have modified physical, chemical and biotic
characteristics of these aquatic ecosystems, which affect the
species’ abundance and composition in these environments
(Malmqvist
&
Rundle, 2002; Englert
et al.
, 2015) and
commonly result from both urban and rural practices. In a
general classification, studies have separated streams in urban
and rural, according to the kinds of impacts, and activities
in areas surrounding the water bodies (Kühl
et al
., 2010;
Cunico
et al
., 2012). Urban streams are often reported as
affected by increasing impermeable surface, which boost
the frequency and magnitude of floods (Campana
&
Tucci,
2001), as well as by industrial and domestic sewage, that
changes the water quality (Pinto
et al
., 2006; Cunico
et
al
., 2006; Fialho
et al
., 2008). Whereas the rural streams
are commonly affected by deforestation, agricultural wastes
(including pesticides and fertilizers), and pasture (Casatti
et
al
., 2006; Kühl
et al
., 2010; Casatti
et al
., 2012; Teresa
et
al
., 2015). When compared with one another, urban streams
are generally more impacted than rural.
All anthropic impacts mentioned above can affect not
only species abundance and composition, but also trophic
structure (food webs), functional structure and vulnerability to
introduced species (Cunico
et al
., 2011; Casatti
et al
., 2015;
Ceneviva-Bastos
et al
., 2017), causing therefore disturbance
to the ecosystems. Understanding the changes in stream
communities caused by humans is a key role to mitigate
negative impacts and increase the management efficiency
and to prevent biodiversity loss. Biological indices have been
used to assess the environmental quality of tropical streams.
Some indices range from biological entities as taxonomic
diversity (
e.g.
Shannon index), functional diversity (
e.g.
trophic positions of species and ecomorphological aspects),
species composition (
e.g.
native vs nonnative species),
used organism in indices of environmental quality, such as
the biotic integrity index, and the EPT, respectively (Kerans
&
Karr, 1994; Bozzeti & Schulz, 2004).
In a range of methods, the abundance-biomass curves
(ABC) comprise a widely used method to assess the response
of the organism to environmental alterations (Warwick,
1986). Initially proposed for invertebrates, studies have
used this method to assess response of fish assemblages to
environmental stressors (Pinto
et al
., 2006; Sá-Oliveira
et
al
., 2014; Santos
et al
., 2015). Based on K-dominance curves,
the ABC method compares the percentage of cumulative
curves of abundance and biomass of each assemblage in a
scatterplot (Magurran, 2004). This method assumes that in
assemblages under non-significant impacts, the
K
-strategist
species establish over time, and contribute with a major
part of the biomass. On the other hand, in assemblages
under significant impacts, there is a tendency for selection
of
r
-strategist species that presents rapid development and
lower biomass.
The quantitative representation of the ABC curve is
the W index (Warwick
&
Clarke, 1994) which values vary
from −1 to 1. Negative values represent abundance curve
overlapped with biomass curve, and positive values indicate
the biomass curve above abundance curve. Thus, negative W
suggests stressed condition and saturation by lower biomass
species, while positive W indicates a lower environmental
stress and species with larger biomass (Warwick
&
Clarke,
1994).
In this context, the abundance-biomass curves were
used here to investigate the fish assemblage response to urban
and rural impacts on tropical streams. We expected urban
streams to be more impacted than rural and thus present
negatives values of the W index,
i.e
., a more environmentally
stressed fish fauna.
MATERIAL AND METHODS
The fieldworks were conducted in ten streams
(second to third order) from the Pirapó River basin (22°30’S/
51°15’W; 23°30’S/ 52°15’W), in the Maringá City, Paraná
state, Brazil (Fig. 1). Urban streams were Mandacaru,
Miosótis and Maringá Stream. Rural streams were: Queçaba,
Lombo, Remo, Granada, Romeira, Roseira and Zaúna.
The classification of rural and urban followed Kühl
et al
.
(2010) and Cunico
et al.
(2012), which used satellite images
(Landsat 5 TM). Urban streams presented more than 10%
of impermeable surface, calculated using software ArcGIS
9.3 and ENVI 4.5 (Cunico
et al.
,
2012). Unfortunately,
reference sites could not be used because all water bodies
in the region are under impact from urban or rural influence,
as addressed by Kühl
et al
. (2010).
Fish were sampled in May 2011 by electrofishing
(AC portable generator 1KW, 220V, 3-4A), that was carried
out along 50 m stretch in each stream. The specimens were
fixed in 4% formalin and preserved in 70% alcohol, then
identified (following Graça
&
Pavanelli, 2007), measured,
and weighed.
Measurements at five transects (10 meters of
distance) along the sampled stretches were performed to
the environmental characterization of each stream. Oxygen
saturation (percentage of dissolved oxygen) and conductivity
(µm/L) were obtained using Yellow Springs Inc. equipment
(models 95 and 30). Percentage of canopy cover and margin
erosion (right and left) were estimated by visual inspections.
Flooded vegetation was quantified by the number of filled
25 cm
2quadrants in a 1 m
2plastic square. Lastly, we defined
pools, rapids, and riffles as categories of mesohabitat, then we
quantified the diversity of mesohabitats in 1, 2, and 3 levels
by the number of mesohabitat’s categories present in each
transect by visual inspection. With exception of mesohabitat
diversity, an average of the parameters was performed to
characterize each stream.
Using these environmental variables, a Principal
Coordinate Analysis (PCoA) was performed on normalized
data to show the environmental dissimilarities among the
streams. The PCoA was conducted using a dissimilarity matrix
calculated by the Gower distance, which can handle with
data from different natures (Pavoine
et al.
,
2009), considering
that mesohabitat diversity was an ordinal variable, and the
others were quantitative. The environmental variables more
associated with each PCoA ordination axis were identified
by examining the correlation (Spearman rank correlation).
The axes 1 and 2 from this environmental PCoA were
Spearman rank correlated with species abundance (Orsi
et
al
., 2018) and biomass to investigate their association with
the environmental characteristics of the streams.
The abundance and biomass were used to quantify
the environmental stress according to the ABC method
and the W stress index (Warwick
&
Clarke, 1994). The
efficiency of W in describe the environmental stress was
analyzed through a Spearman correlation between W and
the scores from PCoA 1.
All the statistical analyses, the ABC curves drawing,
and the W calculation were performed in the PRIMER-E
software (Clarke
&
Gorley, 2006), and the PCoA was
performed using the R software (R Core Team, 2008).
RESULTS
We captured a total of 890 individuals of 28 species,
belonging to six orders and ten families (Tab. I). In urban
streams, we collected 413 individuals of 11 species and
in rural streams, 587 individuals of 27 species. The urban
streams Mandacaru and Miosótis presented lower fish
species richness, with five species (but another urban stream,
Maringá, had 11 species) (Tab. I). On the rural streams,
Queçaba presented the higher number of species (16).
Granada, and Zaúna showed 15 and 10 species, respectively.
Roseira, Lombo, and Remo streams had nine fish species
each one.
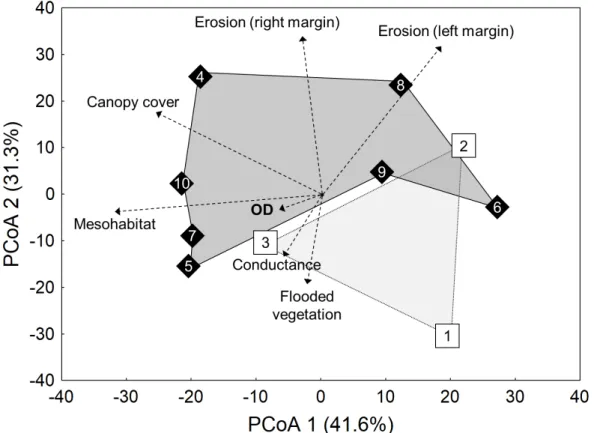
The two first axes of the PCoA explained 72.9% of
environmental variability among the streams and showed
a clear separation regarding environmental distinctiveness
between urban and rural streams (Fig. 2). Mesohabitat diversity
and percentage of canopy covering were more negatively
correlated with PCoA1, which was more positively correlated
with marginal erosion of the left margin. On the other hand,
PCoA2 was more negatively correlated with Mesohabitat
Tab. I. Species list of the sampled streams, with the abundance (N) and average biomass (B), Pirapó River basin, Maringá City, Paraná state, Brazil.
Granada Romeira Zaúna Roseira Remo Queçaba Lombo Mandacaru Miosótis Maringá Stream
N B N B N B N B N B N B N B N B N B N B
CHARACIFORMES
Astyanax lacustris (Lütken, 1875) 14 10.44 10 5.55 - - - 19 6.32 - - 1 13.70 - - 2 3.54
Astyanax aff.paranae Eigenmann, 1914 8 3.73 - 14 6.29 8 5.55 8 1.94 - - - 6 5.60
Astyanax fasciatus (Cuvier, 1819) 3 6.20 3 7.57 - - 31 6.62 - - 28 3.20 1 10.02 - - - - 1 4.00
Astyanax bockmanni Vari & Castro, 2007 - - - 1 5.60 8 8.23 - - -
-Bryconamericus exodon
Eigenmann, 1907 - - - 3 0.79 - - -
-Byconamericus aff.iheringii
(Boulenger, 1887) 4 1.85 - - -
-Piabarchus stramineus
(Eigenmann, 1908) 7 1.15 - - - 3 0.56 1 2.66 1 1.96 - - -
-Piabina argentea Reinhardt, 1867 12 1.44 - - - 15 0.62 2 3.31 - - -
-Oligosarcus paranensis Menezes &
Géry, 1983 - - - 1 9.7 - - -
-Characidum aff. zebra Eigenmann, 1909 5 1.36 - - 7 1.42 - - - - 9 0.80 1 1.32 - - -
-Hoplias malabaricus (Bloch, 1794) 1 5.60 - - - - 1 50.4 - - -
-SILURIFORMES
Corydoras aff.aeneus (Gill, 1858) - - - 27 1.83 - - -
-Cetopsorhamdia iheringi Schubart &
Gomes, 1959 2 7.00 1 1.26 3 6.83 2 3.41 - - 1 1.29 - - 2 0.55 6 0.70 6 0.83
Rhamdia quelen (Quoy & Gaimard,
1824) 2 6.08 1 12.80 3 11.98 2 2.22 4 28.02 4 9.77 - - 8 15.31 1 9.00 10 7.74 Imparfinis mirini Haseman, 1911 - - 2 1.98 - - - 3 0.95 - - - 1 3.30
Imparfinis schubarti (Gomes, 1956) - - 5 1.26 - - 50 0.73 - - - - 20 1.91 - - -
-Pimelodella avanhandavae Eigenmann,
1917 - - - 2 3.90 - - -
-Phenacorhamdia tenebrosa (Schubart,
1964) - - 11 0.86 1 2.35 - - 1 0.06 - - - 1 0.40 -
-Heptapterus mustelinus (Valenciennes,
1835) - - - 16 6.40 - - -
-Hypostomus ancistroides (Ihering, 1911) 7 6.74 5 2.15 1 1.07 25 1.16 3 2.29 2 0.91 7 5.87 16 3.36 7 0.97 118 2.28 Hypostomus strigaticeps (Regan, 1908) 1 3.65 - - 1 8.32 - - - - 2 13.80 - - - 1 23.70
Hypostomus sp. - - - - 1 5.80 - - - - 1 19.00 - - - 1 0.30
GYMNOTIFORMES
Gymnotus sylvius Albert &
Fernandes-Matioli, 1999 1 1.48 1 8.60 - - - - 1 1.72 - - -
-Gymnotus inaequilabiatus (Valenciennes,
1839) 1 7.14 - - - 1 11.03 - - 1 13.08 - - -
-Cyprinodontiformes
Poecilia reticulata Peters, 1859 3 0.27 - - 15 0.30 14 0.16 93 0.10 5 0.05 - - 105 0.86 36 0.41 83 0.41
SYNBRANCHIFORMES
Synbranchus marmoratus Bloch, 1795 - - - 1 11.90
PERCIFORMES
Crenicichla britskii Kullander, 1982 - - - 2 1.21 - - -
-Geophagus brasiliensis (Quoy &
Gaimard, 1824) - - - 1 2.86 - - -
-diversity and dissolved oxygen and positively correlated with
marginal erosion of both left and right margins.
Spearman correlations to species abundance showed
that
Hypostomus strigaticeps
,
Characidium
aff.
zebra
,
Corydoras
aff.
aeneus
,
Crenicichla britskii
,
Pimelodella
avanhandavae
, and
Synbranchus marmoratus
were related
to the rural, whereas
Hypostomus ancistroides
,
Geophagus
brasiliensis
,
Imparfinis schubarti
,
Synbranchus marmoratus
,
Gymnotus inaequilabiatus
,
Oligosarcus paranensis
to the
urban streams (Tab. II). To biomass,
Astyanax lacustris
,
C.
aff.
zebra
,
H. strigaticeps
,
C. aeneus
,
C. britskii
,
Pimelodella
avanhandavae
,
H. ancistroides
and
S. marmoratus
were
related to the rural, while
G. brasiliensis
and
O. paranensis
to the urban (Tab. III).
Tab. II.Spearman’s correlation of species’ abundance data in Pirapó River basin, Maringá City, Paraná state, Brazil with axes 1 and 2 (PCoa1 and PCoa1) of the PCoA on environmental data (see Fig. 2). Species with coefficients of correlation higher than 0.5 were bolded.
Species ρPCoA1 Species ρPCoA2
Hypostomus strigaticeps -0.68 Synbranchus marmoratus -0.52
Characidium aff.zebra -0.56 Hypostomus strigaticeps -0.50
Corydoras aff.aeneus -0.52 Astyanax lacustris -0.43
Crenicichla britskii -0.52 Bryconamericus aff.iheringii -0.41
Pimelodella avanhandavae -0.52 Rhamdia quelen -0.38
Hoplias malabaricus -0.45 Characidium aff. zebra -0.33
Astyanax bockmanni -0.42 Piabina argentea -0.31
Astyanax lacustris -0.41 Cetopsorhamdia iheringi -0.18
Bryconamericus aff.iheringi -0.41 Hypostomus sp. -0.17
Piabina argentea -0.38 Heptapterus mustelinus -0.17
Hypostomus sp. -0.29 Astyanax bockmanni -0.11
Heptapterus mustelinus -0.29 Gymnotus inaequilabiatus -0.10
Rhamdia quelen -0.26 Imparfinis mirini -0.10
Astyanax aff.paranae -0.25 Geophagus brasiliensis -0.06
Oligosarcus paranensis -0.17 Piabarchus stramineus -0.05
Imparfinis mirini -0.14 Poecilia reticulata -0.03
Piabarchus stramineus -0.14 Hoplias sp. 2 0.02
Gymnotus sylvius -0.13 Hypostomus ancistroides 0.02
Cetopsorhamdia iheringi -0.04 Corydoras aff.aeneus 0.06
Poecilia reticulata 0.14 Crenicichla britskii 0.06
Bryconamericus exodon 0.17 Pimelodella avanhandavae 0.06
Phenacorhamdia tenebrosa 0.19 Gymnotus sylvius 0.08
Gymnotus inaequilabiatus 0.23 Astyanax aff.paranae 0.24
Synbranchus marmoratus 0.29 Phenacorhamdia tenebrosa 0.37
Imparfinis schubarti 0.32 Imparfinis schubarti 0.38
Geophagus brasiliensis 0.52 Bryconamericus exodon 0.41
Hypostomus ancistroides 0.64 Oligosarcus paranensis 0.52
Tab. III.Spearman correlation of species’ biomass data in Pirapó River basin, Maringá City, Paraná state, Brazil with axes 1 and 2 (PCoA1 and PCoA1) of the PCoA on environmental data (see Fig. 2). Species with coefficients of correlation higher than 0.5 were bolded.
Species ρPCoA1 Species ρPCoA2
Astyanax lacustris -0.56 Hypostomus strigaticeps -0.55
Characidium aff. zebra -0.56 Hypostomus ancistroides -0.54
Hypostomus strigaticeps -0.53 Synbranchus marmoratus -0.52
Corydoras aff.aeneus -0.52 Astyanax lacustris -0.48
Crenicichla britskii -0.52 Bryconamericus aff.iheringi -0.41
Pimelodella avanhandavae -0.52 Characidium aff.zebra -0.33
Cetopsorhamdia iheringi -0.47 Rhamdia quelen -0.31
Hoplias malabaricus -0.42 Piabina argentea -0.31
Bryconamericus aff.iheringii -0.41 Poecilia reticulata -0.22
Astyanax bockmanni -0.39 Hypostomus sp. -0.17
Piabina argentea -0.38 Heptapterus mustelinus -0.17
Piabarchus stramineus -0.30 Imparfinis mirini -0.17
Hypostomus sp. -0.29 Piabarchus stramineus -0.14
Heptapterus mustelinus -0.29 Cetopsorhamdia iheringi -0.13
Rhamdia quelen -0.21 Geophagus brasiliensis -0.06
Oligosarcus paranensis -0.17 Astyanax bockmanni -0.01
Astyanax aff.paranae -0.12 Gymnotus inaequilabiatus 0.01
Gymnotus sylvius -0.05 Corydoras aff.aeneus 0.06
Imparfinis mirini -0.04 Crenicichla britskii 0.06
Phenacorhamdia tenebrosa 0.14 Pimelodella avanhandavae 0.06
Poecilia reticulata 0.16 Hoplias malabaricus 0.16
Bryconamericus exodon 0.17 Gymnotus sylvius 0.19
Synbranchus marmoratus 0.29 Astyanax aff.paranae 0.20
Hypostomus ancistroides 0.30 Phenacorhamdia tenebrosa 0.34
Gymnotus inaequilabiatus 0.31 Imparfinis schubarti 0.38
Imparfinis schubarti 0.32 Bryconamericus exodon 0.41
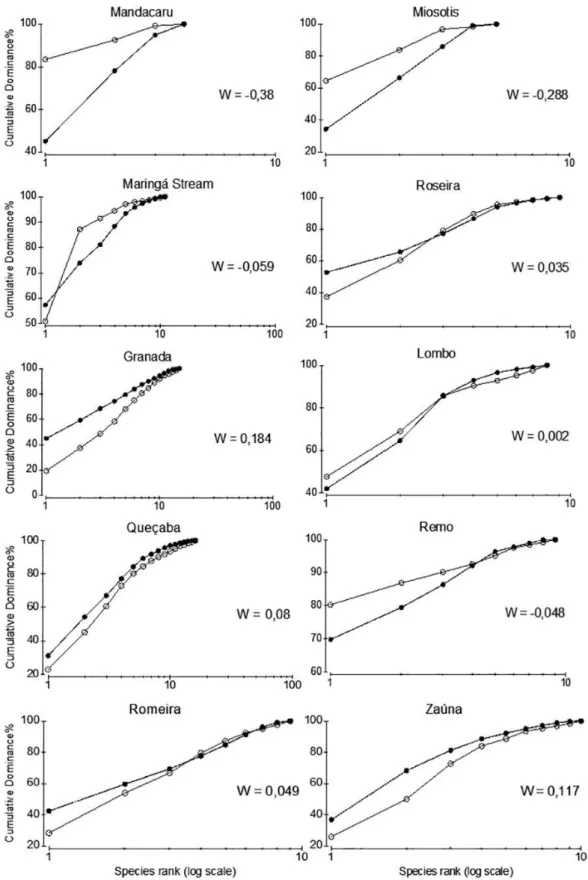
Maringá Stream: W= −0.059), and showed the abundance
curves above the biomass, which indicates stressing condition
(Fig. 3). Negative value of W appeared only in one rural
stream, Remo (W= −0.048). Queçaba, Lombo, Romeira
and Roseira streams presented positive W scores (0.08,
0.002, 0.049 and 0.035 respectively). The major values for
W index were registered for streams Granada (W= 0.18)
and Zaúna (W= 0.12).
Fig. 3. Accumulation curves of abundance (white circles) and biomass (black circles) to show the ABC method and values of W index for fish assemblages sampled in the streams of Maringá, Paraná, Brazil. Negative values of W suggest environmentally stressed (following Warwick & Clarke, 1994)
The Spearman correlation showed a negative relation
(ρ = -0.68; p = 0.02) between of W and PCoA 1 scores
and suggested that W negative values were in urban (more
impacted) streams, while W positive values were in rural
(less impacted) streams (Fig. 4).
DISCUSSION
Our results showed that all urban streams were
environmentally stressed (negative scores of W index),
while only one rural stream (Remo) had negative W value.
We reinforced the trends in other studies that used ABC
curves, such as Pinto
et al
. (2006) about the need of
complementarities of methods in environmental assessment.
Here, ABC curves and W index were very useful to evaluate
the environmental stress of the streams, however, more precise
conclusions were obtained when we analysed the PCoA and
the correlations of both abundance and biomass of the species
with the environmental conditions. We recommend that stress
evaluation in tropical streams rivers would be done by a set
of environmental indices and statistical tools (here we used
the ABC curves, W indices, PCoA of environmental data, and
correlation of abundance and biomass by species versus the
environmental PCoA’s axes) to avoid weak interpretations
about human impacts in stream ecosystems.
In this study, the influence of urban and rural location
of the streams was clearly revealed by an environmental
pattern displayed by both PCoA and W values. The urban
streams were impacted by low diversity of mesohabitat and
canopy cover, showing great erosion of both right and left
margin because of the human occupation. On the other hand,
the rural streams were not completely free of impact, which
was observed mainly from the erosion of left margin.
Yet, despite the environmental gradient from urban to
rural streams detected by the PCoA, the species more related
with both urban and rural streams were basically the same.
The explanation for this pattern is the ecological specificity
(or specialization) of the species more correlated with PCoA1
and PCoA2 for both abundance and biomass data. The species
more correlated with the urban (impacted) streams were
those suited to live in siltation (a condition derived from
low canopy cover and representative of low mesohabitat
diversity), such as
H. ancistroides
(Casatti
et al
., 2005),
I.
schubarti
(Severo-Neto
et al.
, 2015), and
H. strigaticeps
(Jepep
et al.
, 2007)
,
with high feeding plasticity (impacted
streams are frequently recorded as food resource restricted),
like
R. quelen
(Gomiero
et al.
, 2007),
G. inaequilabiatus
(Hahn
et al.
, 2004),
G. brasiliensis
(Bastos
et al.
, 2011),
Bryconamericus iheringii
(Oliveira
&
Bennemann, 2005;
Oricolli
&
Bennemann, 2006),
A. lacustris
(Bennemann
et
al
., 2005, under
A. altiparanae
), and
O. paranensis
(Abelha
et al
., 2012), adapted to feed on organic detritus (a typical
food resource in impacted streams), as
H. ancistroides
and
H. strigaticeps
(Pagotto
et al.
, 2011), and with high
reproductive plasticity, as
S. marmoratus
(Favorito
et al.
,
2005). All these species are adapted to use scarce alimentary,
shelter, and reproductive resources, as appears to be the
case here. Other important species in the streams which
showed negative W was
Poecilia reticulata
(Tab. I), which
is well-recognized as an opportunistic species with rapid
development (
r
-strategist) and typical of impacted streams
(Winemiller
et al
., 1989; Lemes
&
Garutti, 2002).
The pattern we found here of representative species
with high abundance and low biomass is common in urban
streams (Pinto
et al
., 2006). The rural stream (Remo) that
showed negative values of W index seems to be under
influence environmental impact (not identified here), which
is reinforced by the high abundance of
P. reticulata
that also
contributed to the lower W value. Tests using invertebrates
have indicated that Maringá rural streams have received
agricultural (toxic) wastes (Kühl
et al
., 2010). Then the
use of W index and ABC curves can be useful in identifying
cumulative effects that are difficult to assess, such as impacts
caused by agricultural wastes, and another kind of pollutants
that are not visually detected.
We strongly recommend this multi analytical approach
for the assessment of environmental condition (stress) of
streams. The trend of diminution in fish biomass and increase
of abundance in the urban streams was successfully detected
by both ABC method and W index (as confirmed by the
Spearman correlation between W and PCoA1) and the
ecological meaning was explained by PCoA and Spearman
correlation analyses. The applied method allowed to detect
other potential kinds of impacts in rural streams (as observed
in Remo).
Acknowledgements. The authors are grateful to Programa de
Pós-graduação em Ecologia de Ambientes Aquáticos Continentais (PEA) - Universidade Estadual de Maringá, and Programa de Pós-Graduação em Biologia Comparada – Universidade de São Paulo. We also thank Renata R. Ota for revising the species list, Nupélia for providing conditions to perform the fieldwork, and CAPES, FAPESP (FTM), and PNPD/CAPES (HJM) for financial support.
REFERENCES
Abelha, M. C. F.; Kashiwaqui, E. A. L. & Goulart, E. 2012. Population
structure, condition and diet of Oligosarcus paranensis (Menezes &
Géry, 1983) (Osteichthyes: Characidae) at two reservoirs in South Brazil. Biota Neotropica12(1):187-197. http://dx.doi.org/10.1590/ S1676-06032012000100015
Bastos, R. F.; Condini, M. V.; Varela Junior, A. S. & Garcia, A. M. 2011.
Diet and food consumption of the pearl cichlid Geophagus brasiliensis
(Teleostei: Cichlidae): relationships with gender and sexual maturity.
Neotropical Ichthyology9(4):825-830.
Bennemann, S. T.; Gealh, A. M.; Orsi, M. L. & Souza, L. M. 2005.
Ocorrência e ecologia trófica de quatro espécies de Astyanax
(Characidae) em diferentes rios da bacia do rio Tibagi, Paraná, Brasil. Iheringia, Série Zoologia 95(3):247-254. http://dx.doi.org/10.1590/ S0073-47212005000300004
Bozzetti, M. & Schulz, U. H. 2004. An index of biotic integrity based
on fish assemblages for subtropical streams in southern Brazil.
Hydrobiologia 529:133-144.
Campana, N. & Tucci, C. E. M. 2001. Predictiong floods from urban development scenarios: case study of the Dilúvio basin, Porto Alegre, Brazil. Urban Water 3: 113:124.
Casatti, L.; Langeani, F. & Pereira, C. P. 2006. Effects of physical habitat
degradation on the stream fish assemblage structure in a pasture region.
Environmental Management38:974-982.
Casatti, L.; Rocha, F. C. & Pereira, D. C. 2005. Habitat use by two species of Hypostomus (Pisces, Loricariidae) in Southeastern Brazilian
streams. Biota Neotropica5:1-9.
Casatti, L.; Teresa, F. B.; Gonçalves-Souza, T.; Bessa, E.; Manzotti, A. R.; Gonçalves, C. S. & Zeni, J. O. 2012. From forests to cattail: how
does the riparian zone influences stream fish? Neotropical Ichthyology 10(1):205-214.
Casatti, L.; Teresa, F. B.; Zeni, J. O.; Ribeiro, M. D.; Brejão, G. L.
& Ceneviva-Bastos, M. 2015. More of the same: high functional
redundancy in stream fish assemblages from a tropical agroecosystems.
Environmental Management55:1300-1314.
Ceneviva-Bastos, M.; Montaña, C.; Schalk, C. M.; Camargo, P. &
Casatti, L. 2017. Responses of aquatic food webs to the addition of structural complexity and basal diversity in degradeted Neotropical streams. Austral Ecology 42(8):908-919. https://doi.org/10.1111/ aec.12518
Clarke, K. R. & Gorley, R. N. 2006. PRIMER v6: user manual/tutorial. Plymouth, PRIMER-E, 192p.
Cunico, A. M.; Agostinho, A. A. & Latini, J. D. 2006. Influência da
urbanização sobre as assembléias de peixes em três córregos de Maringá, Paraná. Revista Brasileira de Zoologia23(4):1101-1110.
Cunico, A. M.; Allan, J. D. &Agostinho, A. A. 2011. Functional convergence of fish assemblages in urban streams of Brazil and the United States. Ecological Indicators11:1354-1359.
Cunico, A. M.; Ferreira, E. A.; Agostinho, A. A.; Beaumord, A. C. & Fernandes, R. 2012. The effects of local and regional environmental factors on the structure of fish assemblages in the Pirapó Basin, Southern Brazil. Landscape and Urban Planning105:336-344.
Englert, D.; Zubrod, J. P.; Schulz, R. & Bundschuh, M. 2015.
Variability in ecosystem structure and functioning in a low order stream: Implications of land use and season. Science of The Total
Environment538:341-349.
Favorito, S. E.; Zanata, A. M. & Assumpção, M. I. 2005. A new
Synbranchus (Teleostei: Synbranchiformes: Synbranchidae) from
ilha de Marajó, Pará, Brazil, with notes on its reproductive biology and larval development. Neotropical Ichthyology3(3):319-328. http:// dx.doi.org/10.1590/S1679-62252005000300001
Fialho, A. P.; Oliveira, L. G.; Tejerina-Garro, F. L. & Mérona, B.
2008. Fish-habitat relationship in a tropical river under anthropogenic influences. Hydrobiologia598:315-324.
Graça, W. J. & Pavanelli, C. S. 2007. Peixes da planície de inundação
do alto rio Paraná e áreas adjacentes. Maringá, EDUEM. 241p.
Gomiero, L. M.; Souza, U. P. & Braga, F. M. S. 2007. Reprodução e
alimentação de Rhamdia quelen (Quoy & Gaimard, 1824) em rios do
Núcleo Santa Virgínia, Parque Estadual da Serra do Mar, São Paulo, SP. Biota Neotropica 7(3):127-133. http://dx.doi.org/10.1590/S1676-06032007000300015
Hahn, N. S.; Fugi, R.; Andrian, I. F. 2004. Trophic ecology of the fish assemblages. In: Thomaz, S. M.; Agostinho, A. A.; Hahn, N. S.
ed. The Upper Paraná River and its floodplain: physical aspects,
ecology and conservation. Leiden, Backhuys Publishers, p. 247-269. Kerans, B. L. & Karr, J. R. 1994. A benthic index of biotic integrity
(B-IBI) for rivers of the Tennessee Valley. Ecological Applications 4(4):768-785.
Kühl, A. M.; Rocha, C. L. M. S. C.; Espíndola, E. L. G. & Lansac-Tôha, F. A. 2010. Rural and Urban Streams: Anthropogenic Influences and impacts on water and sediment quality. International Review of
Hydrobiology95(3):260-272.
Lemes, E. M. & Garutti, V. 2002. Ecologia da ictiofauna de um córrego
de cabeceira da bacia do Alto Rio Paraná, Brasil. Iheringia,Série Zoologia 92(3):69-78.
Magurran, A. E. 2004. Measuring Biological Diversity. 2ed. Oxford, Blackwell 264p.
Malmqvist, B. & Rundle, S. 2002. Threats to the running water ecosystem
of the world. Environmental Conservation29(2):134-153. Oliveira, D. C. D. & Bennemann, S. T. 2005. Ictiofauna, recursos
alimentares e relações com as interferências antrópicas em um riacho urbano no sul do Brasil. Biota Neotropica5:95-107.
Oricolli, M. C. G. & Bennemann, S. T. 2006. Dieta de Bryconamericus iheringii (Ostariophysi: Characidae) em riachos da bacia do Rio Tibagi,
Estado do Paraná. Acta Scientiarum, Biological Sciences 28:59-63. Orsi, C. H.; Message, H. J.; Debona, T.; Baumgartner, D. &
Baumgartner, G. 2018. Hydrological seasonality dictates fish fauna of the lower Araguaia River, Tocantins-Araguaia basin. Environmental Biology of Fishes101(6):881-897. doi.org/10.1007/s10641-018-0744-0. Pagotto, J. P. A.; Goulart, E.; Oliveira, E.F. &Yamamura, C. B. 2011.
tropical stream. Brazilian Journal of Biology71(2):469-479. http:// dx.doi.org/10.1590/S1519-69842011000300017
Pavoine, S.; Vallet, J.; Dufour, A.; Gachet, S. & Daniel, H. 2009. On the
challenge of treating various types of variables: application for improving the measurement of functional diversity. Oikos188(3):391-402. Pinto, B. C. T.; Peixoto, M. G. & Araújo, F. G. 2006. Effects of the
proximity from an industrial plant on fish assemblages in the rio Paraíba do Sul, southeastern Brazil. Neotropical Ichthyology4(2):269-278. R Development Core Team. 2008. R: A language and environment
for statistical computing. R Foundation for Statistical Computing, Vienna, Austria. URL http://www.R-project.org.
Santos, F. B.; Ferreira, F. C. & Esteves, K. E. 2015. Assessing the
importance of the riparian zone for stream fish communities in a sugarcane dominated landscape (Piracicaba River Basin, Southeast Brazil). Environmental Biology of Fishes98:1895-1912.
Sá-Oliveira, J. C.; Isaac, V. J. & Ferrari, S. F. 2015. Fish community
structure as an indicator of the long-term effects of the damming of an amazonian river. Environmental Biology of Fishes98:273-286.
Severo-Neto, F.; Teresa, F. B. & Froehlich, O. 2015. Ecomorphology
and diet reflect the spatial segregation between two Siluriformes species inhabiting a stream of the Bodoquena Plateau, in Central Brazil. Iheringia, Série Zoologia 105(1):62-68. http://dx.doi.org/10.1590/1678-4766201510516268
Teresa, F. B.; Casatti, L. & Cianciaruso, M. V. 2015. Functional
differentiations between fish assemblages from forested and deforested streams. Neotropical Ichthyology13(2): 361-370.
Terra, B. F.; Hughes, R. M.; Francelino, M. R. & Araújo, F. G. 2013.
Assessment of biotic condition of Atlantic rain forest streams: a fish-based multimetric approach. Ecological Indicators34:136-148. Warwick, R. M.1986. A new method for detecting pollution effects on
marine macrobenthic communities. Marine Biology, 92: 557-562. Warwick, R. M. & Clarke, K. R. 1994. Relearning the ABC: taxonomic
changes and abundance/biomass relationship in disturbed benthic communities. Marine Biology118:739-744.