Trends in corneal transplantation from 2001 to
2016 in Brazil
Tendências no transplante de córnea de 2001 a 2016 no Brasil
Hirlana Gomes Almeida1, Richard Yudi Hida1, 2, Newton Kara-Junior1
1. Department of Ophthalmology, Hospital das Clínicas, Universidade de São Paulo, São Paulo, SP, Brazil. 2. Department of Ophthalmology, Santa Casa Misericórdia de São Paulo, São Paulo, SP, Brazil.
Submitted for publication: January 23, 2018 Accepted for publication: April 10, 2018
Funding: No specific financial support was available for this study.
Disclosure of potential conflicts of interest: None of the authors have any potential conflicts of interest to disclose.
Corresponding author: Hirlana Gomes Almeida.
Av. Dr. Enéas Carvalho de Aguiar, 255/6119 - São Paulo, SP - 05403-000 - Brazil E-mail: [email protected]
ABSTRACT | A retrospective and analytical study was conducted by using data from the National Transplantation System on 184,575 corneal transplantations performed between January 2001 and December 2016 in order to analyze the trends in corneal transplantation from 2001 to 2016 in Brazil. The Cochran-Armitage test, analysis of variance, and Duncan’s multiple comparisons were used to verify the existence of trends, compare the mean values between regions, and verify the mean differences, respectively. A significance level of 5% was used for all tests. The analysis showed that there was a 2.4-fold increase in the number of corneal transplantations (from 6,193 [35.2 per million people (pmp)] to 14,641 [71 pmp]; p<0.001), a 50.7% increase in the efficacy of meeting the population’s demand for corneal transplantation (from 35.3% to 53.2%; p<0.001), an 11-fold increase in the number of corneal transplantation centers (from 32 to 356), and a 2.5-fold increase in the number of corneal transplantation teams (from 276 to 688) in Brazil during the period studied. The waiting list for corneal transplantation decreased by 45.4% (from 23,549 [123 pmp] to 12,865 [62.4 pmp]; p<0.001), and the corneal transplantation teams performed about 19 corneal transplantations per year. The best indices were observed in the southern, midwestern, and southeastern regions, and the worst indices were in the northern and northeastern regions. Brazil has been improving its capacity to perform corneal transplantation in the past 16 years, although this improvement varies across regions. However, the population’s demand for corneal transplantation is yet to be satisfactorily met, primarily due to the low number of corneal donations.
Keywords: Health profile; Corneal diseases; Corneal transplan-tation; Directed tissue donation; Brazil
RESUMO | Estudo retrospectivo e analítico, baseado em dados do Sistema Nacional de Transplantes de 184.575 transplantes de córnea realizados no período de janeiro de 2001 a dezembro de 2016, com o objetivo de analisar as tendências do transplante de córnea no Brasil de 2001 a 2016. Os testes de Cochran-Armitage, análise de variância e comparações múltiplas de duncan foram realizados para verificar a existência de tendência, comparação de médias entre regiões e verificação da diferença média, respectivamente. Um nível de significância de 5% foi utilizado em todos os testes. No Brasil, houve um aumento: de 2,4 vezes no número de transplantes de córnea (de 6.193 [35,2 pmp] para 14.641 [71 pmp] - p<0,001); de 50,7% na eficácia de atender a demanda populacional de transplantes de córnea (de 35,3% para 53,2% - p<0,001); de 11 vezes no número de centros de transplantes de córnea (de 32 para 356); e de 2,5 vezes no número de equipes transplantadoras de córnea (de 276 para 688). A lista de espera para o transplantes de córnea diminuiu em 45,4% (de 23.549 [123 pmp] para 12.865 [62,4 pmp] - p<0,001). A produtividade das equipes de córnea ao longo dos anos foi de 19 transplantes de córnea ao ano. Os melhores índices foram apresentados nas regiões Sul, Cen-tro-Oeste e Sudeste e os piores no Norte e Nordeste. O Brasil, embora de forma heterogênea entre as regiões, vem melhorando a capacidade de realizar o transplante de córnea nos últimos 16 anos, porém a demanda populacional por transplante de córnea ainda não é adequadamente atendida, principalmente devido ao baixo número de doações de córnea.
Descritores: Perfil de saúde, Doenças da córnea; Transplante de córnea; Doação dirigida de tecido; Brasil
INTRODUCTION
Corneal diseases account for about 4%-5% of rever-sible blindness worldwide(1-2). If not properly treated,
Corneal transplantation (CT), an effective treatment for several serious corneal diseases, primarily aims at res toring corneal transparency(7-9). Good postoperative
visual results are attributed to the use of advanced surgi-cal paraphernalia such as wires with thinner diameters, thinner needles, precise surgical materials, surgical microscopy with good image definition, knowledge of endothelial function, and femtosecond laser(10-12).
The United States is a world reference for performing CT: In 2016, 62 eye banks were registered, 136,318 corneas were donated, and 82,994 CTs were performed in the country. The Eye Bank Association of America, founded in 1961, is a not-for-profit organization of eye banks dedicated to the restoration of sight through the promotion and advancement of eye banking(13). In the
United States, patients pay for the processing and trans-plantation costs either out of pocket or through health insurance plans, with the exception of very poor pa-tients who benefit from government programs(14).
Founded in 1997, the Sistema Nacional de Transplantes (SNT) is part of the Brazil’s Ministry of Health responsi-ble for the control and monitoring of all stages of CT(15).
The Sistema Único de Saúde (SUS), Brazil’s publicly funded healthcare system, finances more than 95% of transplantations and provides a partial subsidy on im-munosuppressive drugs for all patients. The SUS covers the entire cost of the family interview, recovering a healthy cornea, and processing the recovered cornea by the eye bank; under no circumstances does the patient pay for a donated cornea. Patients who choose to undergo sur-gery outside the accredited SUS network can use their health insurance or pay out of pocket. Over the years, the official amount paid by the Brazilian government has remained the same despite high inflation rates(14).
In the Brazilian literature, few studies have investigated the process of donation, collection, storage, and distri-bution of tissues in Brazil for the purpose of identifying errors, minimizing difficulties, and improving national results(14,16-22).
This review aims to analyze the trends in CT from 2001 to 2016 in Brazil.
METHODS
This study adhered to the tenets of the Declaration of Helsinki and was approved by the Institutional Review Board/Ethics Committee of the Hospital das Clínicas da Faculdade de Medicina da Universidade de São Paulo (protocol number 099/14, session 04/16/2014).
A descriptive, retrospective database review was per-formed by the author between October and December 2017. The data for 184,575 corneal transplants perfor-med between January 2001 and December 2016 were retrieved from the computer database of SNT(15).
The following variables were analyzed in Brazil and Brazilian regions for each year: (1) number of CTs; (2) number of CTs per million people (pmp); (3) number of CT centers; (4) number of CT teams; (5) number of individuals on the waiting list for CT in December; and (6) number of individuals on the waiting list for CT pmp.
The Brazilian regions studied were categorized as follows: North, Northeast, Midwest, Southeast, and South. These regions are shown in the geographical map of Brazil in appendix 1.
From 2001 to 2009, SNT used the Brazilian popu-lation determined from the 2000 Brazilian Institute of Geography and Statistics (IBGE)(23) census to calculate
pmp rates in Brazil and in the Brazilian regions. The population from 2010 to 2014 was based on the 2010 IBGE census. From 2015 onward, SNT used the modified annual population rate estimated by IBGE. As the popu-lation number interferes directly with the values used and the analysis performed, the TC pmp rate and the number of patients in the waiting list pmp were recal-culated in October 2017 for the present study by taking into consideration the population estimated by the IBGE since 2001, which is closer to reality.
The indicator of the efficacy of meeting the popula-tion demand for CT (DCT) expressed as a percentage was
calculated based on the following ratio: DCT = CT / CT + WL, where CT is the number of CTs performed per year and WL is the number of individuals on the waiting list for CT in December of each year.
The number of patients on the waiting list for CT from 2001 to 2007, necessary to calculate the DCT for those years, was not disclosed by SNT. Therefore, the DCT for those years was not calculated in this study.
The productivity indicator of CT teams (P) was cal-culated based on the following ratio: P = CT/MT, where CT is the number of CTs performed per year and MT is the number of CT teams per year. Decimal places were not included in the productivity indicator of the CT teams; thus, decimal values greater ≥5 were rounded
up and values <5 were not considered. Data that were not provided by SNT are indicated in the tables 1 and 3. Quantitative variables were expressed as absolute values. Trend verification for the series of CT pmp num-ber, waiting list pmp, and DCT was performed by using the Cochran-Armitage test. Comparison of the mean CT pmp number, waiting list pmp, productivity of CT teams, and DCT by region during the period studied was performed by using Analysis of Variance (ANOVA).
When a difference of means was identified, Duncan’s multiple comparisons were used to identify Brazilian regions with different means, maintaining the level of global significance.
A significance level of 5% was used for all statistical tests. The Cochran-Armitage test was performed using the statistical software SAS 9.3 and other analyses were performed using SPSS v20.0. For the construction of charts and tables, Microsoft Excel® 2010 software was used.
RESULTS
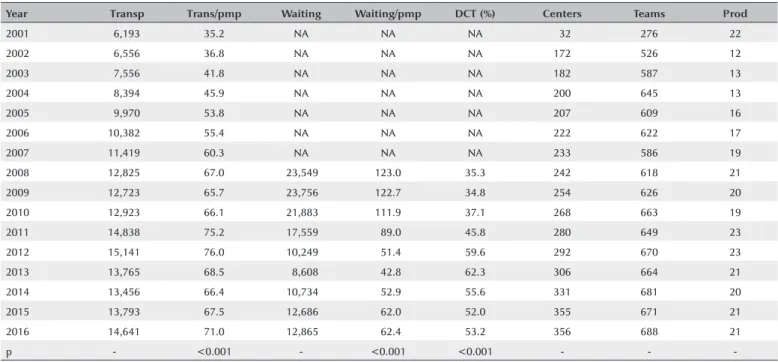
Table 1 shows the number of annual CTs, number of CT pmp, number of individuals on the waiting list for CT, number of individuals on the waiting list for CT pmp, efficacy of meeting the demand for CT (DCT), number of CT centers, number of CT teams, and productivity of CT teams from 2001 to 2016 in Brazil. SNT did not provide data regarding the number of individuals on the waiting list for CT from 2001 to 2007; therefore, it was impossible to calculate the DCT/Y for these years.
There was a 2.4-fold increase in the number of CTs (from 6,193 [35.2 pmp] to 14,641 [71 pmp]; p<0.001)
Table 1. Number of corneal transplantations, number of corneal transplantations per million people, waiting list for the procedure, waiting list for the procedure per million people, efficacy of meeting the demand for corneal transplantation, number of corneal transplantation centers, number of corneal transplantation teams, and productivity of corneal transplantation teams from 2001 to 2016 in Brazil
Year Transp Trans/pmp Waiting Waiting/pmp DCT (%) Centers Teams Prod
2001 6,193 35.2 NA NA NA 32 276 22
2002 6,556 36.8 NA NA NA 172 526 12
2003 7,556 41.8 NA NA NA 182 587 13
2004 8,394 45.9 NA NA NA 200 645 13
2005 9,970 53.8 NA NA NA 207 609 16
2006 10,382 55.4 NA NA NA 222 622 17
2007 11,419 60.3 NA NA NA 233 586 19
2008 12,825 67.0 23,549 123.0 35.3 242 618 21
2009 12,723 65.7 23,756 122.7 34.8 254 626 20
2010 12,923 66.1 21,883 111.9 37.1 268 663 19
2011 14,838 75.2 17,559 89.0 45.8 280 649 23
2012 15,141 76.0 10,249 51.4 59.6 292 670 23
2013 13,765 68.5 8,608 42.8 62.3 306 664 21
2014 13,456 66.4 10,734 52.9 55.6 331 681 20
2015 13,793 67.5 12,686 62.0 52.0 355 671 21
2016 14,641 71.0 12,865 62.4 53.2 356 688 21
p - <0.001 - <0.001 <0.001 - -
-p value= Descri-ptive level of the Cochran-Armitage test for trend.
in the 16 years investigated. The waiting list for the procedure decreased from 23,549 (123 pmp) in 2008 to 12,865 (62.4 pmp) in 2016, which was approxima-tely 45.4% in 8 years (p<0.001). The DCT increased by 50.7% (from 35.3% in 2008 to 53.2% in 2016; p<0.001). There was an 11-fold increase in the number of CT centers (from 32 to 356) and a 2.5-fold increase in the number of CT teams (from 276 to 688). CT teams per-formed an average of 19 CTs per year.
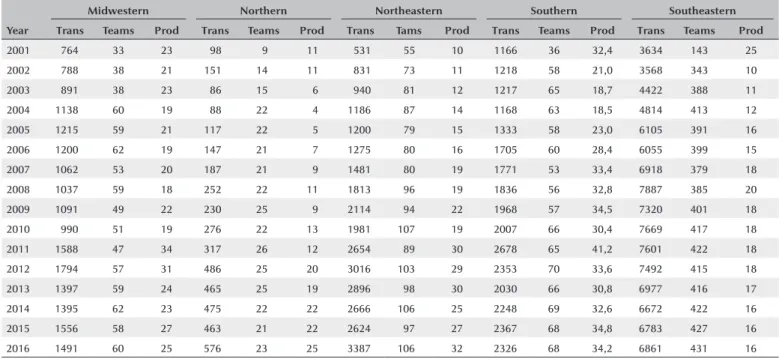
Table 2 shows the number of CTs, as well as the num-ber and productivity of CT teams, per year in Brazilian regions from 2001 to 2016. All Brazilian regions expe-rienced a gradual increase in the number of CTs over a period of 16 years. The number of CT teams doubled on average in all the regions, except for the southeast region where the growth tripled over this period. The average productivity of CT teams remained stable in the midwestern (23) and southern (30) regions, but it increased between 2001 and 2016 in the northern (from 11 to 25) and northeastern (from 10 to 32) regions and decreased in the southeastern region (from 25 to 16) after 16 years.
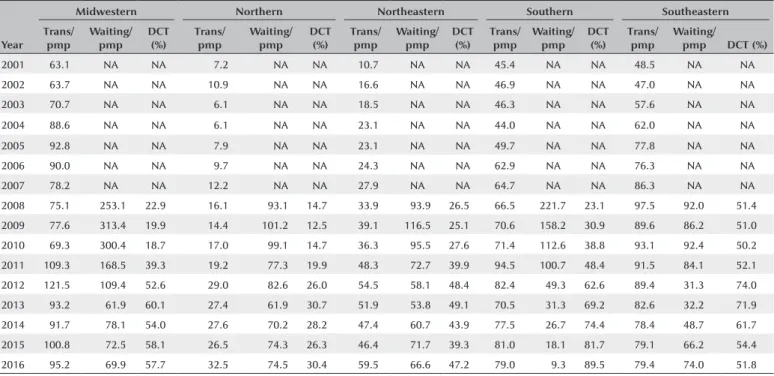
Table 3 shows the number of CT pmp, waiting list for the procedure pmp, and DCT per year in Brazilian regions from 2001 to 2016. All the regions exhibited a gradual increase in the number of CT pmp after 16 years
and a reduction in the waiting list after 9 years. DCT improved the most in the southern region, increasing nearly 4-fold (from 23.1% to 89.5%), while it remained stable in the southeastern region (average of 57.6%). In 2016, the northern, northeastern, and midwestern regions accounted for only 30.3%, 47.2%, and 57.7% of the demand, respectively.
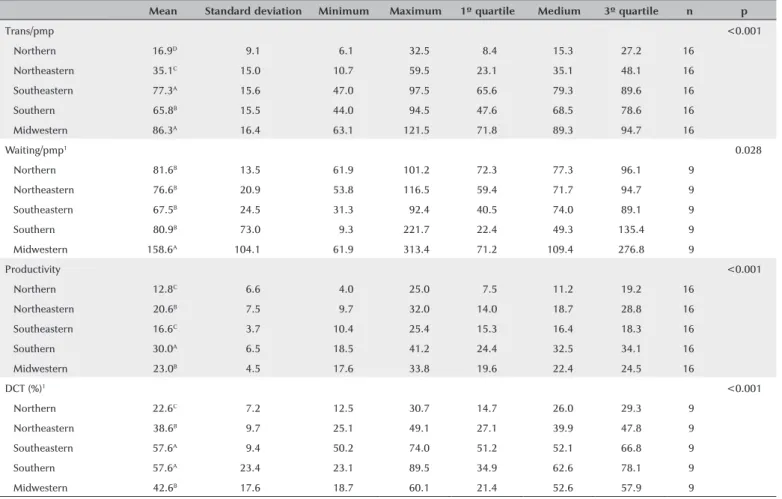
Table 4 shows the summary for the variables evalua-ted: number of CT pmp, waiting list for the procedure pmp, productivity of CT teams, and DCT in Brazilian regions from 2001 to 2016. The average number of CT pmp (p<0.001) in the midwestern (86.3 pmp) and southeastern (77.3 pmp) regions was similar and higher than that in the southern region (65.8 pmp), which was higher than in the northeastern region (35.1 pmp). The northern region had the lowest mean value (16.9 pmp). The midwestern region (158.6 pmp) had the highest mean number of individuals on the waiting list pmp (p=0.028) compared with other regions, which had similar values. The average productivity (p<0.001) in the southern region was the highest (30 CTs per team), followed by the mid-western (23 CTs) and northeastern (20.6 CTs) region, which had similar values. The southeastern (16.6 CTs) and northern (12.8 CTs) regions had the lowest average values. The mean DCT (p<0.001) in the southern and southeastern regions was the same (57.6%) and was
Table 2. Number of corneal transplantations, number of corneal transplantation teams, and productivity of corneal transplantation teams in Brazilian regions from 2001 to 2016
Year
Midwestern Northern Northeastern Southern Southeastern
Trans Teams Prod Trans Teams Prod Trans Tams Prod Trans Teams Prod Trans Teams Prod
2001 764 33 23 98 9 11 531 55 10 1166 36 32,4 3634 143 25
2002 788 38 21 151 14 11 831 73 11 1218 58 21,0 3568 343 10
2003 891 38 23 86 15 6 940 81 12 1217 65 18,7 4422 388 11
2004 1138 60 19 88 22 4 1186 87 14 1168 63 18,5 4814 413 12
2005 1215 59 21 117 22 5 1200 79 15 1333 58 23,0 6105 391 16
2006 1200 62 19 147 21 7 1275 80 16 1705 60 28,4 6055 399 15
2007 1062 53 20 187 21 9 1481 80 19 1771 53 33,4 6918 379 18
2008 1037 59 18 252 22 11 1813 96 19 1836 56 32,8 7887 385 20
2009 1091 49 22 230 25 9 2114 94 22 1968 57 34,5 7320 401 18
2010 990 51 19 276 22 13 1981 107 19 2007 66 30,4 7669 417 18
2011 1588 47 34 317 26 12 2654 89 30 2678 65 41,2 7601 422 18
2012 1794 57 31 486 25 20 3016 103 29 2353 70 33,6 7492 415 18
2013 1397 59 24 465 25 19 2896 98 30 2030 66 30,8 6977 416 17
2014 1395 62 23 475 22 22 2666 106 25 2248 69 32,6 6672 422 16
2015 1556 58 27 463 21 22 2624 97 27 2367 68 34,8 6783 427 16
2016 1491 60 25 576 23 25 3387 106 32 2326 68 34,2 6861 431 16
superior to the values in the midwestern (42.6%) and northeastern (38.6%) regions, which were similar and superior to the northern region (22.6%).
DISCUSSION
The demand for CT has increased due to the po-pulation’s greater knowledge about corneal diseases and the possibility of cure, greater accessibility to health servi-ces, development of less invasive and safer keratoplasty techniques, increasing number of ophthalmologists able to perform transplantations and treat complications, and better visual rehabilitation in the postoperative period(10-12,24-27).
Surgical techniques allowing for selective replace-ment of anterior and posterior pathologic corneal tissue while retaining the healthy parts of the cornea are cur-rently the “state of the art” in CT(28,29). Unfortunately,
in Brazil, the legislative structure is not yet in place to allow eye banks to offer precut anterior and posterior corneal grafts(14).
The indications for CT are distinct across countries and depend on the socioeconomic and demographic conditions of each population(29-36). The main indications
described in the literature are keratoconus(33-35),
infec-tious keratitis, post-infection corneal scars(17,24,32,37,38), and
bullous keratopathy(29,30).
A study conducted by Sobrinho et al.(39) showed
bullous keratopathy as the main indication for CT in the state of Pará (northern region of Brazil). It is believed that in regions where residents experience difficulties in accessing health services, the surgical indication is late and subsequent intumescent cataracts increase the difficulty of surgery and the number of intra- and postoperative complications, including bullous kera-topathy(40). However, this topic requires extensive and
complex discussions, and for that, another article will be needed to discuss it in detail.
Studies conducted in other parts of Brazil, in Latin America, and in Europe revealed keratoconus as the first indication of CT(33-35). Several other causes for
kerato-plasty have also been described in the literature, inclu-ding leukoma, corneal ulcer, graft rejection/failure, des-cemetocele, trachoma, Fuchs’ dystrophy, and congenital anomalies(32-41).
Brazil currently has the largest public organ and tissue transplant program in the world(15). In 2016, there were
53 eye banks in operation in the country, 5 in the mid-western, 4 in the northern, 12 in the northeast, 14 in the south, and 18 in the southeastern regions(42).
Table 3. Number of corneal transplantations per million people, waiting list for the procedure per million people, and efficacy of meeting the demand for corneal transplantation in percentage in Brazilian regions from 2001 to 2016
Year
Midwestern Northern Northeastern Southern Southeastern
Trans/ pmp
Waiting/ pmp
DCT (%)
Trans/ pmp
Waiting/ pmp
DCT (%)
Trans/ pmp
Waiting/ pmp
DCT (%)
Trans/ pmp
Waiting/ pmp
DCT (%)
Trans/ pmp
Waiting/
pmp DCT (%)
2001 63.1 NA NA 7.2 NA NA 10.7 NA NA 45.4 NA NA 48.5 NA NA
2002 63.7 NA NA 10.9 NA NA 16.6 NA NA 46.9 NA NA 47.0 NA NA
2003 70.7 NA NA 6.1 NA NA 18.5 NA NA 46.3 NA NA 57.6 NA NA
2004 88.6 NA NA 6.1 NA NA 23.1 NA NA 44.0 NA NA 62.0 NA NA
2005 92.8 NA NA 7.9 NA NA 23.1 NA NA 49.7 NA NA 77.8 NA NA
2006 90.0 NA NA 9.7 NA NA 24.3 NA NA 62.9 NA NA 76.3 NA NA
2007 78.2 NA NA 12.2 NA NA 27.9 NA NA 64.7 NA NA 86.3 NA NA
2008 75.1 253.1 22.9 16.1 93.1 14.7 33.9 93.9 26.5 66.5 221.7 23.1 97.5 92.0 51.4
2009 77.6 313.4 19.9 14.4 101.2 12.5 39.1 116.5 25.1 70.6 158.2 30.9 89.6 86.2 51.0
2010 69.3 300.4 18.7 17.0 99.1 14.7 36.3 95.5 27.6 71.4 112.6 38.8 93.1 92.4 50.2
2011 109.3 168.5 39.3 19.2 77.3 19.9 48.3 72.7 39.9 94.5 100.7 48.4 91.5 84.1 52.1
2012 121.5 109.4 52.6 29.0 82.6 26.0 54.5 58.1 48.4 82.4 49.3 62.6 89.4 31.3 74.0
2013 93.2 61.9 60.1 27.4 61.9 30.7 51.9 53.8 49.1 70.5 31.3 69.2 82.6 32.2 71.9
2014 91.7 78.1 54.0 27.6 70.2 28.2 47.4 60.7 43.9 77.5 26.7 74.4 78.4 48.7 61.7
2015 100.8 72.5 58.1 26.5 74.3 26.3 46.4 71.7 39.3 81.0 18.1 81.7 79.1 66.2 54.4
2016 95.2 69.9 57.7 32.5 74.5 30.4 59.5 66.6 47.2 79.0 9.3 89.5 79.4 74.0 51.8
The National Organ and Tissue Transplantation Policy is based on laws that guarantee free donation, benefi-cence toward recipients, and non-malefibenefi-cence toward donors(43). Notification of potential donors is required
and should be reported to the Organ Notification, Collection and Distribution Unit (CNCDO), as well as to the eye bank operating in the region. According to the Ministry of Health, the waiting list for transplants is unique in each state of Brazil, and care is given in order of arrival, considering emergency criteria(43).
Brazilian law requires family consent for the removal of organs and tissues for transplant(44). A recent
modifi-cation in the legislation(45) enables authorization of the
donation by family members up to the second degree. Considering the number of cornea pmp donated in 2016, Brazil had a rate of 146.8 pmp, ahead of other
de veloping countries such as Costa Rica (35.1 pmp), Me-xico (26.9 pmp), Uruguay (24.7 pmp), Ecuador (16.8 pmp), Paraguay (12.8 pmp), and Chile (10.1 pmp)(46).
Table 1 shows that the number of corneal transplants performed in Brazil increased from 6,193 in 2001 (35.2 pmp) to 14,641 in 2016 (71.0 pmp), an increase of appro xi-mately 136% over 16 years (p<0.001). The waiting list for the procedure decreased from 23,549 (123 pmp) in 2008 to 12,865 (62.4 pmp) in 2016, approximately 45.4% in 8 years (p<0.001).
According to the Brazilian Association of Organ Trans-plants (ABTO), the estimated annual need for keratoplasty in 2016 was 18,401 transplants (90 pmp)(47). According to
the data shown in table 1, a total of 14,641 transplants (71.0 pmp) were performed in 2016, approximately 20.5% (3,760) less than the ideal number for the country. Table 4. Measures of number of corneal transplantations per million people, waiting list for the procedure per million people, productivity of corneal transplantation teams, and efficacy of meeting the demand for corneal transplantation in percentage in Brazilian regions from 2001 to 2016 in Brazil
Mean Standard deviation Minimum Maximum 1º quartile Medium 3º quartile n p
Trans/pmp <0.001
Northern 16.9D 9.1 6.1 32.5 8.4 15.3 27.2 16
Northeastern 35.1C 15.0 10.7 59.5 23.1 35.1 48.1 16
Southeastern 77.3A 15.6 47.0 97.5 65.6 79.3 89.6 16
Southern 65.8B 15.5 44.0 94.5 47.6 68.5 78.6 16
Midwestern 86.3A 16.4 63.1 121.5 71.8 89.3 94.7 16
Waiting/pmp1 <0.028
Northern 81.6B 13.5 61.9 101.2 72.3 77.3 96.1 9
Northeastern 76.6B 20.9 53.8 116.5 59.4 71.7 94.7 9
Southeastern 67.5B 24.5 31.3 92.4 40.5 74.0 89.1 9
Southern 80.9B 73.0 9.3 221.7 22.4 49.3 135.4 9
Midwestern 158.6A 104.1 61.9 313.4 71.2 109.4 276.8 9
Productivity <0.001
Northern 12.8C 6.6 4.0 25.0 7.5 11.2 19.2 16
Northeastern 20.6B 7.5 9.7 32.0 14.0 18.7 28.8 16
Southeastern 16.6C 3.7 10.4 25.4 15.3 16.4 18.3 16
Southern 30.0A 6.5 18.5 41.2 24.4 32.5 34.1 16
Midwestern 23.0B 4.5 17.6 33.8 19.6 22.4 24.5 16
DCT (%)1 <0.001
Northern 22.6C 7.2 12.5 30.7 14.7 26.0 29.3 9
Northeastern 38.6B 9.7 25.1 49.1 27.1 39.9 47.8 9
Southeastern 57.6A 9.4 50.2 74.0 51.2 52.1 66.8 9
Southern 57.6A 23.4 23.1 89.5 34.9 62.6 78.1 9
Midwestern 42.6B 17.6 18.7 60.1 21.4 52.6 57.9 9
p value= descriptive level of ANOVA.
(A), (B), (C), and (D) present distinct means according to Duncan’s multiple comparisons.
1= Data made available from 2008.
The results showed that the country met 35.3% of the CT (DCT) demand in 2008 and 53.2% in 2016 (Table 1). However, despite the increase of 50.7% over the years, the DCT in Brazil remains low, which contributed to the high number of patients on the waiting list for CT in 2016 (12,865 patients - 62.4 pmp).
In 2001, the Ministry of Health established the Na-tional Program for the Implementation of Tissue Eye Banks, whose purpose was to increase the collection of corneas, shorten the time spent by recipients on the waiting list, and significantly increase the number of CTs performed(48).
The effect of this measure can be observed in the data presented in this study, as the number of CT centers and CT teams increased 11 folds (from 32 to 356) and 2.5 folds (from 276 to 688), respectively (Table 1). The productivity of the CT teams remained constant over the years, with an annual average of 19 CTs per team over 16 years (Table 1).
The obstacle to further progress is not the low num-ber of CTs or the productivity of CT teams, but is probably related to the number of corneal donations, which has yet to meet the needs of the Brazilian population.
Studies emphasize the importance of greater con-version of potential donors to effective donors and, con sequently, increased rates of CT, in order to ensure adequate population assistance(49,50). Prolonged time on
a waiting list has a negative impact on biopsychosocial well-being, cure probabilities, the nature and extent of sequelae in patients, family members, and society(14,51).
The waiting time for CT has been described in the literature for some Brazilian states: in Pará, most pa-tients waited 1 to 3 years for CT(39), while in the states of
Pernambuco(37) and São Paulo(52), the wait was
approxi-mately 4 months.
In some Brazilian states and regions, recruitment teams concentrate their efforts on obtaining the cornea of multiple organ donors, taking action following brain deaths, and mobilization in cases of cardiorespiratory arrest, which are an important source of corneal do-nations. This is an important measure that would help reduce the waiting lists for CT in the country.
Brazilian law establishes(43) a legal requirement to
collect eye tissues only within 6 hours after death or 24 hours if the entire body is kept in a cold room. The proto-col observed by the Eye Bank Association of America(53)
does not establish a period for collecting corneas after death. Rather, it states that ice packs should be used in the orbital area over the eyelids to extend the time limit for enucleation, thus attempting to reduce damage
to eye tissues by toxins that form naturally after death. Because of the legal time limit for collecting corneas in Brazil, many corneas are rejected for donation(14).
With regard to organ and tissue donation, several reasons for family refusal have been documented in the literature, including religious motivations, bureaucracy, lack of credibility of the health system, lack of knowledge of the concept of brain death, and fear of negligent medical treatment to speed up donation(14,53-61). Studies
have shown that the information on CT provided to the population, medical students, physicians, and health pro-fessionals remains insufficient(42,55,62-65).
Therefore, if assisting health professionals and staff involved in the identification of potential donors and family interviews were adequately trained and qualified, the number of tissue donated would likely increase, effectively reducing the waiting lists for CT in the country.
Brazil is a country of continental dimensions with im-portant social, cultural, and economic diversity between regions, which influence the quality of health services provided to the society. Research has shown that although the number of CTs in Brazil has increased over the years, regional differences still need to be resolved. The large number of CTs concentrated in a few states in compa-rison with other populous states in Brazil is worthy of note(14,66).
Tables 2 and 3 show that the number of CTs perfor-med in the northern and northeast regions increased 5 folds in 16 years. However, in 2016, this number accounted
for only 4% (576 CTs − 32.5 pmp) and 23% (3,387 CTs
- 59.5 pmp) of the country’s CT, respectively, while the southeast region accounted for 47% (6,861 CTs - 79.4 pmp) that year. The number of CTs reached a peak of 1,794 (121.5 pmp) in 2012 in the midwestern region, but it has been declining since, reaching 1,491 CT (95.2 pmp) in 2016, the highest value found in Brazil that year.
Nonetheless, all Brazilian regions showed a gradual increase in the number of CT pmp after 16 years (Table 3). Additionally, during the period under study, the average number of CT pmp (p<0.001) in the midwestern (86.3 pmp) and southeastern (77.3 pmp) regions were similar and higher than in the southern region (65.8 pmp), which in turn was higher than in the northeastern region (35.1 pmp). The northern region (16.9 pmp) had the lowest mean value (Table 4).
region and 13% (106) were located in the northeastern region. The southern and midwestern regions had less than 10% each of the teams registered in the country, and there were only 3% teams registered in the country in the norther region (23).
Table 2 shows that the productivity of the CT teams remained stable over the 16 years evaluated in the midwestern (23) and southern (30) regions, but it in-creased between 2001 and 2016 in the northern (from 11 to 25) and northeast (from 10 to 32) regions and de-creased in the southeastern region (from 25 to 16). The latter was due to the high number of teams registered in the region in 2016 (431). During the period under study, the average productivity (p<0.001) was highest in the southern region (30 CTs per team), followed by the midwestern (23 CTs) and northeastern (20.6 CTs) regions, which were similar. The southeastern (16.6 CTs) and northern (12.8 CTs) regions had the lowest average values (Table 4).
It should be noted that the reduced number of CT teams may indirectly represent a lower number of ophthal-mologists capable of diagnosing and treating severe corneal diseases. This would hamper population access to specialized medical care and reduce the number of CT indications, thus falsifying the number of patients on the waiting list.
Kara-Junior et al.(6) described the difficulty of access
to the waiting list, stating that 50% of the patients, es-pecially those with low income and an indication for CT, did not join the queue because they were not correctly oriented, did not understand the information, and did not present socioeconomic conditions necessary to enable treatment and to register effectively on the waiting list for CT.
Table 3 shows that the DCT increased in the southern region, which had a nearly 4-fold increase between 2008 (23.1%) and 2016 (89.5%). The DCT for the southeast region peaked in 2012 (74%) and remained stable afterward (average of 57.6%). In 2016, the northern, northeastern, and midwestern regions accounted for only 30.3%, 47.2%, and 57.7% of the demand, respec-tively. Table 4 shows that the mean DCT (p<0.001) in the southern and southeastern regions was the same (57.6%) and superior to the midwestern (42.6%) and northeastern (38.6%) regions, which were similar and superior to the northern region (22.6%).
All the regions of Brazil had a reduction in the waiting list after 9 years, but the highlight was the southern (6.121 patients [221.1 pmp] to 273 patients [9.3 pmp]) and midwestern (3,497 patients [253.1 pmp] to 1,095
patients [69.9 pmp]) regions, which showed a significant decrease in the queue (Table 3). The number of patients in waiting lists decreased by approximately 1.3 folds in the northern (to 74.5 pmp), northeastern (93.9 to 66.6 pmp), and southeast (92 to 74 pmp) regions. In 2016, 6,388 (74 pmp) patients were awaiting CT in the southeast re-gion, which was equivalent to 50% of the total number of patients in the waiting list in Brazil that year. The midwestern region (158.6 pmp) had the highest mean number of individuals on the waiting list pmp (p=0.028) compared with the other regions, which were similar to each other (Table 4).
This finding probably indicates that patients are migrating from other regions to the state of Goiás, São Paulo, and Federal District, which have a more structu-red transplantation program and provide easier access to health services and treatment to the population com-pared to other Brazilian states.
According to a study by Almeida et al.(39), states in the
northern and northeastern regions of Brazil experience difficulty with temporary contract regimes, high turno-ver of staff in centers, logistical problems, and lack of cooperation between municipal and state governments, often motivated by political differences. Thus, difficul-ties with corneal donation and transplants identified in these regions are consequences of recent and poorly structured transplant programs, lack of qualified profes-sionals, and limited resources for infrastructure invest-ment, resulting in low rates of notification of potential donors, corneal uptake, and CTs performed(47).
These regions and states with lower CT rates in Brazil require a greater number of Intra-Hospital Commission on Organ and Transplant Tissue Donation (CIHDOTT) and Organ and Tissue Procurement Organizations that are capable of identifying potential donors, conducting a proper family interview, and increasing the number of accepted donations of organs and tissues.
The greatest number of CTs is concentrated in the southeastern, midwestern, and southern regions of Brazil, where programs are better structured, are more establi-shed, receive support from the local government, and have better prepared medical teams, all of which clearly contribute to facilitating access to health services and improving care for the population(47).
proce-dures performed. The resources allocated to banks must be sufficient to cover the costs of purchasing equipment, consumables, means of preservation, transport system, communication, hiring of human resources for 24-hour operation, and provision of quality service to society.
It is also essential to strengthen SNT and to standar-dize the data made available to the public, health pro-fessionals, ophthalmology society, and the government to ensure proper reporting of annual variables so that more detailed research can be conducted in Brazil. This would make it possible to improve the capacity to meet the annual demand for corneal transplants, drastically reducing the time and number of patients in corneal transplant waiting lists.
This study also emphasizes the importance of increa-sing the awareness of the Brazilian population through information about CT. It is necessary to act in the media to publicize and promote the donation of organs and tissues, emphasizing the capacity of this humanitarian act to save and improve the quality of life for the patients treated, their families, and society in general.
In addition, we reinforce the importance of develo-ping new studies in the Brazilian regions and states in order to create a detailed national overview of corneal transplants, identify local difficulties, and suggest spe-cific solutions capable of overcoming social, cultural, and economic barriers to CT progress in the donation, capture, storage, and distribution of corneas in Brazil and Brazilian regions.
REFERENCES
1. Pascolini D, Mariotti SP. Global estimates of visual impairment: 2010. Br J Ophthalmol. 2012;96(5):614-8.
2. Foster A, Gilbert C, Johnson G. Changing patterns in global blind-ness: 1988-2008. Community Eye Health. 2008;21(67):37-9. 3. Papadopoulos K. The impact of individual characteristics in
self-es-teem and locus of control of young adults with visual impairments. Res Dev Disabil. 2014;35(3):671-5.
4. Papadopoulos K, Papakonstantinou D, Montgomery A, Solomou A. Social support and depression of adults with visual impairments. Res Dev Disabil. 2014;35(7):1734-41.
5. van der Aa HP, Comijs HC, Penninx BW, van Rens GH, van Nispen RM. Major depressive and anxiety disorders in visually impaired older adults. Invest Ophthalmol Vis Sci. 2015;56:849-54. 6. Kara-Junior N, Mourad PCA, Espíndola RF, AbilRuss HH.
Expecta-tion and knowledge among patients with keratoplasty indicaExpecta-tion. Rev Bras Oftalmol. 2011;70(4):230-4.
7. Brunette I, Roberts CJ, Vidal F, Harissi-Dagher M, Lachaine J, She-ardown H, et al. Alternatives to eye bank native tissue for corneal stromal replacement. Prog Retin Eye Res. 2017;59:97-130. 8. Tan DT, Dart JK, Holland EJ, Kinoshita S. Corneal transplantation.
Lancet. 2012;379(9827):1749e61.
9. Ple-Plakon PA, Shtein RM. Trends in corneal transplantation: indi-cations and techniques. Curr Opin Ophthalmol. 2014;25(4):300-5.
10. Anshu A, Price MO, Price FW. Risk of corneal transplant rejection significantly reduced with Descemet’s membrane endothelial ke-ratoplasty. Ophthalmology. 2012;119(3):536-40.
11. Park CY, Lee JK, Gore PK, Lim CY, Chuck RS. Keratoplasty in the United States: A 10-Year Review from 2005 through 2014. Ophthalmology. 2015;122(12):2432-42.
12. Duman F, Kosker M, Suri K, Reddy JC, Ma JF, Hammersmith KM, Nagra PK, Rapuano CJ. Indications and outcomes of corneal transplantation in geriatric patients. Am J Ophthalmol. 2013; 156(3):600-7.
13. Eye Bank Association of America. Statistics. 2016. [Internet]. Washington (DC): Eye Bank Association of America; 2016. [cited 2018 May 1]. Available from: https://restoresight.org/who-we-are/ statistics/
14. Bonfadini G, Roisman V, Prinz R, Sarlo R, Rocha E, Campos M. Donation and waiting list for corneal transplantation in the State of Rio de Janeiro. Rev Bras Oftalmol. 2014;73(4):237-42.
15. Brasil. Ministério da Saúde. Sistema Nacional de Transplantes [Internet]. [citado 2018 Maio 26]. Disponível em: http://portalms. saude.gov.br/acoes-e-programas/doacao-transplantes-de-orgaos/ servicos/estatisticas
16. Zantut F, Holzchuh R, Boni RC, Mackus EC, Zantut PR, Nakano C, Lui Netto A, Hida RY. Comparative analysis of the donor cornea quality and of the interval between death and preservation before and after new sanitary and technique rules in a University Eye Bank. Arq Bras Oftalmol. 2012;75(6):398-401.
17. Barbosa AP, Almeida Júnior GC, Teixeira MF, Barbosa JC. [Evalua-tion of penetrating keratoplasty indica[Evalua-tions in inner part of the São Paulo state]. Rev Bras Oftalmol. 2012;71(6):353-7. Portuguese. 18. Marcomini LAG, Sobral RMGR, Seixas GO, Faria e Sousa SJ. Corneal
selection for transplants. Rev Bras Oftalmol. 2011;70(6):430-6. 19. Hilgert CVR, Sato EH. Management performance of eye banks
and its impact on those organizations results. Rev Bras Oftalmol. 2012;71(1):28-35.
20. Knihs NS, Roza BA, Schirmer J, Ferraz AS. Application of Spanish quality instruments about organ donation and transplants valida-ted in pilot hospitals in Santa Catarina. J Bras Nefrol. 2015;37(3): 323-32.
21. Sano RY, Sano FT, Dantas MC, Lui AC, Sano ME, Lui Neto A. Analysis of the transplanted corneas at Santa Casa de São Paulo Eye Bank. Arq Bras Oftalmol. 2010;73(3):254-8.
22. dos Santos CG, Pacini KM, Adán CB, Sato EH. Discarding causes of cornea collected by eye bank of São Paulo hospital in two years. Rev Bras Oftalmol. 2010;69(1):18-22.
23. Instituto Brasileiro de Geografia e Estatística (IBGE). [Internet]. [cita-do 2018 Maio 26] Disponível em: https://www.ibge.gov.br/ 24. Gogia V, Gupta S, Titiyal JS, Panda A, Pandey RM, Tandon R. A
prelimi-nary descriptive analysis of Corneal Transplant Registry of National Eye Bank in India. Cont Lens Anterior Eye. 2014; 37(2):111-5. 25. Röck T, Bramkamp M, Bartz-Schmidt KU, Röck D. Organ
transplan-tation scandal influencing corneal donation rate. Int J Ophthalmol. 2017;10(6):1001-3.
26. Sharma B, Shrivastava U, Kumar K, Baghel R, Khan F, Kulkarni S. Eye Donation Awareness and Conversion Rate in Hospital Cornea Retrieval Programme in a Tertiary Hospital of Central India. Journal of Clinical and Diagnostic Research. 2017;11(8):12-5.
27. Flockerzi E, Maier P, Böhringer D, Reinshagen H, Kruse F, Cursiefen C, et al. Trends in corneal transplantation from 2001 to 2016 in Germany: a report of the dog-section cornea and its keratoplasty registry. Am J Ophthalmol. 2018;188:91-8.
29. Cheng YY, Visser N, Schouten JS, Wijdh RJ, Pels E, van Cleynen-breugel H, et al. Endothelial cell loss and visual outcome of deep anterior lamellar keratoplasty versus penetrating keratoplasty: a randomized multicenter clinical trial. Ophthalmology. 2011; 118(2):302-9.
30. Inoue K, Amano S, Oshika T, Sawa M, Tsuru T. A 10-year review of penetrating keratoplasty. Jpn J Ophthalmol. 2000;44(2):139-45. 31. Zare M, Javadi MA, Einollahi B, Karimian F, Rafie AR, Feizi S, et al.
Changing indications and surgical techniques for corneal trans-plantation between 2004 and 2009 at a tertiary referral center. Middle East Afr J Ophthalmol. 2012;19(3):323-9.
32. Qu LJ, Xie LX. Changing indications for lamellar keratoplasty in Shandong, 1993 - 2008. Chin Med J (Engl). 2010;123(22):3268-71. 33. Wang J, Hasenfus A, Schirra F, Bohle RM, Seitz B, Szentmary N.
Changing indications for penetrating keratoplasty in Homburg/ Saar from 2001 to 2010--histopathology of 1,200 corneal buttons. Graefes Arch Clin Exp Ophthalmol. 2013;251(3):797-802. 34. Ting DS, Sau CY, Srinivasan S, Ramaesh K, Mantry S, Roberts F.
Changing trends in keratoplasty in the West of Scotland: a 10-year review. Br J Ophthalmol. 2012;96(3):405-8.
35. Tan JC, Holland SP, Dubord PJ, Moloney G, McCarthy M, Yeung SN. Evolving indications for and trends in keratoplasty in British Columbia, Canada, from 2002 to 2011: a 10-year review. Cornea. 2014;33(3):252-6.
36. Zhang AQ, Rubenstein D, Price AJ, Cote E, Levitt M, Sharpen L, et al. Evolving surgical techniques of and indications for corneal transplantation in Ontario: 2000 - 2012. Can J Ophthalmol. 2013; 48(3):153-9.
37. Almeida HG, Souza AC. Epidemiological profile of patients waiting for penetrating keratoplasty in state of Pernambuco - Brazil. Rev Bras Oftalmol. 2014;73(1):28-32.
38. Neves RC, Boteon JE, Santiago AN. [Indications for penetrating corneal graft at the São Geraldo Hospital of Minas Gerais Federal University]. Rev Bras Oftalmol. 2010;69(2):84-8. Portuguese. 39. de Almeida Sobrinho EF, Negrão BC, Almeida HG. Epidemiological
profile of patients waiting for penetrating keratoplasty in state of Pará, Brazil. Rev Bras Oftalmol. 2011;70(6):384-90.
40. Kara-Junior N, Santhiago MR, Kawakami A, Carricondo P, Hida WT. Mini-rhexis for white intumescent cataracts. Clinics (São Paulo). 2009;64(4):309-12.
41. Tonhá CD, Santos AM, de Souza JC, Muniz MC. [Retrospective study of corneal transplants in the state of Alagoas]. J Bras Transpl. 2010;13:1316-19. Portuguese.
42. Agência Nacional de Vigilância Sanitária (ANVISA). Relatório de Avaliação dos Dados de Produção dos Bancos de Tecidos-Ano 2016 [Internet]. [citado 2018 Maio 28]. Disponível em: http:// portal.anvisa.gov.br/sangue-tecidos-celulas-e-orgaos
43. Brasil. Ministério da Saúde. Portaria nº 2.600, de 21 de Outubro de 2009. Aprova o Regulamento Técnico do Sistema Nacional de Transplantes. Brasília (DF): Diário Oficial da República Federativa do Brasil, 2009 Out 22.
44. Brasil. Ministério da Saúde. Lei nº 10.211, de 23 de Março de 2001. Altera dispositivos da Lei no 9.434, de 4 de fevereiro de 1997, que “dispõe sobre a remoção de órgãos, tecidos e partes do corpo humano para fins de transplante e tratamento. Brasília (DF): Diário Oficial da República Federativa do Brasil; 2001 Mar 24.
45. Brasil. Ministério da Saúde. Decreto nº 9.175, de 18 de Outubro de 2017. Regulamenta a Lei nº 9.434, de 4 de fevereiro de 1997, para tratar da disposição de órgãos, tecidos, células e partes do corpo humano para fins de transplante e tratamento. Brasília (DF): Diário Oficial da República Federativa do Brasil; 2017 Out 19. 46. Rocon PC, Ribeiro LP, Scárdua RF, de Almeida AV, Gomes LM,
Aze-redo HC, et al. Main causes of nonfulfillment of corneal donation in five hospitals of a Brazilian state. Transplant Proc. 2013;45(3):1038-42.
47. Associação Brasileira de Transplantes de Órgãos. Dimensionamen-to dos transplantes no Brasil e em cada estado. RBT [Internet]. 2016; 22(4):1-100. [citado 2018 Maio 1]. Disponível em: http://www.abto. org.br/abtov03/Upload/file/RBT/2016/RBT2016-leitura.pdf
48. Brasil. Ministério da Saúde. Portaria nº 1.559, de 06 de Setembro de 2001. Criar, no âmbito do Sistema Nacional de Transplantes, o Programa Nacional de Implantação/Implementação de Bancos de Olhos. Brasília (DF): Diário Oficial da República Federativa do Brasil; 2001 Set 7.
49. Mello GH, Massanares TM, Guedes GB, Wasilewski D, Moreira H. [Study of cornea potential donors at the Clinical Hospital of UFPR]. Rev Bras Oftalmol. 2010;69(5):290-3. Portuguese.
50. Farias RJM, Sousa LB. [Marketing role of corneal graft tissue dona-tion to an eye bank and donors’ socioeconomic profile]. Arq Bras Oftalmol. 2008;71(1):28-33. Portuguese.
51. Marinho A. [A study on organ transplantation waiting lines in Brazil’s Unified National Health System]. Cad Saúde Pública. 2006; 22(10):2229-39. Portuguese.
52. Oliveira LA, Corrêa BS, Almeida Junior GC, Ferrari MT, Kashiwabuchi LK. [Influence of a single regional list for corneal transplantation on the eye bank of a university hospital]. Arq Bras Oftalmol. 2003; 66(5):631-5. Portuguese.
53. Eye Bank Association of America. Donor maintenance protocol. Ocular tissue donor maintenance. Procedures manual [Internet]. 2008. [cited 2018 May 28]. Available from: http://restoresight.org/ wp-content/uploads/2016/07/Procedures-Manual-June-2016.pdf 54. Röck D, Wude J, Yoeruek E, Bartz-Schmidt KU, Röck T. Evaluation
of factors limiting corneal donation. Ann Transplant. 2016;21:701-7. 55. Hermann KC, Pagnussato F, Franke CA, de Oliveira MB. Reasons
for family refusal of ocular tissue donation. Transpl Proc. 2014; 46(6):1669-71.
56. Martínez-Cantullera AN, Pinuaga C. Obtaining corneal tissue for keratoplasty. Arch Soc Esp Oftalmol. 2016;91(10):491-500. 57. Lawlor M, Kerridge I. Anything but the eyes: culture, identity, and
the selective refusal of corneal donation. Transplantation. 2011; 92(11):1188-90.
58. Dell Agnolo CM, de Freitas RA, Toffolo VJ, de Oliveira ML, de Almeida DF, Carvalho MD, et al. Causes of organ donation failure in Brazil. Transplant Proc. 2012;44(8):2280-2.
59. Lawlor M, Kerridge I, Ankeny R Dobbins TA. Specific unwillingness to donate eyes: the impact of disfigurement, knowledge and procu-rement on corneal donation. Am J Transplant. 2010;10(3):657-63. 60. Lee A, Ni MY, Luk AC, Lau JK, Lam KS, Li TK, et al. Trends and
determinants of familial consent for corneal donation in Chinese. Cornea. 2017;36(3):295-9.
61. Uhlig CE, Koch R, Promesberger J, Hirschfeld G, Schmidt H, Seitz B, Reinhard T, Böhringer D. Attitudes toward postmortem cornea donation in Germany: a multicenter survey. Graefes Arch Clin Exp Ophthalmol. 2014;252(12):1955-62.
62. Afshar R, Sanavi S, Rajabi MR. Attitude and Willingness of High School Students toward Organ Donation. Saudi J Kidney Dis Transpl. 2012;23(5):929-33.
63. Ronanki VR, Sheeladevi S, Ramachandran BP, Jalbert I. Awareness regarding eye donation among stakeholders in Srikakulam district in South India. BMC Ophthalmology. 2014, 14:25.
64. Alsaied O, Bener A, Al-Mosalamani Y, Nour B. Knowledge and Attitudes of Health Care Professionals Toward Organ Donation and Transplantation. Saudi J Kidney Dis Transpl. 2012;23(6):1304-10. 65. Singh MM, Rahi M, Pagare D, Ingle GK. Medical students’ percep-tion on eye donapercep-tion in Delhi. Indian J Ophthalmol. 2007;55(1): 49-53.