Nintendo’s Pursuit for Profitability: A Pedagogical
Case Study
Cláudio R. K. de Almeida
Project presented in partial fulfillment of the requirements for the degree of Master of Science in Business Administration
Supervisor
Prof. Marjan Sara Jalali, ISCTE Business School, Departamento de Marketing, Operações e Gestão Geral
Co-supervisor
Prof. Ana Lúcia Henriques Martins, ISCTE Business School, Departamento de Marketing, Operações e Gestão Geral
- Spine -
N
in
ten
do
’s
Pur
su
it
fo
r Prof
it
ab
il
it
y:
A Pe
dag
og
ica
l Ca
se St
ud
y
C
lá
ud
io
R
.
K.
de
A
lm
ei
da
ii The home video game console industry, like most high technology industries, is characterized by fast innovation, intense competition and a generally volatile environment. Since the mid-1990s, this industry has essentially been dominated by three major companies, Nintendo, Sony and Microsoft.
However, in recent years (since 2012) Nintendo’s performance has been below expectations, with revenues falling, negative operating income for the last three years, and falling share prices. As a result, Nintendo’s management has started, especially since the second half of 2014, a concerted effort to improve the company’s fortunes. At the moment these efforts have resulted in better media coverage and a stop in share price fall.
It is still early to know if Nintendo’s pursuit for profitability will succeed; nonetheless, it is both of import and interest to understand how companies seek to achieve superior performance, which is why Nintendo was chosen to be analyzed.
The aim of this project is to conduct a pedagogical case study on Nintendo, with a focus on how the company is attempting to return to profitability in the midst of intensified competition from its main rivals, Sony and Microsoft, and a growing threat from substitute products, namely mobile gaming.
Through the case study and the request for a strategic analysis, the project will present its target audience – management undergraduate students – an opportunity to understand Nintendo and its industry; as well as, give them the chance to put into practice some strategic management concepts and frameworks, which may prove to be useful in both their academic and professional careers.
Key Words:
Mark-Based View; Resource-Based View; sustainable competitive advantage; Nintendo. Classification JEL System:
M10: General Business Administration
iii A indústria de consolas de jogos de vídeo, como a maioria das indústrias baseadas em alta technologia, é caracterizada pela inovação rápida, competição intensa e um ambiente geralmente volátil. Desde meados de 1990 que esta indústria é essencialmente dominada por três grandes empresas, a Nintendo, a Sony, e a Microsoft.
No entanto, nos últimos anos (desde 2012) o desempenho da Nintendo tem estado aquém das expetativas: com queda nas receitas; resultados operacionais negativos nos últimos três anos; e queda na cotação das ações em bolsa. A administração da Nintendo começou, especialmente desde o segundo semestre de 2014, um esforço concertado para melhorar a situação da empresa. Neste momento, tais esforços resultaram em uma melhoria na forma como a empresa é retratada nos media e na paragem da queda do preço das ações.
Ainda é cedo para se saber se a busca da Nintendo pela lucratividade será bem sucedida; no entanto, importa e interessa entender como as empresas procuram alcançar resultados superiores, e esta é a razão pela qual a Nintendo foi escolhida para análise.
O objective deste projeto é a realização de um estudo pedagógico sobre a Nintendo, com realce na forma como a empresa tenta voltar à lucratividade em meio a intensa competição com os seus principais rivais, Sony e Microsoft, e a crescente ameaça de produtos substitutos, como os jogos em telemóveis ou tablets.
Através do caso de estudo e a realização da análise estratégica, o projecto apresentará à sua audiência – estudantes da licenciatura em gestão – a oportunidade de entender a Nintendo e a sua indústria; e dar-lhes-á a oportunidade de praticarem alguns conceitos e ferramentas de gestão estratégica, eventualmente úteis nas suas vidas académicas e futuras carreiras.
Palavras-chave:
Visão baseada no mercado; visão baseada nos recursos; vantagem competitiva sustentável; Nintendo.
Sistema de Classificação JEL:
M10: General Business Administration
iv My special thanks to:
Mr. João Bento da Silva Neto My teachers:
- Marjan Sara Fonseca Jalali - Ana Lúcia Henriques Martins
v
Abstract ii
Resumo iii
Acknowledgements iv
Table of Contents v
Index of Tables vii
Index of Figures viii
List of Abbreviations ix
1. Introduction 1
2. The Case Study 3
2.1. Case Description 3
2.2. The Video Game Console Industry – Historical Overview 4
2.3. Nintendo 14 2.3.1. Company History 14 2.3.2. Organizational Structure 15 2.3.3. Products 16 2.3.4. Challenges 18 2.3.5. Industry Positioning 20 2.3.6. Business Model 20
2.3.7. Resources and Competencies 21
2.3.8. Key Stakeholders 22
vi
3.1. Intended Audience 25
3.2. Pedagogical Objectives 25
4. Theoretical Framework - Literature Review 27
4.1. The Concept of Strategic Management 27
4.2. General/External Environment Analysis 28
4.3. Market-Based View (Industry Analysis) 29
4.3.1. The Five Forces and the Value Net frameworks 30 4.3. 2. Porter’s Generic Competitive Strategies 34
4.4. Resource-Based View (Internal Analysis) 38
4.5. The SWOT Analysis 44
5. Methodology 47
6. Case Resolution 49
6.1. Presentation Plan 49
6.2. Proposed Strategic Analysis Questions 52
6.3. Proposed Resolution 54
6.4. Resolutions Slides 72
7. Lessons from the Case Study 75
8. Conclusion 77
vii Table 1: Estimate Global Game Market per Region in 2013 (Values in USD Billion) 10 Table 2: Console Shipment units (in millions) and market share (%) per product and per company as of May 2014________________________________________________10 Table 3: Nintendo’s Revenues and Operating Income 2011-2014________________18 Table 4: Presentation Plan Schedule_______________________________________50 Table 5: Match between the Pedagogical Goals and the Proposed Strategic Analysis Questions____________________________________________________________52 Table 6: Nintendo’s VRIO Analysis – Summary_____________________________64 Table 7: Nintendo’s SWOT Analysis – Summary____________________________ 67
Index of Figures
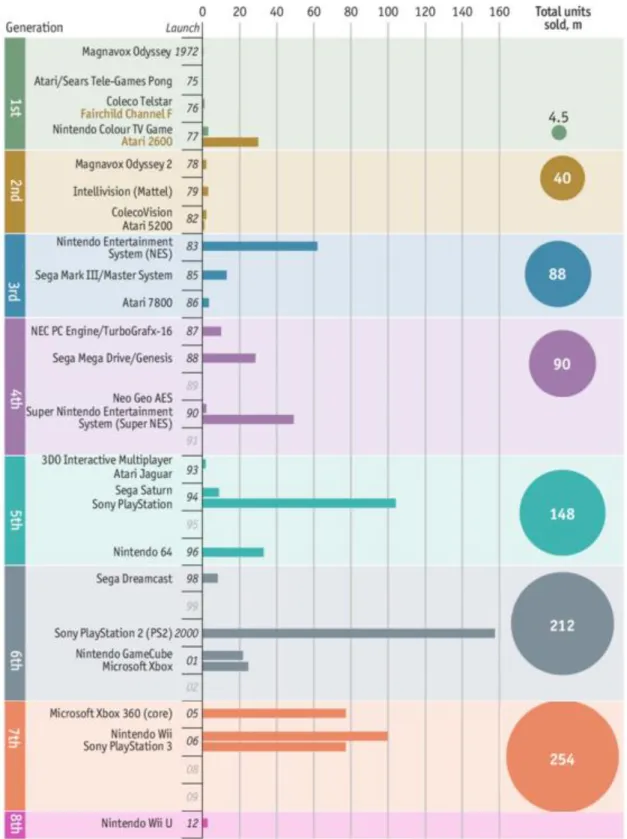
Figure 1: Lifetime total Video Games Console Sold per Generation (millions units)__8 Figure 2: Video Game Console Growth_____________________________________9 Figure 3: Console games revenue (%) and total video game revenue rankings for 2013 and 2018 in five developing countries_______________________________________9 Figure 4: Marchand & Hennig-Turau’s Conceptual Value Creation Framework in the Video Game Industry___________________________________________________11 Figure 5: Console Life Cycle (millions units sold per year) – 2013_______________12 Figure 6: Nintendo’s simplified organizational organogram in 2014______________16 Figure 7: Nintendo’s Revenue from 2011 to February 2014 by Product (In 1000 US Dollars)______________________________________________________________17 Figure 8: Nintendo’s Console Sales from 2008 to 2013 (in millions of units)_______17 Figure 9: Nintendo’s Share Price in the NYSE 2011-2014______________________18 Figure 10: Nintendo’s Business Model Canvas_______________________________21 Figure 11: Porter´s 5 Forces Model________________________________________30 Figure 12: The Value Net Model__________________________________________33 Figure 13: Porter´s Generic Strategies______________________________________34 Figure 14: The Cornerstone of Competitive Advantage________________________40
viii Figure 16: Conceptual SWOT Framework Structure__________________________ 44 Figure 17: The TOWS Framework Conceptual Structure_______________________45
ix BBFC - British Board of Film and Classification
CA&A - Corporate Analysis and Administrative CAGR - Compound Annual Growth Rate CEO - Chief Executive Officer
CES - Consumer Electronics Show E3 - Electronic Entertainment Expo EA – Electronic Arts
EAD - Entertainment Analysis and Development EMEA - Europe-Middle-East-Africa
ESRB - Entertainment Software Rating Board EU - European Union
Famicom - Family Computer
FIFA - International Federation of Association Football (FIFA - Fédération Internationale de Football Association)
GA - General Affairs
GDP - Gross Domestic Product IPO - Initial Public Offering MBV - Market-based view
NES - Nintendo Entertainment System NFC - Near Field Communication NYSE – New York Stock Exchange PEGI - Pan European Game Information
x R&D - Research and Development
RBV - Resource-based view ROB - Robot Operating Buddy SCP - Structure-conduct-performance SPD - Software Planning Development
SWOT - Strengths; Weaknesses; Opportunities; Threats T&E - Technology and Engineering
TV – Television
USA - United States of America USD - United States Dollar
USK - Certification of Entertainment Software (USK – Unterhaltungssoftware Selbstkontrolle)
VCS - Atari Video Computer System VES - Video Entertainment System
VRIO - Value; Rare; Imperfectly Imitable; Organization YOY - Year-on-Yean
1 1. Introduction
The video game console industry is characterized by constant change, innovation and fierce competition (Williams, 2002). One of its most iconic companies is Nintendo (Parr, 2012), a company founded more than 120 years ago, in 1889.
In its 125 year history Nintendo has gone from a company originally founded to manufacture and sell playing cards to a well-recognized technological company, one of the leaders in the highly competitive video game console industry (Fast Company, 2008).
Although innovative and one of the most successful companies in its industry, Nintendo’s fortunes have recently taken a turn for the worse. Faced with changing trends in the industry (such as casual gamers turning to mobile gaming) and strong competition from Sony and Microsoft, Nintendo’s sales and stock prices have been falling (Parr, 2012), and its top management is trying to come up with new strategies to halt the bad results (Schmidt, 2014). The aim of this project is to elaborate a pedagogical case study on Nintendo, and especially focus on the way in which the company is attempting to return to profitability amid intensified competition from its main rivals, Sony and Microsoft, and the rising threat of substitute products (mobile gaming).
It is expected that by analyzing Nintendo’s case, the target audience of this project – management undergraduate students – will have the opportunity to not only gain a deeper knowledge about the industry and company in question, but will also have the opportunity to practice the use of certain strategic management concepts and frameworks, which they will likely find useful in their university courses and future careers.
The strategic management frameworks which students are expected to practice are: the PESTEL analysis; Porter’s five forces; Porter’s competitive generic strategies; the VRIO and SWOT models.
The methodology used to conduct this project is roughly based on the indications of Eisenhardt (1989) and Hamel (1993) for the realization of a case study (detailed in the fifth chapter - Methodology) and the data was gathered from secondary sources.
The reminder of this project is structured in seven chapters. The next presents a historical overview of the video game console industry and that of Nintendo.
2 Chapter three identifies both the intended audience and the pedagogical objectives of the project. The fourth chapter presents the literature review and discusses the Market-Based View (MBV) and Resource-Based View (RBV) theories of superior company performance and presents also the PESTEL; Five Forces; Value Net; Porter’s Generic Strategies; VRIO; SWOT; and TOWS models.
Chapter five, Methodology, indicates how the data for the compilation of the project was obtained and which steps were followed to compile the project. A brief discussion of the case study research method is also presented and a distinction between case study research method and case study teaching approach is offered.
The presentation plan; proposed strategic questions; answers to the proposed questions and resolution slides are presented in the sixth chapter, under the title Case Resolution.
The lessons from the case and managerial implications are presented in the seventh chapter and the limitation and conclusion of the project are discussed in the eighth and last chapter.
3 2. The Case Study
2.1. Case Description
In November 2013, the Bloomberg BusinessWeek website published an article written by Cliff Edwards and Takashi Amano with the title: “Is It Game Over for Video Game Consoles?” The article detailed the increasing survival problems the big three console manufacturers (Nintendo, Sony and Microsoft) face as sales drop sharply and competition increases.
It is not the first time the industry is faced with an apparent death sentence; in fact, the video game console industry is so volatile that there does not appear to be much space for more than a few companies to successfully compete in it at the same time1 (Williams, 2002).
Since the mid-1990s the industry has been dominated by Nintendo, Sony and Microsoft, with market leadership frequently alternating between them as new consoles are released and yearly updates made.
With the exponential developments in technology, changes in customer consumption patterns, such as people playing more games on mobile devices, convergence in the communications, entertainment and information industries (e.g. Google offer all of these services), the current competitive landscape the big three console manufacturers face is vertiginously complex and challenging.
Although its main competitors have also been facing difficult times, Nintendo’s have been worse, with the sales of its latest console, the Wii U, behind those of both Microsoft’s console, the Xbox One and Sony’s console, the PlayStation 4. According to industry analysts, the causes of Nintendo’s problems are not only its direct competitors but also the rise of substitute products such as mobile gaming (White, 2013; and Parr, 2014).
The present case study seeks to describe the dynamics of the video game console market and the strategic choices Nintendo has been making in order to increase revenues, become profitable again and stop the decrease of its stock price.
Next an historical overview of the video game console industry is presented.
1
4 2.2. The Video Game Console industry – Historical Overview
A video game console is an electronic system, also known as a platform, which outputs a series of video and sound signals through a television set to display a video game.2 The video game console market belongs to the technology sector, hardware industry and to the consumer electronics sub-industry3.
The supply side of the video game console market is composed of all the companies that manufacture and distribute video game consoles in addition to allowing third-party publishers to produce games for their consoles in return for a licensing fee. These companies are also known as first-party game publishers.
The idea of the video game console can be traced to the American engineer and inventor Ralp H. Bauer (Kent, 2001), who in the 1960s while working for Sanders Associates, an American defense contractor company (now part of BAE Systems) designed a series of video game consoles. One of Bauer’s designs nicknamed the “Brown Box” was later licensed to Magnavox, an American consumer electronics company founded in 1917 to commercialize loudspeakers.
Magnavox launched the Magnavox Odyssey in 1972. This device, which was the first game platform to be connected to a TV is widely considered to be the first home video game console (Kent, 2001). The Magnavox Odyssey, was very primitive by today’s standards, having no sound and only basic graphics. Beside these technical limitations, there was a lot of mismanagement in the pricing, promotion and distribution of the Odyssey, which undermined its overall success with customers (Kent, 2001).
However, the video game console market was to be successfully explored by another company, Atari. Atari, which is Japanese for “hitting the target”, is an American company which was incorporated in June 27, 1972 by entrepreneurs Nolan Bushenell and Ted Dabney. Atari started by copying Magnavox’s game “pong”4 and launching it on an arcade machine – an entertainment coin operated machine, usually installed in public businesses, such as bars
2 http://www.ralphbaer.com/how_video_games.htm
3 http://www.bloomberg.com/quote/7974:JP
4
5 and restaurants. – This led to the very first law suit in the history of video games5, when Atari was sued by Magnavox and they settled out of court.
The second generation of consoles was inaugurated by another American company, Fairchild, when in 1976 it launched the Fairchild Video Entertainment System (VES). Atari responded by launching the Atari Video Computer System (VCS), which was later renamed the Atari 2600. This console went on to become one of the most successful of its generation.
The success of these early games encouraged many other companies to enter the market, and increasingly undifferentiated supply caused the first video game console market crash in 1977. Companies such as RCA and Fairchild completely left the video game console business while Atari and Magnavox continued, with the former going on to dominate the console market up to the early 1980s.
The 1977 market crash was followed by the 1983 crash; among the causes indicated for this crash are the flood of competing consoles, the competition from computers and effects from inflation (Kent, 2001). This time, American console manufacturers lost market and competitiveness and from here on Atari would never again regain its former glory. This time it would be a Japanese company that would dictate the rebirth of the video game console market with the launch of the first of the third generation consoles, the Famicom, short for Family Computer. The company in question was Nintendo.
In 1983 when Nintendo decided to enter the American console market it was already a successful video game console manufacturer in its home country, Japan. Due to the success of Famicom in Japan, Nintendo concluded that it would also be well accepted in the American market. In the end the investment gave good returns, however, the success was not straight-forward (Kent, 2001).
After failing to successfully reach a licensing deal with Atari, Nintendo decided to enter the American market on its own; and at the June 1985 Consumer Electronics Show (CES) unveiled its Famicom under the name Nintendo Entertainment System (NES). Due to the lack of growth in the American market, the NES was initially marketed as a toy and came accompanied by a robot called the Robot Operating Buddy (ROB) which took the role of a second player. The initial reception was tepid; however, Nintendo’s marketing and management acumen, exemplified by decisions such as the restriction of the number of games
5
6 published by third party developers as well as exclusive games for its console (this practice is now common throughout the industry), transformed the NES into the dominant console of its generation.
The fourth generation of consoles also known as the 16-bit generation (due to the processing capacity of the consoles produced in this period), is very interesting for many reasons; one of these is the fact that in 1988 Nintendo partnered with Sony in order to build a console that used Compact Discs (CDs) instead of the cartridges which were the industry standard. However, in 1991 after almost three years of partnership, and midway through the project, the partnership was terminated due to Sony’s demands for more control (Sheff, 1994). Ironically, it was from the insight developed during this partnership that Sony decided to enter the video game console market and came to become one of Nintendo’s main competitors.
The dominant consoles in the fourth generation were Nintendo’s Super Nintendo Entertainment System (SNES) and Sega’s Mega Drive console also known as the Genesis console.
The most important fact of the fifth generation was essentially the launch of Sony’s PlayStation (PS) console, which established Sony as a major competitor and went on to become the most successful console of its generation. The competition in this generation was mainly between PlayStation (Sony), Nintendo 64 (Nintendo) and Sega Saturn (Sega). The failure of Atari’s Jaguar console sealed the fate of the company as a non-entity in the console business.
This generation also saw the introduction of CD technology. Despite the fact that it is easier to pirate games on CDs, Sony’s initial success can be attributed to this technology because it was cheaper to manufacture, write games on and distribute. Nintendo resisted the adoption of this new technology which alienated some game developers and gave Sony the upper hand (Sheff, 1994).
Xbox, the video game console from Microsoft entered the market in 2001, during the sixth generation, and with its broadband internet capabilities it inaugurated the Xbox LIVE service, which is an online service whereby through the Xbox players can switch to the internet and play and compete with other players all over the world. The Xbox was not the only console of the sixth generation to have an internet connection; in fact, Sega’s Dreamcast console was the first console to have inbuilt capacity for internet connection; however, this console was not
7 successful, and it was the last console from Sega, which after this failure left the console market and became a software/game developer. Some industry analysts (Gifford, 2013) attribute the failure of the Dreamcast to Sega’s uncompetitive cost structure (high fixed cost in relation to its competitors).
Despite Xbox’s entrance and Nintendo’s efforts to produce the GameCube which it expected would dethrone Sony’s dominance acquired in the fifth generation, Sony launched the PlayStation 2, which became a huge success and the most successful video game console of the sixth generation. One innovative feature of the PlayStation 2 which gave it a huge advantage over its competitors was the use of Digital Versatile Discs (DVDs sometimes is also referred to as Digital Video Discs), which allowed for better graphics and contained much more information (Sony, 2011).
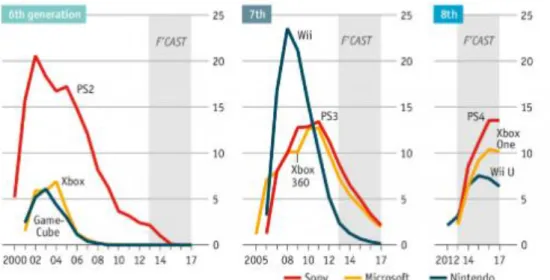
The seventh generation of consoles, which started in 2005 with Microsoft’s launch of the Xbox 360, was completely dominated by Nintendo’s Wii console6
. Unlike the Microsoft Xbox and Sony’s PlayStation 3 which had high technological developments in terms of graphics, sound and raw running power, Nintendo’s Wii innovated in its controller, the Wii Remote. This remote has a technology that senses movement and allows the avatar to mimic the movements the game player does, allowing the player to exercise and move while playing. The innovation was so successful that both Xbox 360 and PlayStation 3 were forced to imitate in their updated versions, the Xbox 360 with Kinect and the PlayStation 3 with PlayStation Move.
The current generation, the eighth, kicked off in 2012 when Nintendo launched the Wii U console, which was followed by Sony’s PlayStation 4 launched on November 15, 2013 and Microsoft’s Xbox One launched on November 22, 2013.
The eighth generation has not arrived with any major technological or conceptual breakthrough. It seems all the major players are trying to consolidate their positioning and find ways to compete better in this changing environment, where hardcore gamers demand ever more realistic graphs; casual gamers move to mobile gaming; and the dawn of virtual reality may have just arrived. Up to the moment, all information indicates that PlayStation 4 is the best-selling of the three (Statista, 2014).
6
8 All the video game console generations described in the text are presented, as a summary, in Figure 1.
9 In the 1960s, the video game console market did not yet exist; today, some valuations put it at about USD 44 billion (Gartner, 2013). From its inception up until at least 2010 the market has enjoyed an average annual growth rate calculated between 9% and 15% (Zackariasson & Wilson, 2010).
As Figure 2 shows, despite the total revenue drop from 2009 to 2012, the market has recovered and the growth trend is expected to continue for the foreseeable future.
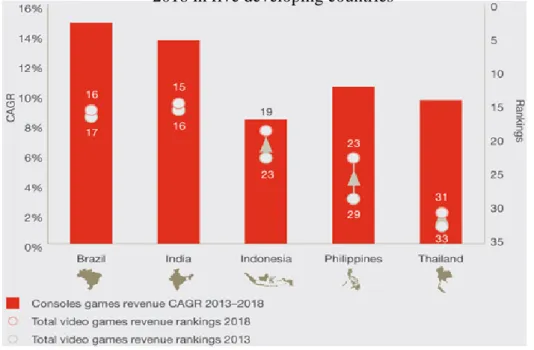
According to PwC and as shown in Figure 3, the sources of most of the future growth are the developing countries, with Brazil and India leading the way.
Figure 2: Video Game Console Growth
Figure 3: Console games revenue (%) and total video game revenue rankings for 2013 and 2018 in five developing countries
Legend: CAGR = Compound Annual Growth Rate
10 However, even though the source of most of the future growth is expected to be from developing countries, the biggest market for consoles is currently the developed world, as seen in Table 1, which represents estimated data from 2013.
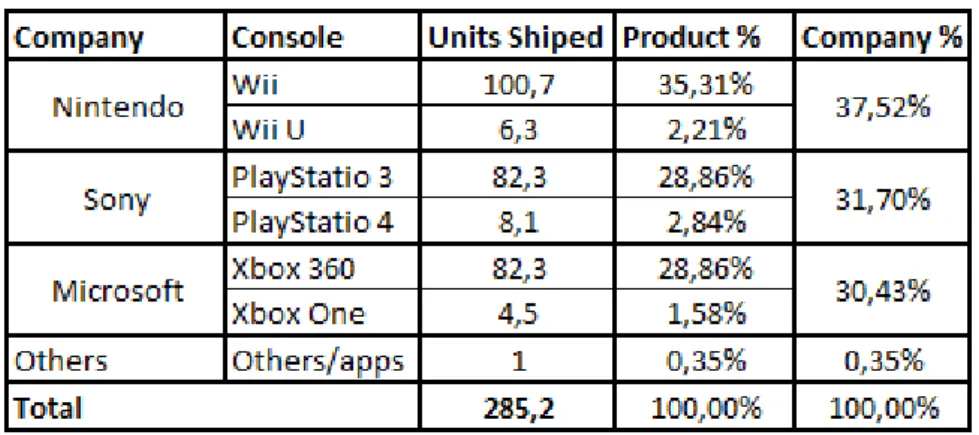
The global market is almost completely dominated by the big three companies in the console market, Nintendo, Sony and Microsoft. There is a perennial leadership change among the three, however, there is no sign that a new entrant may threaten the current market structure. Table 2 shows video game console shipment units (in millions), as well as the percentage of units, in relation to the total, of the last two console generations. This shows how the market is controlled by the referred companies.
There is a complex structural relationship between the current actors in the market. This complex structure is created by a web of relationships which benefits all the current incumbents. Among the various means the industry uses to isolate itself from external competition are the special and exclusive contracts between content producers and console manufacturers (Marchand & Hennig-Thurau, 2013), which prohibit the creation of games for various consoles. Given that the quality and availability of games greatly determines the
Table 1: Estimate Global Game Market per Region in 2013 (Values in USD Billion)
Table 2: Console Shipment units (in millions) and market share (%) per product and per company as of May 2014
Legend: EMEA = Europe-Middle-East-Africa; YOY = Year-on-Year Source: Adapted from Newzoo Global Games Market Report - 2013
11 demand for a console, and that the demand for a console determines the willingness of content providers to produce exclusive games, this creates a kind of virtuous cycle which benefits the companies already in the industry.
As the pressure from customers for more realistic games increases so does the cost of research and development, human resources, promotion and distribution. In fact, producing console games has become as expensive as producing blockbuster movies (Ow quoted in Loftus, 2013; and Williams, 2002).
This structure discourages new entrants and incentivizes the incumbents to preserve the current value creation framework (see Figure 4). Despite this structure, recently two new companies have entered the industry, Ouya and Gamestick. However, their business model are not the same as those of Nintendo, Sony or Microsoft, especially because these two companies allow users to “hack” their games systems and develop their own content. Up to now, these companies do not seen to have the momentum or acceptance in the market to challenge any of the big three companies.
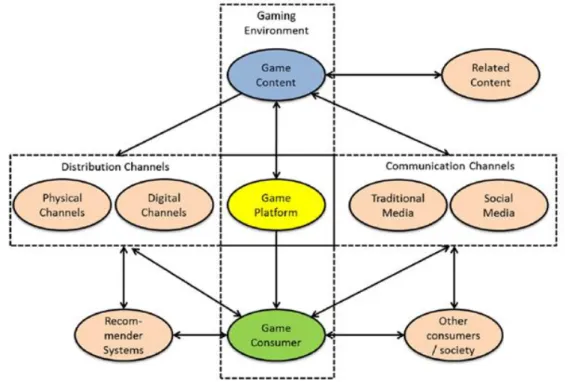
Figure 4 shows a value creation framework – which is the set of all activities involved in the creation of value for the end user (Magretta, 2012) – for the video game industry (Marchand and Hennig-Thurau, 2013). The Figure illustrates that for console manufacturers (game platform) the market is two-sided, with revenue coming both from software providers (game content) and the final consumer (Marchand and Hennig-Thurau, 2013).
Figure 4: Marchand and Hennig-Turau’s Conceptual Value Creation Framework in the Video
12 Another element which characterizes the console business is that besides being a seasonal product (sold mainly during Christmas), it is a “cyclical business” (Ward, quoted in White, 2013), meaning that the supply and demand of specific consoles is determined by the technological capabilities they embody. Another element linked to the technological development of consoles is their life cycle, which is the phenomenon whereby the demand curve for a new product shifts outwards as the product becomes more widely known, but eventually, shifts inward as consumers’ choices move toward other new and improved products (Brickley, Smith and Zimmerman, 2009). Each generation of consoles has its own life cycle (Marchand & Hennig-Thurau, 2013), typically lasting between 6 and 7 years. Figure 5 illustrates the sales life cycles of consoles of the sixth, seventh and eighth generation.
All these market specific nuances make the console market a very singular market. However another relationship which is very important for the console market is the relationship with the community.
Properly stated, the relationship is not exactly a direct one. What causes much debate about the video game industry are not the consoles per se, but the types of games available for them and the pervasive sexism and misogyny in gaming groups which up until recently were mainly composed of men (Parkin, 2014). However, as noted above, the quality and quantity of games available determines the demand for a console and vice-versa; and the number of women playing games has been growing, making about 48% of the gaming population (Grundberg & Hansegard, 2014), their exclusion from pro-gamers community (male dominated professional gaming organizations) may represent a loss in potential sales for
13 console companies. Pressure groups, from feminist groups to concerned mothers, have been lobbing government entities and retailers outlets to ban games depicting offensive content (sex, violence and strong language), especially those containing misogynic undertones (Stuart, 2014).
One of the biggest debates between the game industry and the community in general is with regard to the effects video games have on players’ behaviors. While there are some scholars who stress the positive effects games can have, such as improving the capacity to remember briefly displayed objects, focus on specific activities and sensitivity to information in peripheral vision (Green & Bavelier, 2003), there are also many studies which claim that video games can be a cause of violent behavior (Ferguson, 2013). At the moment, there are no conclusive studies in relation to the behavioral effects of games on players (Ferguson, 2013). In the United States of America (USA) a senate hearing mandated the constitution of and industry self-regulatory body, the Entertainment Software Ratings Board (ESRB). This agency voluntarily provides age-related categories as well as other indications regarding potentially offensive content in games (Ferguson, 2013).
In Europe there are also various institutions which regulate game categories and inherent restrictions. The United Kingdom has the British Board of Film and Classification (BBFC), Germany has the Voluntary Certification of Entertainment Software (USK – Unterhaltungssoftware Selbstkontrolle); and most of the European Union (EU) is regulated by the Pan European Game Information (PEGI).
The legal regulatory obligation for the gaming industry varies from country to country; for instance, while it is not illegal to sell games containing adult content (sex, violence and strong language) to underage children in the USA, it is illegal to do so in most European countries. It can be said that the elements which determine and characterize the video game console industry are brand popularity, technological developments, the symbiotic relationships within the industry and the relationship with the community.
14 2.3. Nintendo
2.3.1. Company History
The Japanese entrepreneur Fusajiro Yamauchi established Nintendo Koppai in 1889 as a company to manufacture and distribute playing cards (Nintendo History, 2014). The Japanese translation for the company name is “luck-heaven-hall” (Kim et al, 2011) although other writers have translated it as “leave luck to heaven” (Sheff, 1994).
Nintendo was very successful at the card business; so much so that in 1951 the company name was changed to Nintendo Playing Cards Co. Ltd. In 1959 it celebrated an agreement with the American company Walt Disney to include Disney characters into its playing cards, and the move was a success.
Even in the midst of its success then president Hiroshi Yamauchi realized that the card market was too small and changed the company name to Nintendo Co., Ltd. to reflect the new business strategy of diversification. One year before the development of this strategy, in 1962, the company made its Initial Public Offering (IPO) both on the Osaka and Kyoto Stock Exchange.
During this phase Nintendo tried various ventures (hotels, taxis, toys, among others). Most of these efforts were unsuccessful and led to the almost bankruptcy of Nintendo; however, among the failures one venture not only survived but thrived and determined the direction of the company for the future to come.
That venture was toy manufacturing. Nintendo’s first successful toy was the Ultra Hand, a toy designed by Gunpei Yokoi (Yokoi was given responsibility for toy design, on the spot, when - while still a maintenance engineer - during a break then company President Yamauchi found him playing with the prototype of what would later became the Ultra Hand) Gunpei started working for Nintendo as a maintenance engineer and went on to become one of the most influential figures in the video game industry as the brain behind many industry innovations, such as the Game Boy and the Control Pad (D-pad).
The rise and success of the toy business contrasted with the decline of the cards business. Nintendo started to increasingly dedicate itself to the toy business and incorporate electronics advancements into its toys. The success of this approach led the company to sign an
15 agreement with the American company Magnavox for the distribution of Magnavox’s Odyssey in Japan, the first commercially viable video game console.
The Japanese success of this agreement encouraged the Nintendo to develop its own consoles and software. In 1983 Nintendo launched the Family Computer (Famicom) in Japan, which was later launched in the USA as the NES.
Since its debut in the video game console business, Nintendo has been a company in the forefront of innovation and creativity in the industry. The company is not only the undisputed leader in handheld games devices, it also has numerous lucrative game titles such as The Legend of Zelda series and the Super Mario series, for which, one Nintendo employee in particular, Shigeru Miyamoto, was instrumental.
2.3.2. Organizational Structure
The Nintendo organizational structure was highly influenced by its now departed President Hiroshi Yamauchi. Yamauchi was the great grandchild of the company’s founder, Fusajiro Yamauchi, and came to the helm of the company in 1949 at age 22, after the death of his grandfather, Sekiryo Yamauchi (Sheff, 1994).
Yamauchi managed and steered Nintendo using a clear and uncontested autocratic leadership style (Sheff, 1994). He alone decided which products deserved further Research and Development (R&D) funds, manufacturing, market launch and advertisement, until as recently as 1994 (Kent, 2001). Early on he decided on a flat organization to avoid bureaucracy and instituted different internal research departments to foster internal competition and innovation, a structural feature which still exists today.
Yamauchi retired from direct control in May 2002 and transferred the title of President and CEO (Chief Executive Officer) to Satoru Iwata, who was at the time Nintendo’s Head of Corporate Planning, and became the fourth person to lead Nintendo and the first without family ties to the Yamauchi’s to do so.
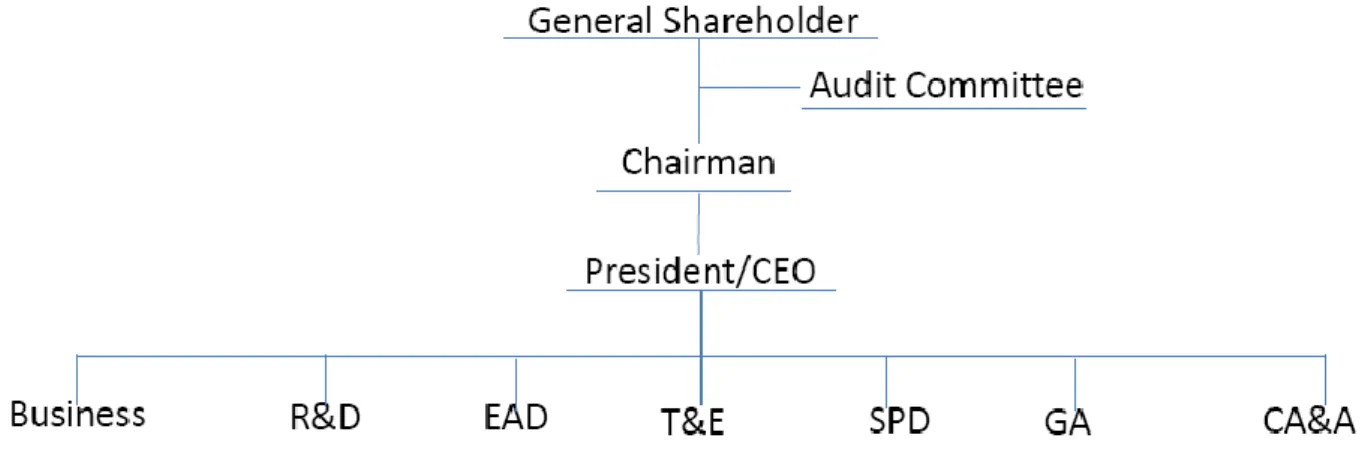
Nintendo has a Board of Directors with twelve members who report to the General Shareholders Assembly; and also reporting to the General Shareholders Assembly is the Audit Committee.
Below the Board of Directors is the Chairman and below him is the President/CEO, who in turn controls nine divisions: Business; Integrated Research and Development (R&D);
16 Entertainment Analysis and Development (EAD); Technology and Engineering (T&E); Software Planning Development (SPD); Manufacturing; General Affairs (GA); and Corporate Analysis and Administrative (CA&A). These divisions are further subdivided into functional departments.
The audit Committee is an independent division, directly reporting to the General Shareholders Assembly and with its own separate structure. Figure 6 represents a simplified design of Nintendo’s organizational structure.
Figure 6: Nintendo’s simplified organizational organogram in 2014
2.3.3. Products
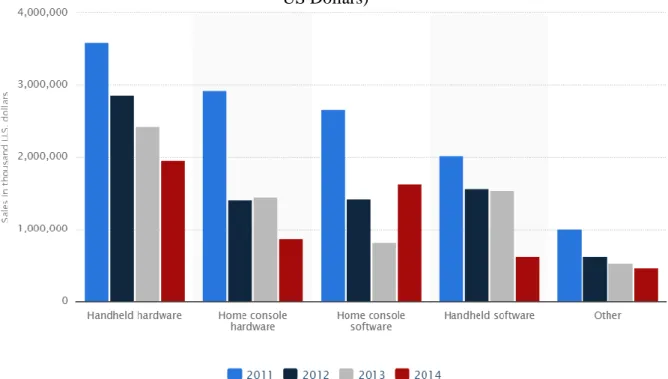
Nintendo has a range of products linked to the video game entertainment industry. However, all its products in this market can be easily grouped into four distinct categories, namely: the home video game console; the handheld game hardware; and the software, both for the game console and the handheld hardware. Figure 8 shows how much each product contributed to the company’s revenues from 2011 to February 2014.
The element “others” mostly represents revenues from royalties from patented properties (e.g. movies based on Nintendo characters such as Super Mario). As Figure 7 shows, home consoles represent approximately 50% of Nintendo’s revenue.
17 Nintendo’s latest console products are the Wii for the seventh generation and the Wii U for the eighth generation. The amount, in millions of units, of consoles sales from the seventh and eight generation is shown in Figure 8.
The Wii console (released on November 19, 2006) was considered revolutionary (Neal, 2013) and has been one of Nintendo’s best-selling consoles of all times. Its innovative motion detection technology has since been adapted by all the other companies in the market. The Wii U (released on November 18, 2012), on the other hand, has so far had lukewarm results (refer to Table 2).
Figure 8: Nintendo’s Console Sales from 2008 to 2013 (in millions of units) Figure 7: Nintendo’s Revenue from 2011 to February 2014 by Product (In 1000
US Dollars)
Source: http://www.statista.com/statistics/216629/nintendo-sales-by-products/ - Accessed on November 2014
Source: Adapted from - http://www.statista.com/statistics/276768/global-unit-sales-of-video-game-consoles/ - Accessed on November 2014
18 2.3.4. Challenges
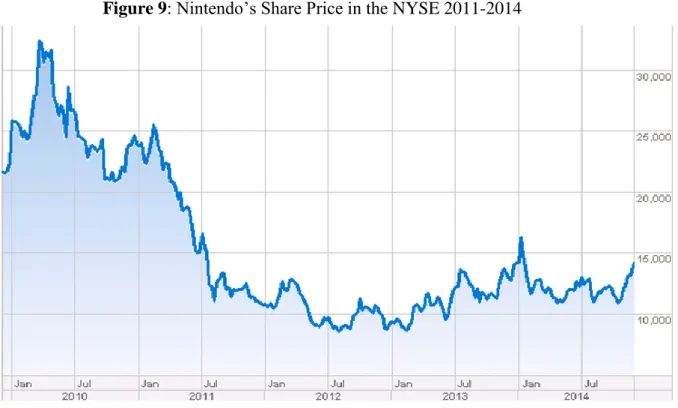
Nintendo dominated the seventh generation consoles, and one year after the release of the Wii, Nintendo’s shares were trading at 78,50 USD/Share, double the value of Sony’s shares. However, Nintendo’s financial fortunes have been falling since 2012, and the company has posted a negative operating income for the last three years, since 2012, see Table 3 (Bloomberg, 2014), and its share are currently trading at around 15 USD/Share (December 2014), see Figure 9.
According to sources linked to the industry (White, 2013; and Parr, 2014) Nintendo’s profitability and stock price decline are a result of the following factors:
General drop in consoles sales for the overall industry;
Table 3: Nintendo’s Revenues and Operating Income 2011-2014
Figure 9: Nintendo’s Share Price in the NYSE 2011-2014
Legend: NYSE = New York Stock Exchange
19 Growing competition from mobile gaming (games played on phones, smartphones,
tablet computers and other types of portable media players);
The slow growth of social gaming (games played as a form of social interaction, e.g: family games).
Nintendo’s incapacity to retain casual gamers has part of its loyal customer base.7
Besides these points, industry specialists (Cramblet, 2014) blame Nintendo’s predicament to the mismanagement of the Wii U launch, it was not accompanied by: the release of new blockbuster games (in house or from third parties); no massive advertisement campaigns were made; and no attempt to clarify the customers’ perception of the differences between the Wii U and the previous console, the Wii. All these facts made customers believe that the Wii U was just a small upgrade of the Wii, and not a new console, and instead of buying an old console upgrade customers preferred to wait a little more for the next generation consoles, the Xbox One and the PlayStation 4. There are still other sources (Kohler, 2014), who claim that “Wii U has staked out a weird middle ground that nobody seems to be standing on. On one flank it has the high-end videogame consoles, which are actually not that much more expensive than a Wii U. On the other are tablets and smartphones, which represent a much better value for more casual players”8.
Nintendo seems to lack a clear strategy to face the current technological changes the industry is undergoing, the company is almost always playing catch-up to its competitors; While Microsoft launched its online community network (a service that allows players to gather online and play, share things and buy products) – Xbox Live – in 2002 and Sony did it in 2010 – PlayStation Network -, Nintendo only launched the same service – Nintendo Network – in 2012.
The perceived lack of strategy is not linked only to the current products management but also to the future of the company, while Microsoft (based on the Azure cloud service) and Sony ( with PlayStation Now) have been adverting their game streaming capabilities and Microsoft has just launched a program to build a virtual reality headset to ward-off possible threats posed by the Oculus Rift (a virtual reality headset launched by American start-up company Oculus VR), Nintendo is completely silent on these developments. Although game streaming
7 http://business.time.com/2013/02/11/game-over-why-video-game-console-sales-are-plummeting/
8
20 is a long term project and it is still in its infancy it has the potential to make consoles obsolete (Tweedie, 2014; and Makuch, 2014).
2.3.5. Industry Positioning
Nintendo’s market positioning stems directly from the belief of its former President Hiroshi Yamauchi, who believed that people do not want to play complex, expensive and over the top high quality games (Sheff, 1994). He believed that people wanted to have fun and relax in an intuitive and inexpensive way. Thus, Nintendo spends more in games characters creation skills rather than on pure technological performance.
With this vision, Nintendo has been trying to position its console as a comparatively inexpensive device, easy to use and aimed at the whole family. It has been increasingly creating games without regard to age, gender or gaming experience, and it also has greatly expanded the “exergaming” experience, which is the combination of on-screen playing with physical activities.
Despite being criticized by some industry pundits as a brand for kids (Olson, 2006), Nintendo’s President Iwata has publicly stated that he is proud that children are associated with his company, but also points out that the company serves a wide range of customers and its sports game titles are even recommended by doctors and exercise professionals (Gantayat, 2006).
2.3.6. Business Model
Nintendo outsources most of the hardware manufacturing for its consoles to various companies, which gives the company a greater flexibility for production variation as well as more control over the costs (Harding, 2008). Another important feature of Nintendo’s business model is the exclusive contracts it has with software developers and retail distributors. These relationships help Nintendo to control its cost structure.
Exclusive software contents (games) are produced just for its consoles, sometimes sold separately other times bundled together with the console. All the external software content providers (game developers) pay a royalty fee to Nintendo for each game they produce to run in Nintendo’s consoles.
By creating innovations such as the motion sensing remote, avoiding the costly technological upgrade wars (e.g. graphs upgrades), dedicating special marketing and promotions tactics
21 aimed at catering to all type of gamers, families and incentivizing “exergaming”, having a slimmer cost structure and selling its consoles above production cost, Nintendo has changed the natural business model of the gaming industry, offering a value proposition based on emotions rather than on technical performance. Figure 10 shows, a template with a summary of Nintendo’s business model.
2.3.7. Resources and Competencies
By industry standards, even though Nintendo is one of the oldest companies in the market and was once the dominant force in the industry, its financial resources are very small and its business scope is much more concentrated when compared with its main competitors. Still, in absolute terms, the company has considerable financial resources.
Although it may sound like a cliché, in Nintendo’s case it is true that its main resources are its people and a great understanding of the gaming industry. Nintendo has among its employees legendary people in the gaming industry such as its current EAD manager Shigeru Miyamoto, the designer Satoshi Tajiri; and in America it is represented both by Satoru Iwata and Reggie Fils-Aime, both known for their sensibility to latent customer demands.
Figure 10: Nintendo’s Business Model Canvas
22 Nintendo’s ability to develop stories, characters and game concepts which are able to meet the latent demand of a wide audience before the rest of the competition is even aware these needs exist, are well known within the gaming industry (Schmidt, 2014).
2.3.8. Key Stakeholders
Nintendo’s activities depend on the partnerships it forges with all the players in its environment, external and internal. The first and one of the most important partnerships the company has is the one with its own employees. As already stated, Nintendo employs some of the most innovative people in its industry. As of May 2014, Nintendo had about 5.000 employees all over the world (Forbes, 2014). Although the company laid-off around 320 European employees in August 2014 (Campbell, 2014), before that Nintendo had openly refused to lay-off its employees, and in 2013 its CEO accepted a 50% salary reduction (the other managers took a lesser reduction) instead of a restructuring plan (Polygon, 2013).
Other important stakeholders groups are its suppliers and game developers. Nintendo’s software suppliers (game developers) include companies such as Activision and Ubisoft. Hardware suppliers include companies such as Samsung, NEC, MegaChip and AMD; Nintendo seeks to closely work with these partners and build as much leverage as possible through both joint product management and judicious awarding of contracts. Nintendo has created a seal of quality to attest that the products developed by its partners are of the highest quality and meet defined standards of performance excellence.
Nintendo does not strictly define a customer segment based on age, culture or class. It has a concept of affordability and user friendly devices and thus all the people who seek these qualities are part of their target. To reach its customers, retailers such as Amazon, Toys “R” Us and Walmart play an useful role in Nintendo’s distribution network, but they are not indispensable because Nintendo operates all over the world and has many distribution options, include its own online and mortar-and-brick shops.
Competitors (especially Microsoft and Sony) are also an important element in Nintendo’s strategy because they influence not only the price of Nintendo’s consoles and games, but also the way Nintendo approaches the design, image and general choices within the industry.
23 2.3.9. Choices for Recovery
Since Nintendo’s revenue, profitability and stock prices started falling, financial and gaming specialists have been advising the company to leave the home video game console industry and concentrate itself in producing games for other companies’ consoles or for smartphones and tablets (Chiappini, 2013; Kohler, 2013; Klain, 2013; and Tassi, 2013).
Nintendo’s management has not completely put aside these ideas (Makuch, 2013; and Gaston, 2013) but it refuses to turn into a software only provider, like Sega. In a 2013 interview reproduced by GameSpot’s Martin Gaston (2013), Nintendo’s CEO, Satoru Iwata, is quoted saying:
“ it might make sense for us to provide our important franchises for other platforms, and then we might be able to gain some short-term profit … However, I'm really responsible for the long-term future of Nintendo as well, so I would never think about providing our precious resources for other platforms at all. Nintendo is a very unique company, because it does its business by designing and introducing people to hardware and software--by integrating them, we can be unique.”
Nintendo is not changing its core business but it has launched certain strategic initiatives to return to profitability (Plafke, 2014; Prasuethsut, 2014; Snyder 2014; Reisinger, 2014; Schmidt, 2014; Thier, 2014; Stuart, 2014). The steps Nintendo is taking to increase revenues, return to profitability and reverse the stock price fall, include but are not limited to:
A share buy-back program using its enormous cash reserves and good solvability (no debt).
The launch of a concerted advertising campaign, which included a successful appearance in this year’s E3 expo;
Launching new blockbuster games, including: Yoshi’s Woolly World; Captain Toad’s Treasure Tracker; Super Smash Bros; Mario Maker; and Mario Kart 8; Reminding (through advertisements in the social media and on TV) the gaming
community about Nintendo’s valuable catalogue of past games, which includes hit successes such as: Lego City Undercover; Pikmim 3; and Wonderful 101; Aggressive special offers, such as the Wii U and Mario Kart 8 bundle offering;
24 Announcing an investment program in a new “health platform”. (However,
Nintendo’s announcements about this program have been vague in relation to the amount invested, the specific function of the platform, and the timetable for the conclusion of the investment);
The launch of a new app and improved internet connectivity, which will allow gamers to access their gaming platforms from smartphones or tablets (but does not yet allow for Nintendo games to be played on mobile devices);
The launch of amiibo figures – which are toys figures based on Nintendo games characters, such as Mario – that use near field communication (NFC) technology to interact with video game software in Nintendo’s multiple platforms;
The announcement of a specific strategy to enter the Chinese market and take advantage of the recent pronouncement by Chinese authorities that the almost 14 year old ban on video game consoles is over. According to CEO Iwata quoted by Forbes (2014) “[In China Nintendo] wants to make new things, with new thinking rather than a cheaper version of what we currently have. The product and price balance must be made from scratch.”
Most of this concerted recovery program has been started in the second half of 2014. As such, these efforts have not yet impacted (at least not yet in a noticeable way) revenues and profits, and some game specialists remain skeptical (Inagaki, 2014). Others, however, are more hopeful (Snider, 2014; Their, 2014; Klain 2014; and Stuart, 2014) and the latest average coverage of Nintendo in the specialist media has been generally optimistic. A new survey of the American market by HIS Technology and Networks (a specialized games intelligence company) indicates that consumers’ “Wii U purchasing intent” has, in two months, increased by 50%; and the stock price is showing a consistent upward tendency since October 2014 (Bloomberg, Nov. 2014), a sign of investors’ confidence in Nintendo’s future.
As of the moment, December 2014, Nintendo is not yet out of trouble and its future remains unclear, at least for outside observers. Nonetheless, what is clear is that Nintendo has shown commitment to its values, resources, and capabilities to recover, remaining true to its core business instead of following the advice of various “experts” to just throw out its core business and follow the potentially easier path of serving others (Suciu, 2014).
25 3. Pedagogical Note
3.1. Intended Audience
Management undergraduate students enrolled in a strategy course are the specific intended audience of this pedagogical case study.
The project is a pedagogical case study which aims to describe, how Nintendo, a company operating in the video game console industry, is attempting to return to profitability in the midst of intensified competition from its main rivals, Sony and Microsoft, and a growing threat from substitute products.
The case study is especially designed for classroom (academic) analysis; it depicts a real situation and students are expected to apply certain strategic management frameworks in order to analyze and understand Nintendo’s environment and choices.
3.2. Pedagogical Objectives
Since entering the home video game console industry, Nintendo has managed not only to survive but also to thrive, however, recent industry changes have seen the company’s sales and share prices plummet and its top management is in search of ways to restore the company’s profitability and competitiveness.
The case study and resolution of the proposed questions are expected to help students consolidate their knowledge about certain strategic management frameworks, namely: the PESTEL analysis; Porter’s five forces model; the VRIO model; Porter’s competitive generic strategies; and the SWOT framework. Thus, by the end of the analysis and discussion of the case study, students should be able to:
a) Use a PESTEL framework to analyze the general environment;
b) Conduct an analysis of the immediate industrial environment of a company using Porter’s five forces model;
c) Use the VRIO model to identify a company’s key resources and capabilities and their ability to create sustainable competitive advantages;
26 e) Use the SWOT framework to match companies’ resources and capabilities with the external environment’s possibilities.
With the discussion of the pedagogical note concluded, the next chapter will be the discussion of the theoretical framework – literature review.
27 4. Theoretical Framework - Literature Review
4.1. The Concept of Strategic Management
Wheelen and Hunger (2012: 5) define Strategic Management as a “set of managerial decisions and actions that determines the long run performance of a corporation”.
For Teece et al. (1997) the foremost quest of strategic management is to understand how companies achieve and sustain competitive advantage. It is said that a firm possesses competitive advantage when it can generate superior financial performance over a considerable period of time (Porter, 1985). Barney (1986: 657), in turn, defines this superior financial performance as a “rate of return [on invested capital] greater than a normal return and [which] indicates that the firm is prospering”.
In its pursuit to understand the determinants of a company’s sustained profitability, strategic management is influenced mainly by two lines of thought: the industrial-organization tradition influenced by economics; and the organizational-factors paradigm influenced by sociology and behavioral disciplines (Makhija, 2003; McGahan and Porter, 1997; Hansen, and Wernerfelt, 1989; McGee, and Thomas, 1986; Schmalensee, 1985).
The industrial tradition seeks to explain the profitability of a company by taking the external environment, more specifically the industry, as the basic unit of analysis (Porter, 1979; Hatten and Hatten, 1987). A famous proponent of this line of thought is Porter (1980), but there are other renowned authors such as Shepherd (1972), Hatten and Hatten (1987), and Shapiro (1989) who also support this thought tradition.
The main proponents of the sociological line of thought, also known as the Resource-Based View (RBV), include authors such as Wernerfelt (1984), Barney (1991), Rumelt (1991), Prahalad and Hamel (1990), and Peteraf (1993). These authors take the company as the basic unit of analysis. They claim that the bulk of the profitability of the company is determined by the resources and capabilities the company possesses (Priem, and Butler, 2001).
While there may be considerable differences between the two approaches, there are authors such as Conner (1991) who see them as complementary, going as far as to say that the RBV incorporates features of the market-based view. Indeed the integration of the two views seems inevitable and it can be identified in the works of Andrews (1971), Priem and Butler (2001), Collis and Rukstad (2008), and Bourgeois (1985). In fact Bourgeois (1985:548) affirms that:
28 “the central tenet in strategic management is that a match between environmental conditions and organizational capabilities and the resources is critical to performance and that a strategist’s job is to find and create this match”. - It can thus be affirmed that the difference between the two views rests more on the relative emphasis which is given to the external or internal conditions when determining the origin of superior company performance. And practitioners, business consultants in particular, have always incorporated both views when assessing business ideas, the SWOT (Strengths, Weaknesses, Opportunities and Threats) framework being a good example of an attempt to conciliate both views in one coherent model.
Next, the general external environment analysis will be followed by the discussion of the market-based view (with the industry as its basic unit of analysis), which in turn will be followed by the discussion of the resource-based view (with the company as its basic unit of analysis).
4.2. General/External Environment Analysis
The general environment represents the broader dimensions which are beyond the direct control of companies but which may represent a great source of opportunities and threats. An assessment of both the present state of the general environment and of its likely future shifts are of importance, and useful in the determination of a company’s strategic choices. One commonly used technique for analyzing the general environment is the PESTEL analysis. The PESTEL analysis serves as a reminder of the different environmental aspects which may affect a company (Lynch, 2012), and the acronym stands for these different dimensions; namely:
Political (P) – This dimension broadly encompasses all the relationship between businesses and government entities. Among others aspects, it analyses matters related to military stability, government ideological preferences, the relationship between the businesses and the government, such as subsidies legislation, government ownership of production factors, alignment of political parties and attitude toward monopolies and competition;
Economic (E) – This dimension monitors the likely impact changes in aggregated economic variables such as GDP (Gross Domestic Products), inflation, unemployment rates, price indexes and investment data , among others, have on businesses;
29 Socio-cultural (S) – This dimension is responsible for the analysis of anthropological issues such as cultural values, beliefs (e.g. acceptance of gay marriage), life style, fashion, demographic distribution, and religion;
Technology (T) – This dimension monitors the current and potential future use of scientific knowledge for economic purposes. Issues covered on this dimension include, but are not limited to, R&D investments, new patents and products, and speed of technological adoption; Environment (E) – This dimension essentially deals with issues linked to the preservation of nature, such as waste disposal and energy consumption;
Legal (L) – This dimensions analysis how existing laws or proposed future laws will impact businesses and how such laws can be used for advantageous company positioning. Issues linked to this dimension normally include, but are not limited to, anti-trust laws, product safety and employment laws. This dimension is sometimes difficult to differentiate from the political dimension.
The above list is far from exhaustive. There are myriad indicators which can be considered within each one of the dimensions indicated. In any case, in a PESTEL analysis there is no need to describe all the possible elements, but only those the company considers important and worth analyzing (either due to their importance for survival and/or success, or due to their likelihood of change and possible resulting impact on company activities). Indeed, it has been argued that a PESTEL analysis is only as good as the analyst who conducts it (Lynch, 2012). 4.3. The Market Based-View (Industry Analysis)
The industrial-organizational approach is also known as the market based-view (MBV). This view rests on the assumption that firms are homogenous entities such that any differences between them are temporary and negligible, except when based on scale, which in any case is also insubstantial (Schmalensee, 1985).
The market based view explains the performance of a company through the industry structure. This model, developed by Mason (1939) and Bain (1956), called the Structure-Conduct-Performance (SCP), establishes that industry characteristics, such as entry barriers or the concentration of companies, determine the existence of superior return among industries.
30 Porter (1979: 215) defines industry as a “group of competitors producing substitutes that are close enough that the behavior of any firm affects each of the others either directly or indirectly”.
The analysis of the industry (external analysis) within the strategic management process is justified by the belief that industry is determinant to a company’s potential performance, and Porter (1980) created a framework, which he called the “five-forces”, that sought to fully explain how industry conditions could impact the potential returns of companies operating within it.
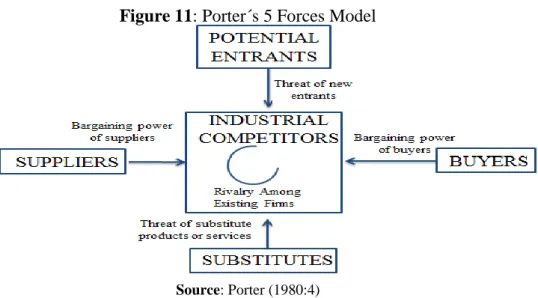
4.3.1. The Five Forces and the Value Net Frameworks
The five forces framework has become a reference in the industry analysis process. For Porter (1980), the competition within any specific industry is determined by five basic forces. The intensity of the interaction between those forces determines the attractiveness of the industry, and this intensity is not a product of coincidence or luck, it is a result of an intrinsic economic structure beyond the influence of the actions of competing companies (Porter, 1980).
As shown in Figure 11, the five forces are composed of: the threat of new entrants; rivalry among existing companies; the threat of substitute products/services; the bargaining power of buyers; and the bargaining power of suppliers (Porter, 1980).
Threat of entry – This force influences industry profitability because new entrants bring new capacity and a desire for market share which may lead to excess production or price wars. The menace of new entry essentially depends on the industry’s barriers to entry, which include but are not limited to: economies of scale; product differentiation; capital requirements; and
Figure 11: Porter´s 5 Forces Model
31 access to distribution channels. The greater the barriers to entry the higher the profitability of the industry, however, these barriers can change overtime.
Rivalry among existing competitors – This force refers to the struggle among companies for greater market share or returns, conducted through price, advertisement, location and the like. The intensity of this rivalry depends, among others: on the number of competitors within the industry; industry growth; the level of fixed costs; exit barriers; and level of strategic stakes (e. g. how important is for the survival of a company to sell a certain level of products). Variables which increase the intensity of the competition have an adverse effect on industry attractiveness.
Substitute products – Includes all equivalent products or services, from other industries, which meet the same basic needs. This force affects industry profitability by limiting the price companies can charge before customers move to another product.
Bargaining power of buyers – This force affects industry profitability by pushing prices down through requests for better quality, more services, and pitting competitors against each other. The strength of buyers’ bargaining power depends on, among others: the volume of buyers’ purchases in relation to seller’s sales; the importance of the product for the buyer; and the buyer’s switching costs.
Bargaining power of suppliers – The influence of suppliers affects the profitability of an industry through their ability to raise prices and/or reduce the quality of supplied products/services. The capacity of suppliers to do so depends on, among others: the number of suppliers available; the importance of the buyer for the supplier; and the desire or possibility of forward integration.
Porter (1980) points out that none of these forces are static; although their effects are consistent and persistent in the long run, they interact in a dynamic and fluid way. Although Porter (1980) points out the dynamic relationship within the industry, some authors, such as Brandenburger and Nalebuff (1997) claim that the five forces model focuses too much on competition, turning business into a zero-sum affair, where a company either loses or wins. For Brandenburger and Nalebuff (1997) besides competing, companies should also actively seek opportunities for cooperation. They call this rational behavior of simultaneously