M
ASTER
F
INANCE
M
ASTER
´
S
F
INAL
W
ORK
P
ROJECT
E
QUITY RESEARCH
:
W
ULIANGYE
Y
IBIN
CO.,
LTD.
X
INRUI
C
AO
M
ASTER
F
INANCE
M
ASTER
´
S
F
INAL
W
ORK
P
ROJECT
E
QUITY RESEARCH
:
W
ULIANGYE
Y
IBIN
CO.,
LDT.
X
INRUI
C
AO
S
UPERVISION:
A
NAI
SABELO
RTEGAV
ENÂNCIOAcknowledgements
Since this project represents the end of one of the most important stages of my life, I would
like to express my sincere gratitude, to all the persons that had a relevant role along this
journey.
First, to Professor Ana Venâncio for the guidance, time and patience that had for me during
the realization of this project.
To my parents who supported me unconditionally at all stages of my educational and
professional path.
Index
Abstract ... 6 Resumo ... 7 Index of Figures ... 8 Index of Tables ... 9 Abbreviations ... 10 1. Research snapshot ... 11 2. Business Description ... 12 “1-3-3” program ... 13“10 Thousand Shop Project” ... 14
Product system: Development of high-end products & Reduction of low-end products ... 14
Sale channel system: “Wuliang E Shop” ... 15
Team system: “Recruitment Program of Expert” ... 15
Digital supply chain platform ... 16
3. Management and Corporate Governance ... 16
Corporate Governance: ... 16
Ownership structure: ... 17
4. Industry ... 18
Global Economic Outlook... 18
China Economic Outlook ... 19
Baijiu industry outlook ... 20
Peer group ... 22
Comparative Analysis ... 23
Porter’s Five Forces ... 24
5. Investment Summary ... 26
6. Valuation ... 27
Key Valuation Drivers ... 27
Valuation Methodology ... 28
Relative Valuation Approach (Multiple Valuation)... 29
7. Financial Analysis ... 30
EBIT margin & Net profit margin ... 30
ROE & ROA ... 30
Interest coverage ratio ... 31
8. Investment Risk ... 31
Operational Risks ... 31
Economic and Market Risks ... 32
Political and Regulatory Risks ... 33
Risks to Price Target ... 34
9. References ... 36
Appendix 1: Consolidated Balance Sheet ... 31
Appendix 2: Consolidated Income Statement ... 32
Appendix 3: Common Size Consolidated Balance Sheet ... 33
Appendix 4: Common Size Consolidated Income Statement ... 34
Appendix 6: Assumptions ... 36
Appendix 7: Revenue Assumptions ... 38
Appendix 8: COGS Assumptions ... 39
Appendix 9: Key Ratios ... 40
Appendix 10: CapEx ... 41
Appendix 11: Net Working Capital (NWC) ... 42
Appendix 12: Discounted Cash Flow Valuation Method ... 43
Appendix 13: Multiples Method ... 44
Appendix 14: Peer Group ... 31
Abstract
This project contains the detailed valuation and the respective estimation of Wuliangye Yibin Co., Ltd. intrinsic share value for the year end of 2018, according to ISEG’s Master in Finance final work project.
The choice of Wuliangye Yibin Co., Ltd. comes from my personal interest in the Baijiu industry which is a traditional industry in China. The price target was obtained through an absolute valuation method, more specifically the Discounted Cash Flow (DCF) method. In addition, we used Relative Valuation Method approach, as a complemented method, in order to support the final recommendation. A sensitivity analysis and a Monte Carlo simulation were performed to further complement the analysis. With a price target of CNY 72.63 at YE2018, a downside potential of 3.78%, from March 8th, 2018, current price of CNY 75.49, our final
recommendation for Wuliangye Yibin Co., Ltd. is to SELL, taking into consideration, the risks that may occur and that can affect the company’s performance. Our risk assessment estimates a high risk for the company.
Resumo
Este projeto inclui uma avaliação detalhada e a respetiva estimação do valor das ações da Wuliangye Yibin para o final do ano de 2018, de acordo com as regras do projeto final do Mestrado em Finanças do ISEG.
A escolha da empresa Wuliangye Yibin deve-se ao meu interesse pessoal na indústria de Baijiu, que é uma das indústrias mais tradicionais da China. O preço-alvo foi obtido através do método de avaliação absoluta, mais especificamente o método do Flow to Equity (FTE). Adicionalmente, utilizamos o método de avaliação relativa, o método dos Múltiplos, como método complementar para apoiar a recomendação final. Uma análise de sensibilidade e uma simulação de Monte Carlo foram realizadas para analisar a robustez das estimativas obtidas. Com um preço-alvo de CNY 72.63 para FA2018 e um potencial de desvalorização de 3.78%, face ao preço de CNY 75.49 do dia 8 de março de 2018, a nossa recomendação final para a Wuliangye Yibin é de VENDA. A avaliação de risco estima um risco elevado para a empresa. Palavras-chave: Wuliangye Yibin; Equity Research; Discounted Cash Flow method; Flow to Equity; Relative Valuation method; Indústria do Baijiu
Index of Figures
Figure 1: Stock Price of Wuliangye Yibin ... 11
Figure 2: 2017 Chinese spirit market share on value basis ... 12
Figure 3: 2017 Market share of different types of Baijiu in China ... 12
Figure 4: 2017 Wuliangye Yibin's Operating Revenue ... 13
Figure 5: 1995-2017 Wuliangye Yibin’s Operating Income ... 13
Figure 6: 1995-2017 Wuliangye Yibin’s Net Income ... 13
Figure 7: Wuliangye Yibin's 1-3-3 system ... 14
Figure 8: Wuliangye Yibin's Number of dealers ... 15
Figure 9: Percentage of sales of top 5 customers ... 15
Figure 10: Percentage of private offerings in April 2018 ... 16
Figure 11: Corporate governance system of Wuliangye Yibin ... 16
Figure 12: Types of shareholders of Wuliangye Yibin ... 17
Figure 13: Control Relationship of Wuliangye Yibin ... 17
Figure 14: World's GDP Growth and Inflation Rate ... 18
Figure 15: China's GDP Growth and Inflation Rate ... 19
Figure 16: Engel coefficient of China 1978 - 2014 ... 20
Figure 17: Baijiu Production in China ... 20
Figure 18: Operating income of Baijiu industry in China ... 21
Figure 19: Consumption structure of Baijiu in China ... 21
Figure 20: 2017 Chinese Baijiu market share on value basis ... 21
Figure 21: 2015 Chinese Baijiu market share on value basis ... 22
Figure 22: 2016 Gross profit distribution for high-end baijiu company ... 23
Figure 23: Porter’s five forces ... 24
Figure 24: Proportion of alcohol sales of China in 2017 ... 25
Figure 25: Monte Carlo simulation ... 26
Figure 26: Percentage of Baijiu's components ... 27
Figure 27: EBIT & Net Profit Margin ... 30
Figure 28: ROE & ROA ... 31
Figure 29: Net profit margin, Equity multiplier & Asset turnover ... 31
Figure 30: Interest coverage ratio of Wuliangye Yibin ... 31
Figure 31: Risk Matrix ... 32
Index of Tables
Table 1:Analyst's Risk Assessment ... 11
Table 2: Wuliangye Yibin’s Market data ... 11
Table 3: Valuation output ... 11
Table 4: Financial Highlights ... 11
Table 5: Top Investors ... 18
Table 6: Demographic Structure in China ... 20
Table 7: List of Baijiu companies in China ... 22
Table 8: Peer Group ... 23
Table 9: SWOT analysis of Wuliangye Yibin ... 24
Table 10: DCF Method ... 26
Table 11: Multiple Method... 26
Abbreviations
¥ – Yuan
BU – Business Unit
CapEx – Capital Expenditure CIP – Construction-In-Progress CNY – Yuan
COGS – Cost of Goods Sold DCF – Discounted Cash Flow
D&A – Depreciation and Amortization
EBITDA – Earnings Before Interest, Taxes, Depreciation and Amortization EBIT – Earnings Before Interest and Taxes
ERP – Equity Risk Premium EV – Enterprise Value
FCFE – Free Cash Flow to the Equity FTE – Flow to Equity
GDP – Gross Domestic Product g – Perpetual Growth Rate
IMF – International Monetary Fund MRP – Market Risk Premium
NPV – Net Present Value NWC – Net Working Capital Rd – Cost of Debt
Re – Cost of Equity ROA – Return on Asset ROE – Return on Equity
R&D – Research and Development T – Effective Tax Rate
TV – Terminal Value YE – Year Ending YoY – Year on Year
1. Research snapshot
(YE2018 price target of CNY 72.63; 3.78% Downside Potential; High Risk; Final recommendation: SELL)
Wuliangye Yibin CO., LTD. (Wuliangye Yibin) is a Chinese state-owned enterprise, listed in Shenzhen Stock Exchange, mainly engaged in the production and sale of distilled liquor.
SELL is our recommendation for Wuliangye Yibin Co., Ltd. with a price target of CNY 72.63 at YE2018 using discounted method. The relative valuation supports our Sell recommendation. This offers a downside potential of 3.78%, in comparison with the closing price of CNY 75.49 on March 8th of 2018, although with high risk (Table 1, 2, 3 and Figure 1).
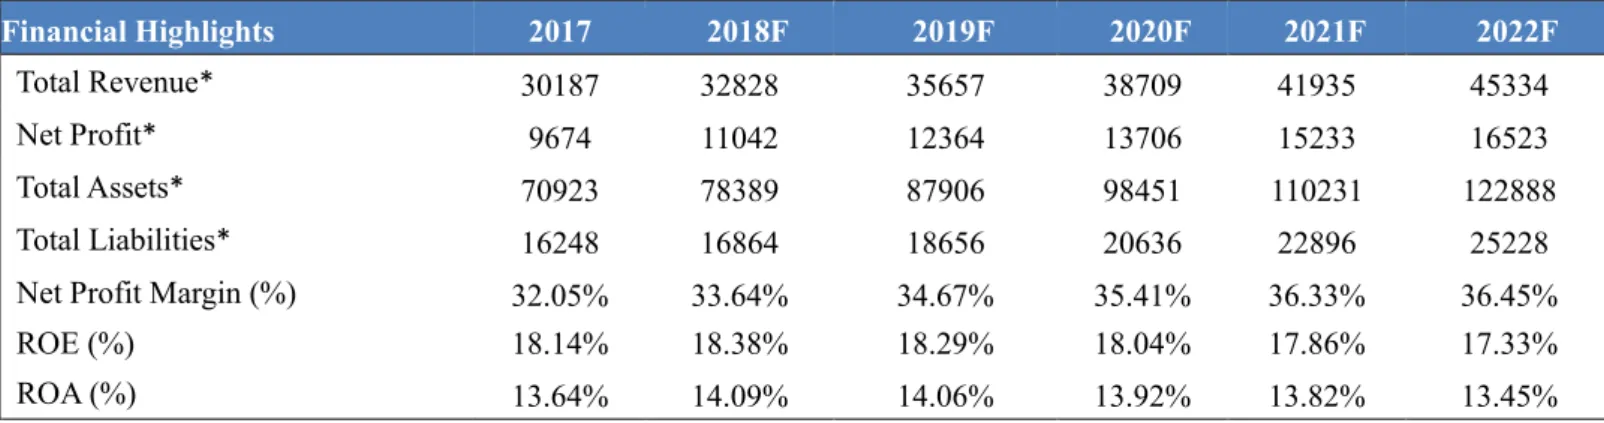
We expect that Wuliangye Yibin’s sales to grow in the next years, from CNY 30.19 billion in 2017 to CNY 45.34 billion in 2022F. In 2018, the company will implement reforms in sale channel under the “1-3-3” program, which promotes operating efficiency of the company’s entire sales system, and increases brand awareness. Due to the improvements on the sale channel, the sales cost in 2017 was CNY 3.63 billion, a YoY decrease of 22.77%. EBIT margin increased by 6.48% YoY and net profit margin by 4.41% in 2017 and our analysis resulted in a sustained growth from 2018F to 2022F.
Table 4: Financial Highlights
Financial Highlights 2017 2018F 2019F 2020F 2021F 2022F
Total Revenue* 30187 32828 35657 38709 41935 45334
Net Profit* 9674 11042 12364 13706 15233 16523
Total Assets* 70923 78389 87906 98451 110231 122888
Total Liabilities* 16248 16864 18656 20636 22896 25228
Net Profit Margin (%) 32.05% 33.64% 34.67% 35.41% 36.33% 36.45%
ROE (%) 18.14% 18.38% 18.29% 18.04% 17.86% 17.33%
ROA (%) 13.64% 14.09% 14.06% 13.92% 13.82% 13.45%
Source: Company Data, Author *in CNY million
20 40 60 80 100
Adj Close Price Target Price Current Price
WULIANGYE YIBIN CO., LTD.
Low Medium High
Source: Author
Table 1: Wuliangye Yibin’s Market data
Market Profile
Closing Price ¥75.49
Last 52-wk price range ¥58.02 – ¥93.18 Average daily volume 26,590,710 Shares outstanding 3.8 B
Market Cap 233.712 B
P/E 21.04
Source: Author
Table 3: Valuation output
Valuation method YE2018 Target Price Upside Potential DCF ¥72.63 -3.78% Multiple (average) ¥77.41 2.55% Source: Author
Figure 1: Stock Price of Wuliangye Yibin
Source: Wind, Author
78.90% 0.89% 10.33% 9.88% Strong aroma Light aroma Sauce aroma Others Source: Wind 10.30% 4.97% 3.44% 1.79% 1.21% 78.29% Kweichow Maotai Wuliangye Yanghe Gufen Luzhou Laojiao Anhui Gujing Others
Source: Company data, author
Figure 2: 2017 Chinese spirit market share on value basis
Figure 3: 2017 Market share of different types of Baijiu in China
2. Business Description
WULIANGYE YIBIN CO., LTD., is a Chinese state-owned enterprise, and mainly engaged in the production and sale of distilled liquor. It has diversified business units, which include logistics, modern machinery manufacturing, polymer materials, bio-engineering, pharmaceuticals, printing and other related service sectors. The company has more than 25,000 employees, and an ancient producing pond which occupies more than 12 square kilometers and never stopped the fermentation. Wuliangye Yibin adheres to the strategy “Quality is the key”, so it continuously optimizes its product structure, integrates its industrial resources, and enhances its operating performance. Due to these efforts, the company was awarded a golden prize at Expo Milano in 2015 and earned several titles such as the Chinese top 10 most respected listed company and Chinese Top 50 Brands. The production site is located in the Yibin County, Sichuan Province. Both UNESCO and FAO consider this location as the most suitable for the fermentation site for high-quality distilled liquor. With this environmental advantage, the company has developed an industry structure with liquor as its core business and other liquor-based business.
The company's main product, Baijiu, is a traditional fermented alcoholic drink originated in China, which is typically obtained by natural fermentation. As one of the seven major distilled liquors in the world, Baijiu has a high reputation and occupies an important position in the Chinese culture. In China, drinking has always played a very significant role in dining culture. Baijiu is drunk almost exclusively during meals, when important relationships are built and maintained.
Baijiu has different types of flavours: strong aroma, light aroma, and sauce aroma. The most popular flavour is strong aroma, whose market share accounts for more than 70% of the total Baijiu market in China (see
0 0.21% 0 0.65% 70.87% 22.19% Printing Glass Plastic Others Baijiu - high price Baijiu - mid & low price
Source: Company data, author
Figure 4: 2017 Wuliangye Yibin's Operating Revenue
Figure 5: 1995-2017 Wuliangye Yibin’s Operating Income
Figure 6: 1995-2017 Wuliangye Yibin’s Net Income
Figure 3). The different types of Baijiu vary in taste, ingredients, quality, and price. The cheapest type of Baijiu costs between CNY 2 and CNY 5, contained in a small bottle, with lower quality, and can be found almost everywhere. Meanwhile, the more expensive brands can often go for over CNY 1,000 per bottle (500 ml).
The core brand of the company is a strong aroma Baijiu with high quality, Wuliangye 52% ABV, using the same name of the company. Wuliangye 52% ABV accounts for 90% of high-end Baijiu market. Along with the production of the high-alcohol drinking, the company also has by-products, the mid- & low-end Baijiu, with lower alcohol content and lower price. The expended products aloe the company to meet the needs of consumers from different income levels. In 2017, 70.87% of the revenue came from high-end Baijiu, 22.19% from the mid- & low-end Baijiu, and the other business only accounts for 7% (see Figure 4).
In 2017, the company achieved a total operating revenue of CNY 30.19 billion, with an increase of 22.99% YoY. The net profit was CNY 9.67 billion, with a growth of 42.58% YoY. The net cash flow from operating activities was CNY 9.77 billion, compared with last year CNY 11.69 billion, implied a decrease of 16.51% YoY (see Figures 5 and 6).
“1-3-3” program
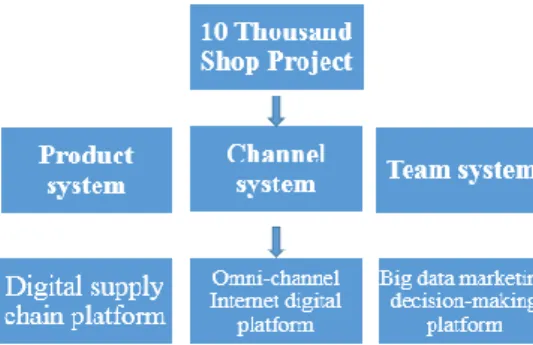
In June of 2018, the company introduced the “1-3-3” program, standing for one project, three systems, and three platforms. More specifically, the project is the "10 Thousand Shop Project". The systems include product system, channel system and team system. As for the platform, the company established a digital supply chain platform, a digital Internet platform of omni-channel and a decision-making platform based on big data in marketing. This program will promote production and the operating efficiency of the company's entire sales system (see Figure 7).
Source: Wind, author Source: Wind, Author
Figure 7: Wuliangye Yibin's 1-3-3 system “10 Thousand Shop Project”
In the industry, Baijiu is sold through distributors, authorized dealers, retailers and representatives. In the past, other Baijiu companies, like Kweichow Maotai, emphasized the importance of small dealers and representatives. In contrast, the main sales chain of Wuliangye Yibin is through large distributors and authorized dealers who offered to the company a sales platform to achieve rapid growth during the initial stage of the Baijiu industry. However, since large-scale distributors and authorized dealers had strong pricing power, they used to buy huge amounts of Baijiu products at low price, and sell them to public consumers at high price. This sales chain resulted in inefficient inventory management and disturbance in the products’ price.
In recent years, the company has adopted a series of new commercial strategies. The “Expansion of Marketing Channel” intends to increase brand awareness and at the same time create their own shops to sell their own products directly to consumers. Compared to the distributor system, own-shops allow Wuliangye Yibin to expand the market of high-end products.
To increase market penetration, the company implemented the “Hundreds of cities, thousands of counties, and ten thousand stores” projects. By the end of 2017, it built 7,000 core point-of-sales and 1,000 Wuliangye specialty stores in large and medium cities. In 2018, the company target to have 8,000 core point-of-sales and 1,500 specialty stores.
Product system: Development of high-end products & Reduction of low-end products
Brand recognition plays an essential factor in the Baijiu industry. Noticing the increase in both consumption and price of high-end Baijiu, Wuliangye Yibin decided to focus on the strengthening brand and competitiveness of its core products (Wuliangye 52% ABV), while reducing the production of its low-end products.
Source: Company 2017 annual report, author
867 1101 0 200 400 600 800 1000 1200 2016 2017
Source: Company data, author
14.78% 28.73% 19.45% 12.95% 10.86% 0.00% 5.00% 10.00% 15.00% 20.00% 25.00% 30.00% 35.00% 2013 2014 2015 2016 2017 Source: Company data, author
Figure 8: Wuliangye Yibin's Number of dealers
Figure 9: Percentage of sales of top 5 customers
The company's brands of mid- and low-ended Baijiu used to be numerous and chaotic with insufficient brand recognition in the past. The company currently reduced the number of mid- and low-end brands from 130 to 49.
Sale channel system: “Wuliang E Shop”
“Wuliang E Store” is another type of retail shop. Consumers can buy products through internet and pick them up through QR Code or face recognition in the “Wuliang E Store”. Accompanied by application in smartphones which is based on big data and directly to the end consumers, the company could combine the operation and management, integrate third-party supply chain management with information technology, retail operation experience and other advantageous resources. In this way, the company can have stronger control in channel inventory and better understanding of the market.
cAccording to the company's 2017 annual report, the number of dealers
was 1,101, increased 26.9% YoY, while the sales of the top five clients accounted for 10.86%, which indicates a third-time of yearly consecutive decline (Figure 8 to 9). Due to the improvement of sale channel system, the sales cost in 2017 was CNY 3.63 billion, a YoY decrease of 22.77%. Moreover, Wuliangye Yibin plans to continue its investment in expansion program of sale channel, so as to improve the company’s capacity to meet to the market demands and increase the diversity of supply.
Team system: “Recruitment Program of Expert”
“Recruitment Program of Expert”, also known as “the Thousand Talents Plan” is a program of rewarding high-level talents that not only master the first-class skills of Baijiu producing both, but they also have leadership and team organization skills. To improve staff efficiency, the company awards outstanding employees with prizes that range from CNY 80 thousand to 2 million.
27.70% 22.66% 49.64% Employees Dealers Other institutional investors
Source: Company data, author
Figure 10: Percentage of private offerings in April 2018
Figure 11: Corporate governance system of Wuliangye Yibin
In April of 2018, the company did a private offering of 85.64 million shares at the issue price of 21.64 yuan/share. The total amount raised was CNY 1.85 billion, and the net proceeds were CNY 1.82 billion. In this offering, the employee subscribed for 510 million shares, and the dealer subscribed for 420 million shares (see Figure 10). After the completion of private offering, the shareholders’ interests are aligned with those of the employees.
Digital supply chain platform
Digitization platform of omni-channel on internet
Decision-making platform based on big data in marketing
In December of 2017, Wuliangye Yibin and IBM agreed on a strategic cooperation to promote a digital upgrade, industrial transformation and business model innovation of Wuliangye Yibin’s entire management system. The company can draw support from IBM's cloud computing, big data, block chain, artificial intelligence and other technologies to develop strategic cooperation through the value chain of Baijiu industry, mainly machinery, packaging, logistics, health, finance, and artificial intelligence. The company intends to be the top digital enterprise in Chinese liquor Industry.
3. Management and Corporate Governance
Corporate Governance:
Wuliangye Yibin includes as a two-tier board system. The Board of Directors and the Board of Supervisors. As all Chinese listed firms, Wuliangye Yibin is also supervised by the department of Communist Party Committee which politically controls of the company (Figure 11). The Board of Supervisors includes representatives of the shareholders and the employees of the company. In Wuliangye Yibin, there are three representatives of shareholders and two representatives of the employees. The Board of Directors is composed by seven members of which three
56.07% 8.13% 35.80% State-owned inverstors Institutional investoors Private investors
Source: Company data, author
Figure 12: Types of shareholders of Wuliangye Yibin
Figure 13: Control Relationship of Wuliangye Yibin
are independent directors elected from the General Shareholders Meeting. Mr. Li Shuguang was appointed as the chairman of the Board of Directors and Secretary of the Communist Party Committee on 23 of March 2017. The Communist Party Committee overrules all Chinese state-owned enterprise (SOE). As the SOE enhance the strength of the whole nation, the Chinese Communist party has maintained representative committees inside those companies for decades and recently has been seeking to strengthen their power in supervision, management and administration. In
Wuliangye Yibin, the Communist Party Committee not only play an active role in supervising, but also in managing. Moreover, the Communist Party Committee takes the responsibilities in generate strategies of the company.
Ownership structure:
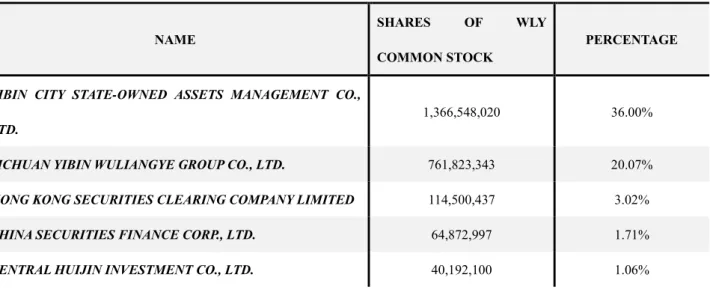
According to the 2017 annual report, the number of shares of outstanding is 3,795,966,720. Figure 12 presents that shareholder structure. Wuliangye Yibin’s shares are held by two state-owned corporations, Yibin City State-owned Assets Management Co., Ltd. (36%) and Sichuan Yibin Wuliangye Group Co., Ltd. (20.07%). The remaining 8.13% are held by institutional investors, mainly investment company owned by the Chinese government, offshore hedge funds, insurance companies, pension funds and other corporations. The State-owned Assets Supervision and Administration Commission of Yibin City is the actual controller of Wuliangye (see Figure 13, Table 5 and Appendix 5).
2.80%2.80% 3.00% 3.50% 3.40% 3.30% 3.20% 3.30% 3.50% 3.20% 3.80% 3.90% 3.90%3.80% 3.70% 3.70% 0.00% 0.50% 1.00% 1.50% 2.00% 2.50% 3.00% 3.50% 4.00% 4.50%
Inflation rate GDP growth
Source: IMF, author
Figure 14: World's GDP Growth and Inflation Rate
4. Industry
Global Economic Outlook
According to the IMF World Economic Outlook in 2017, the world’s GDP growth rate (3.8%) increased by 18.75% YoY. In terms of inflation rate, it grew by 7.14% to 3.00% compared with last year. The world’s GDP growth rate is expected to reach 3.9% in 2018 and 2019. Based on the expectation of IMF, the World GDP growth rate and inflation rate both will slightly decrease in the following years. The GDP growth rate will be 3.9% in 2018 and 3.7% in 2022F and inflation rate will drop from 3.5% to 3.3% (see Figure 14). This may result in a decrease in the private consumption, one of the key drives for the company’s performance. The decreasing global economy performance is due continuing trade tensions. In the past few months, the United States has imposed tariffs on various types of imports, followed by retaliatory measures from its trade partners. Meanwhile, the North American Free Trade Agreement and the economic arrangements between the UK and the other EU countries are being renegotiated. This increased trade tensions may undermine global economic growth. The uncertainty on potential trade opportunity may also be a huge hindrance to investment. At the same time, the expansion of TABLE 5: TOP INVESTORS
NAME
SHARES OF WLY COMMON STOCK
PERCENTAGE
YIBIN CITY STATE-OWNED ASSETS MANAGEMENT CO., LTD.
1,366,548,020 36.00%
SICHUAN YIBIN WULIANGYE GROUP CO., LTD. 761,823,343 20.07% HONG KONG SECURITIES CLEARING COMPANY LIMITED 114,500,437 3.02% CHINA SECURITIES FINANCE CORP., LTD. 64,872,997 1.71% CENTRAL HUIJIN INVESTMENT CO., LTD. 40,192,100 1.06%
6.90% 6.70%6.90%6.60% 6.40%6.30%6.00% 5.70% 0.00% 1.00% 2.00% 3.00% 4.00% 5.00% 6.00% 7.00% 8.00%
GDP growth Inflation rate
Source: IMF, author
Figure 15: China's GDP Growth and Inflation Rate
trade barriers may increase the cost of tradable goods, and undermine the global supply chain, reducing the productivity and revenue of the companies. However, since the Baijiu industry has been focusing mainly on the domestic market so far, the negative impact of global trade tension will not be excessively significant.
China Economic Outlook
GDP growth rate
The Baijiu industry mainly focuses on the domestic market, the relevant policies, regulations and economic performance of China shall play significant role in forecasting the operating activities and future outcomes for Wuliangye Yibin.
According to IMF, China’s GDP growth rate will decline in recent following years (see Figure 15). In contrast, the cost of borrowing in China will grow, which may result in less investment and in a decrease in operating activities. As such, it presents moderate risk to Wuliangye Yibin.
Inflation rate
The inflation rate, as we can observe in Figure 15, will steady and will fluctuate around 2.7% in the next few years. With a moderate level of inflation rate, a healthy level of consumer spending can promote development of company.
Demographic structure
Demographic structure is another important factor that affects the Baijiu consumption in China. The birth rate in China peaked in the period from 1950, until the year of 1990. This Baby Boomer generation now are in their 20s - 60s, which means they are the main consumers. Moreover, the two emerging consumer groups are expanding: the middle classes and the post-90s. They have several identical characteristics, such as strong desire to consume, brand awareness and high quality. The target customer of
Figure 17: Baijiu Production in China Figure 16: Engel coefficient of China 1978 - 2014
Wuliangye Yibin are the 30s-60s group, especially the middle classes, which means the company has a large group of potential customers in China (see Table 6).
Table 6: Demographic Structure in China
2008 2012 2016
>60 years 12.77% 14.33% 16.65%
35-60 years 44.96% 43.10% 43.59%
20-34 years 20.30% 24.48% 23.60%
10-19 years 14.60% 11.89% 10.54%
Source: Wind, author
Consumption expenditure
The proportion of urban residents' food consumption in total consumption expenditure in China dropped from 57.5% in 1978 to 34.8% in 2015 (see figure 16). The Engel coefficient gap between urban residents and rural residents also decreased from 1994 till 2014, which accounts for the increase of per capita disposable income. Overall Chinese consumers are spending more on other things like Baijiu, than food.
Baijiu industry outlook
The National Bureau of Statistics has released the 2017 China's Baijiu industry data, in which the total volume of Baijiu made in 2017 was 11.98 million kiloliters, a decrease of 11.78% compared to 2016. The sales revenue of Baijiu was CNY 612.57 billion, corresponding to an increase of 14.4% YoY, and the total profit was CNY 102.85 billion, an increase of 9.24% (see Figures 17 and 18).
In the first quarter of 2018, the total operating income of listed companies in the Baijiu industry was CNY 61.69 billion, an increase of 27.65% YoY, and the net profit grew by 38.30% YoY to CNY 22.79 billion. The sales
Source: Wind
40% 5% 50% 50% 10% 45% 0% 10% 20% 30% 40% 50% 60% 70% 80% 90% 100% 2012 2016 Private consumption Business consumption Government consumption Source: China industry information 10.30% 4.97% 3.44% 1.79% 1.21% 78.29% Kweichow Maotai Wuliangye Yanghe Gufen Luzhou Laojiao Gujing Gongjiu Others Source: Wind
Figure 18: Operating income of Baijiu industry in China
Figure 19: Consumption structure of Baijiu in China
Figure 20: 2017 Chinese Baijiu market share on value basis
revenue and net profit of second level Baijiu (a kind of Baijiu close to high-end Baijiu) in 2018 Q1 increased by 31.41% and 44.24% YoY, respectively. Due to the optimization of product structure and construction of the sales chain, the sales for high-end and second level Baijiu is expected to maintain the upward trend in 2018.
Between 2002 and 2012, the Baijiu industry boomed and the CAGR of production increased by 20% (see Figure 17). The total consumption of Baijiu is three parts: government, business and private consumptions. In 2012, the percentage of total consumption for those parts were 40%, 50%, and 10%, respectively. The proportion of government consumption was high, and consequently the Baijiu industry has extremely affected by the anti-corruption policies enacted in April of 2012. Since then, Chinese government has inhibited the consumption of public funds on official car usage, meals and oversea visits. As a result, the growth rate of Baijiu production has significantly declined from 18.55% in 2012 to 2.75% in 2014 and the sales revenue growth rate has experienced a dramatic decrease from 26.82% in 2012 to 5.7% in 2014 (see Figures 17 and 18). To overcome the reduction on public consumption, Baijiu companies turned to the masses since 2013, through innovations in sales chain, product system, team system. In recent years, the growth rate of private consumption has surpassed the government consumption growth rate. In 2016, private consumption accounted for half of total consumption, while government consumption only accounted for 5% (see figure 19).
The overall Baijiu market in China is highly fragmented. Figures 20 and 21 present that five leading Baijiu producers account only for approximately 22% of total market capacity in 2017 and accounted for 14.46% in 2015. Meanwhile, the top two producers are mainly focusing on high-end Baijiu. In the future, it is expected that market of Baijiu industry will gradually concentrate on high-end Baijiu. The high-end Baijiu companies, Kweichow Maotai and Wuliangye have experienced
5.88% 3.66% 2.82% 1.18% 0.92% 85.54% Kweichow Maotai Wuliangye Yanghe Gufen Luzhou Laojiao Gujing Gongjiu Others Source: Wind
Figure 21: 2015 Chinese Baijiu market share on value basis
higher growth rates than other enterprises in this industry. The market share of Kweichow Maotai has increased from 5.88% in 2015 to 10.30% in 2017, while Wuliangye has grown from 3.66% to 4.97%. In general, the market share of 10 leading enterprises has raised from 17.10% in 2015 to 25.14% in 2017.
Since Baijiu is high concentration alcohol, it is not good for health. In recent years, a large amount mid- & low-end Baijiu companies is working on research and development for healthier Baijiu products.
Peer group
As mentioned before, the Chinese Baijiu industry is a domestic and traditional industry. In total, there are 20 listed companies in the Baijiu industry. Based on the market shares, we can distinguish of between three types: the high-end Baijiu companies, such as, Kweichow Maotai, the Medium-end Baijiu companies like Gujing Gongjiu, and the Low-end Baijiu companies. Table 7 presents the list Baijiu companies by type.
Table 7: List of Baijiu companies in China
Middle-end Baijiu Companies Mkt cap CNY bn Shanxi Fenjiu Gujing Gongjiu Kouzijiao Jinshiyuan Yingjia Gongjiu Gujinggong B Shuijingfang Shunxing Nongye 30.0 25.7 23.3 16.6 15.2 14.7 12.0 11.4 Low-end Baijiu Companies Mkt cap CNY bn Laobaiganjiu Tuopai shede Yilite Keke qingjiu Jinhuijiu Jiuguijiu Jinzhongzijiu Huangtai jiuye 9.9 8.9 8.6 7.9 6.9 6.9 4.4 2.5 High-end Baijiu Companies Kweichow Maotai Wuliangye Yibin Yanghe Gufen Luzhou Laojiao Mkt cap CNY bn 592.7 211.3 130.8 79.9
8% 35% 39% 92% 65% 61% G U I Z H O U M A O T A I W U L I A N G Y E L U Z H O U L A O J I A O
High-end product Revenue Other revenue
Source: Wind, author
Figure 22: 2016 Gross profit distribution for high-end baijiu company
Table 8: Peer Group
Company Name Recent Price (CNY)
Market Cap (CNY billion) Price/Earnings Wuliangye Yibin 74.19 211.3 21.04 Yanghe Gufen 134.11 130.8 25.29 Luzhou Laojiao 56.20 79.9 22.66 Gujing Gongjiu 95.09 25.7 27.71 Kouzijiao 56.83 23.3 23.48
Source: China industry information, author, 27/07/2018
Comparative Analysis
Baijiu is typically made by mixing steamed sorghum grains, water, and a special fermentation. The process of production is affected by the geographic conditions and technology used by the company. Therefore, high-end Baijiu companies are able to differentiate their products based on those characteristics. Figure 22 presents the gross profit of the high-end Baijiu companies. High-end products account for the greatest share on profits, their strategy will be to improve the quality of traditional high-end Baijiu and maintain their competitive advantage. For instance, Wuliangye increased 54.1% YoY the investment in R&D in 2016.
The medium-end companies’ is to develop new and healthier products with lower price to expand their markets and increase profitability. Their investments have been mostly on advertising, accounting for 4% to 8% COGS. High-end companies invest 2% to 5% in advertising. In contrast, low-end companies have a broad market and their strategies rely on price and cost advantage.
0 1 2 3 4 5 Industry rivalry Bargaining power of suppliers Bargaining power of customers Threat of substitutes Threat of new entrants
Source: Author, company data Figure 23: Porter’s five forces SWOT analysis
Table 9: SWOT analysis of Wuliangye Yibin
Strengths Weaknesses
➢ One of the market leaders in the industry
➢ State-owned enterprise ➢ Innovation of “1-3-3” program ➢ Strong brand recognition ➢ Customers loyalty ➢ Low level of debt ➢ Geographical advantages ➢ Investment in R&D
➢ ➢ Lack of international market
➢ Single product – only Baijiu
Opportunities Threats
➢ Expansion to international markets ➢ Technological innovation for
healthier Baijiu product
➢ ➢ Government regulations and
policies
➢ Economic slowdown in China ➢ Tax policy
➢ Fragmented industry Trade Tariffs
Porter’s Five Forces
Threat of new entrants: Low
There are several barriers to entry in the Baijiu industry. For instance, new entrants need a large amount of initial funds, equipment, technology and appropriate geographic site. They will also have to compare with existing Baijiu companies which have already built up a reputation and have a high level of customers’ loyalty. It makes new entrants hard to obtain large market share. The threat of new entrants is low in the Baijiu industry.
Bargaining power of customers: Medium-low
The primary clients for Baijiu industry are distributors and dealers, who buy products in large quantities, with medium bargaining power. At the same time, with the implement of “1-3-3” strategy, the company expects to gradually sell directly to the end users. The bargaining power of customers represents a medium-low threat to the company.
26.23%
22.14% 36.37%
15.26%
Baijiu Wine Beer Others
Source: Wind, author
Figure 24: Proportion of alcohol sales of China in 2017
Bargaining power of suppliers: Medium-low
The cost of raw materials and production constitute the primary costs of Baijiu products. In China, there are a large number of manufacturers, therefore Baijiu companies have a number of choices of suppliers. Even though China enjoys an enormous production of grains, the output and price of raw materials are highly affected by weather conditions. Considering those two factors, the bargaining power of suppliers is medium-low.
Threat of substitutes: Medium-high
Even though Wuliangye Yibin has different series of Baijiu, the company only sells one type of beverage: Baijiu. There is a possibility that consumers might substitute Baijiu by wine, beer and other spirits (see Figure 24). Compared with Baijiu, wine has a better taste and is healthier. In terms of the price, beer is less expensive. Moreover, since China entered World Trade Organization (WTO), the tariffs on foreign spirits has dropped, which resulted in the pouring of a large amount of foreign spirits into the Chinese market. However, as mentioned before, Baijiu plays an important role in meals in China, thus it is irreplaceable in official and business occasions. Threat of substitutes is medium-high. Industry rivalry: Moderate
As mentioned before, Baijiu industry is highly fragmented. The geographic conditions affect Baijiu flavours and tastes. Thus, each region prefers different preference of brands. With the strong brand and client loyalty, the industry rivalry is moderate.
Figure 25: Monte Carlo simulation
5. Investment Summary
SELL is our recommendation for Wuliangye Yibin with a price target of CNY 72.63 at YE2018 using Flow to Equity (FLE) method. This offers a downside potential of 3.78%, in comparison with the closing price of CNY 75.49 on March 8th of 2018,
although with high risk (Table 10). The relative valuation supports our Sell recommendation (Table 11), since we obtained an average price target of CNY 77.41, representing an upside potential of 2.55%.
With respect to Wuliangye Yibin’s core business, the company is market leader in the industry. It is expected to see a 2018F to 2022F revenue CAGR of 8.2%. Due to the improvement in the sale channel, there was an increase of EBIT margin from 40.91% in 2018F to 46.42% in 2022F and net profit margin by from 32.05% in 2018F to 36.45% in 2022F.
During 2018F to 2022F, we expect a decrease of the total asset turnover, reflecting a drop in efficiency with which a company is deploying its assets in generating revenue. Moreover, the reduction of financial leverage accelerates the downward trend of ROE and ROA.
There is possibility of mergers and acquisitions with another company of the industry, but it’s virtually impossible to predict who or when is going to be acquired.
Valuation Methods
We obtained our target price using Discounted Cash Flow (DCF), more specifically the FTE method. We use this model because the debt-to-equity ratio is very low. Concerning the relative valuation method, we used the multiple approach through P/E, P/B and P/sales ratios.
Investment Risks
Investors must be aware of the impact of political regulation, Chinese economic slowdown and volatility of Chinese stock market. All these factors might indirectly affect Wuliangye Yibin’s ability to generate sales revenue.
In order to compute the impact of the main investment risks on the price target, we performed a sensitivity analysis and a Monte Carlo simulation. The Monte Carlo simulation’s average price is CNY 73.72, the median is CNY 72.7 and the standard deviation is CNY 8.94. These numbers support our Sell recommendation.
Table 10: DCF Method
DCF Method Value of equity net of minority interest 432.168 B Shares outstanding 3.8 B Price target ¥72.63 Current price 2018/3/8 ¥75.49 Downside potential 3.78% Source: Author, Company data
Table 11: Multiple Method
Multiple Method P/E Price target ¥72.08 P/B Price target ¥91.72 P/Sales Price target ¥68.45 Average Price target ¥77.41 Current price
2018/3/8
¥75.49 Upside potential 2.55% Source: Author, Company data
36% 22% 18% 16% 8% Sorghum Rice
Sticky rice Wheat
Corn
Source: Wind, author
Figure 26: Percentage of Baijiu's components
6. Valuation
We used Wuliangye Yibin’s consolidated statement for the period between 2015 and 2017, industry data, and global economic data to perform the valuation.
Key Valuation Drivers Total Revenue
Wuliangye Yibin’s total revenue was determined by estimating the sales for each business unit (BU). We focus on estimating the revenues of high-end Baijiu and mid- & low-end Baijiu, since these two BUs account for 70.87% and 22.19% of total revenue, respectively.
We assume that the quantity of high-end Baijiu will increase at the same rate as Chinese GDP growth rate (IMF, 2017), for the next five years. As for the price of Baijiu, we estimated a growth rate of 3%, higher than the inflation rate (IMF, 2017), for both types of Baijiu. Meanwhile, since the company intends to reduce low-end products, the quantity and price of mid- & low-end Baijiu are expected to increase less than the sales of high-end Baijiu.
The revenue of the other business units is expected to grow at the same rate as the Chinese GDP growth rate, until 2022F.
To forecast the BU’s revenue, we multiply the estimated quantity of high-end and mid- & low-end Baijiu by the respective expected unit prices then, we add the estimated revenue of other business units.
Main Cost
The company’s main costs include raw material cost, employee wage expenses, cost of energy and manufacturing.
Baijiu is made by sorghum, rice, sticky rice, wheat and corn, according with the percentages presented in Figure 26. We collected the price information for each component though the Chinese Cereal Center and compute a weighted average of the raw materials price per ton, according to the percentage of each component. Based on industry average, 5 tons grains could make 1 ton Baijiu which represents productivity for grains to Baijiu. Note that we assume that Wuliangye Yibin’s will be more efficient in producing Baijiu in following years, thanks to the “Recruitment Program of Expert”. We multiply total quantity of Baijiu sold by the production rate to get the total raw material cost. Due to the company’s
will increase more than other expenses for next years. Capital Expenditure (CapEx)
The estimation of the company’s CapEx includes Gross PP&E, other long-term assets and intangible assets. For each component, we compute the ratio of Capex as a percentage of revenue. Since the company intends to expand its distribution channels in recent years, we expect that each CapEx component will increase in line with the historical average Capex as a percentage of revenue.
Regarding depreciation and amortization (D&A), we assumed that it will grow following the historical average, respectively (Appendix 10).
Net Working Capital (NWC)
The non-cash working capital of this company is composed by current asset items and current liability items. Since working capital includes all the items related to the operational activity of the company, we add the deferred income taxes and deferred income taxes to calculate NWC. We assume that inventory, receivables, prepaid expenses, deferred income taxes, other current assets, accounts payable, deferred revenues, taxes payable and other current liabilities will be a stable proportion of the revenues along the past 3 years (Appendix 11).
Valuation Methodology
To value Wuliangye Yibin, we follow the Discounted Cash Flow (DCF) approach. A Dividend Discount Model is not suitable since the dividend distribution is not constant across the past years. The company’s capital structure is constant over year and the debt-to-equity rate was approximately 1% in 2017 (Appendix 9). Thus, we compute the equity value of Wuliangye Yibin through estimating the Free Cash Flow to Equity (FCFE) and using the FTE method.
Discounted Cash Flow Valuation
We consider the valuation period of five years, from the base date 1 January 2018 to 31 December 2022. At the end of this period, we added a terminal value.
Re: Since we used the FCFE to forecast company’s value, the discount
shareholders require for the company. We computed a cost of equity of 9.04%, applying the following formula:
Re = Rf + β ∗ ERP
Risk-free rate: According to the Moody’s rating (January 2018), Chinese
sovereign credit rating is A1, which presents adjusted default spread of 0.72%. We added this rate to the yield to maturity of a 10-year Chinese government bond to get the risk-free rate. The value obtained was 4.35%.
Beta: We compute a regression between the monthly returns of Wuliangye
Yibin’s stock and the benchmark (SZSE COMP SUB IND) during the last five years. Then we compute the adjusted beta, which equals 0.795.
Equity Risk Premium (ERP): We consider as the market risk premium
(MRP) of US the value of 5.08%, based on Damodaran’s Database (2018). Then, we add the Country Risk Premium of China. In total, the ERP equals 5.89%.
Cost of Debt (Rd): We compute the average of historical interest coverage
ratio of last three years, 521.17. Base on the Damodaran’s Ratings, Spreads and Interest Coverage Ratios tables, the rating of company is AAA and the spread is 0.54%. We reach to the cost of debt of 5.70%, using the following equation:
Rd = Rf + Country Risk Premuim + Company Risk Premuim
Effective tax rate:
We compute the average of the last three years effective tax rate, 24.7%. Thus, we assume an average value for the tax rate of 24.7%.
Terminal value:
We considered that the perpetual growth rate (g) is affected by the Chinese GDP growth rate and inflation rate for the end of the forecasted period. Our expected perpetual growth rate is 3.5%.
Relative Valuation Approach (Multiple Valuation)
To complement DCF approach, we present a price range for Wuliangye Yibin using the relative valuation method using the multiples P/E, P/B
and P/Sales. To improve the multiples’ accuracy, the multiples were adjusted for outliers to avoid selection bias. According to P/E ratio, the Wuliangye Yibin’s share price equals CNY 72.08, representing a downside potential of 4.52%. For the P/B and P/Sales, we reach the price target of CNY 91.72 and CNY 68.45, respectively. Computing an average value of three multiples, we obtain a price target of CNY 77.41 with an upside potential of 2.55%, which supports our conclusion. With the multiples approach, our recommendation remains to Sell.
7. Financial Analysis
EBIT margin & Net profit margin
Due to improvements in the sale channels, the sales cost in 2017 was CNY 3.63 billion, a YoY decrease of 22.77%. Therefore, there was an increase on EBIT margin by 6.48% YoY and Net Profit margin by 4.41% in 2017. We assume a sustained growth for the period between 2018 and 2022 (Figure 27). Along with the “Recruitment Program of Expert”, we assume that production will be more efficient, supporting the upward tendency in EBIT & Net Profit margin from 2018F to 2022F. Nevertheless, payroll expense will continue to increase.
ROE & ROA
Following the same reasons mentioned in the previous paragraph, the Return on Equity (ROE) increased by 3.73% YoY and the Return on Asset (ROA) increased 2.73% YoY in 2017. During 2018F to 2022F, we expect the revenue to grow at a slower pace, decreasing the total asset turnover. This presents a drop in efficiency. Moreover, the reduction of financial leverage accelerates a downward trend of ROE and ROA (Figure 28 and 29). 34.65% 34.43% 40.91% 42.69% 44.07% 45.04% 46.26% 46.42% 28.51% 27.64% 32.05% 33.64% 34.67% 35.41% 36.33% 36.45% 0.00% 10.00% 20.00% 30.00% 40.00% 50.00% 2015 2016 2017 2018F 2019F 2020F 2021F 2022F
EBIT Margin Net Profit Margin
Source: Company Data, author
500.33 291.41 771.75 470.33 485.53 496.28 509.71 511.47 0.00 100.00 200.00 300.00 400.00 500.00 600.00 700.00 800.00 900.00
Interest coverage ratio
Figure 30: Interest coverage ratio of Wuliangye Yibin
Figure 28: ROE & ROA
Figure 29: Net profit margin, Equity multiplier & Asset turnover
Interest coverage ratio
This ratio represents the company’s capacity to pay interests on outstanding debt. Since Wuliangye Yibin have a low value on outstanding debt, the interest coverage ratio maintains a high level, which indicates that the company is able to pay its debts (Figure 23).
8. Investment Risk
Operational Risks
Brand Reputation Risk (OR1)
Competition in the Baijiu industry, as a matter of fact, is based on brand awareness. A well-known brand has high pricing power, high profit margin, and high market shares. The image of the company and brand is very important for the businesses. Any bad news of product’s quality or an inappropriate behavior of company’s manager will cause a bad effect on the company’s reputation. Then, we consider that there is a low/medium probability for this risk to occur, with a high impact for the
14.25% 14.41% 18.14% 18.38% 18.29% 18.04% 17.86% 17.33% 11.75% 10.91% 13.64% 14.09% 14.06% 13.92% 13.82% 13.45% 0.00% 5.00% 10.00% 15.00% 20.00% 2015 2016 2017 2018F 2019F 2020F 2021F 2022F ROE ROA 28.51% 27.64% 32.05% 33.64% 34.67% 35.41% 36.33% 36.45% 1.21 1.32 1.33 1.30 1.30 1.30 1.29 1.29 0.41 0.39 0.43 0.42 0.41 0.39 0.38 0.37 0.00% 20.00% 40.00% 60.00% 80.00% 100.00% 120.00% 140.00% 2015 2016 2017 2018F 2019F 2020F 2021F 2022F
Net Profit Margin Equity Multiplier (x) Total asset turnover
Source: Company Data, author
Source: Company Data, author
Figure 31: Risk Matrix Geographic location and Climatic Conditions (OR2)
The geographic location and the climatic conditions play an important role in product’s quality. As mentioned before, Wuliangye Yibin’s production site is one of the most suitable places for the fermentation for high-quality distilled liquor. However, Sichuan province is located on a seismic zone and in 2008 experienced a 7.8-magnitude earthquake. Due to possible unexpected earthquake and increase pollution of China, we consider that there is a low/medium probability for this risk to occur, with a high impact for the company.
Supply Chain of Raw Materials Risk (OR3)
China is a big importer of a few agriculture products, such as sorghum. In 2017, the demand for sorghum in China was 8.9 million tons, of which 57% was imported and 94% of the imported volume came from the United States. The increased trade tensions might increase the price of sorghum, which will reduce the profit of the Baijiu industry. Thus, we consider that there is a high probability for this risk to occur, with a medium impact for the company.
Economic and Market Risks
GDP Growth (EMR1)
According to IMF, China’s GDP growth rate will decelerate in the following years. Since Wuliangye Yibin is highly exposed to the Chinese market, lower consumption per capita will result in harm to company’s operating activities. We consider that there is a medium/high probability for this risk to occur, with a high impact for the company.
Interest Rate Risk (EMR2)
The financial leverage of Wuliangye Yibin is low. The company’s business is mainly financed by equity instead of debt. In the Chinese capital market, the interest rate is expected to hold between 4.35% and 4.9%, adjusted to debt maturity. Therefore, we consider that there is a low probability for this risk to occur, with a low impact for the company. Credit Risk (EMR3)
Credit risk is mainly related to account receivables. A large amount of bad
debt will result in a financial lost for the company. In the Baijiu industry, distributors and dealers usually choose to prepay for product to guarantee their supply. Therefore, between 2015 and 2017, the account receivables only accounted for 0.18% of total asset. We consider that there is a low/medium probability for this risk to occur, with a low impact for the company.
Industry Competitiveness (EMR4)
Baijiu industry is highly fragmented and probably the industry will host potential mergers and acquisitions. In 2016, mergers and acquisitions in Baijiu industry hit a peak with CNY 1.24 billion in deal. In 2017, it fell to CNY 0.27 billion, a sharp decline of 78.16%. However, according to the Baijiu industry analysis report, there is a continuous trend in following years that large companies will acquire smaller ones. In past, Wuliangye Yibin did not participate in any mergers and acquisitions, while other large Baijiu companies saw their competitive position strengthened by acquiring small companies. We believe that there is a medium probability for this risk to occur, with a medium impact for the company.
Exchange rate risks (EMR5)
Chinese currency is on depreciation trend. This will make imports of agriculture products more expensive. However, a slight increase on the price of some raw materials will not have huge impact on the company. Note that Wuliangye Yibin focus on the Chinese domestic market, therefore this will not affect the sales of the company. We believe that there is a medium/high probability for this risk to occur, with a low impact for the company.
Political and Regulatory Risks
Political regulatory and social risks (PRR1)
As mentioned previously, before 2013, the main consumers of Baijiu were business and government sectors. After the establishment of anti-corruption laws, the Baijiu sales sharply dropped. In addition, Wuliangye Yibin is a large state-owned company. Its corporate governance system reflects that the company is susceptible to political issues. In the future, there is uncertainty regarding government’s regulation on the consumption of Baijiu. Thus, we believe that there is a
medium probability for this risk to occur, with a high impact for the company.
Tax policy (PRR2)
The government implemented a composite levying consumption tax on liquor enterprises. For the Baijiu companies, one part of the tax is based on price, 20% of the sales price and another is based on quantity, which means companies pays CNY 1 for each one-kilogram Baijiu product. Since May of 2017, the State Administration of Taxation strictly applied this law. In 2017, the tax revenue of all listed Baijiu companies was 54 billion, an increase of 24.48% YoY. In the future, according to the industry analysis report, it is expected that government will adjust tax policy in the Baijiu industry. We consider that there is a medium probability for this risk to occur, with a high impact for the company.
Risks to Price Target
We performed a sensitivity analysis to assess the impact of the main investment risks on Wuliangye Yibin’s price target. These risks are inherent to the valuation model. We analyzed the following drivers: growth rate and cost of equity (Table 12).
Table 12: Sensitivity analysis
Changes in Growth Rate
¥ 72.63 2.75% 3.00% 3.25% 3.50% 3.75% 4.00% 4.25%
Price 65.24 67.50 69.96 72.63 75.56 78.78 82.34
Change (%) -10.18% -7.07% -3.69% 4.03% 8.47% 13.36%
Changes in Cost of Equity
¥ 72.63 8.25% 8.50% 8.75% 9.04% 9.25% 9.50% 9.75%
Price 84.76 80.51 76.66 72.63 69.97 67.04 64.34
Change (%) 16.70% 10.85% 5.55% -3.67% -7.71% -11.42%
To complement the sensitivity analysis, we applied a Monte Carlo simulation. Wuliangye Yibin’s target price is highly influenced by four main factors: terminal growth rate, risk-free rate, equity risk premium, and productivity for grains to Baijiu. We assumed that all the input factors follow a normal distribution and a respective standard deviation of 0.57% for the terminal growth rates, of 0.5 for productivity, of 0.59% for equity risk premium, and of 0.44% for risk-free rate.
The Monte Carlo simulation average price target equals CNY 73.72, the median equals CNY 72.70 and the standard deviation equals CNY 8.94 (Figure 31). With a confidence level of 95%, the Wuliangye Yibin’s share price will be between CNY 59.27 and CNY 94.04, which supports our SELL recommendation.
Figure 32: Monte Carlo simulation
9. References
Books
Pinto, J. E., Henry, E., Robinson, T. R. and Stowe, J.D. (2010). Equity Asset Valuation, CFA Institute Investment Series, 2ª Ed. John Wiley & Sons.
Damodaran, A. (1994). Damodaran on valuation: Security analysis for investment and corporate finance. Stern School of Business.
Damodaran, A. (2008). Equity Risk Premiums (ERP): Determinants, Estimation and Implications. Stern School of Business.
Damodaran, A. (2012). Investment Valuation: Tools and Techniques for determining the value of any asset. 3ª Ed. Hoboken, New Jersey: John Wiley and Sons.
Feng Gu and Baruch Lev. (2017). Time to Change Your Investment Model, Financial Analysts Journal. Jens Overgaard Knudsen, Simon Kold, and Thomas Plenborg. (2017). Stick To The Fundamentals And
Discover Your Peers. CFA Institute: Financial Analysts Journal.
Jeremy J. Siegel. (2016). The Shiller CAPE Ratio: A New Look. CFA Institute: Financial Analysts Journal. Jonathan B. Berk and Jules H. van Binsbergen. (2017). How Do Investors Compute The Discount Rate?
They Use The CAPM. CFA Institute: Financial Analysts Journal.
Scott Richardson, Richard Sloan, Haifeng You. (2012). What Makes Stock Prices Move? Fundamentals vs.
Investor Recognition. CFA Institute: Financial Analysts Journal.
Stephen Foerster, John Tsagarelis, Grant Wang. (2017). Are Cash Flows Better Stock Return Predictors
Than Profits. CFA Institute: Financial Analysts Journal.
Investor Relations – Company Consolidated Reports Wuliangye Yibin’s annual report from 2012 to 2017
Databases and Websites Aswath Damodaran Database
Baijiu industry analysis - https://www.qianzhan.com/analyst/detail/220/180604-c75ed532.html Baijiu industry analysis - http://www.moutaichina.com/xinwen/2018/3680.html
Bloomberg Database
Chinese Cereal Center - http://www.cereal.com.cn/ IMF (2017) World Economic Outlook
IMF (2018) World Economic Outlook National Bureau of Statistics
Appendix 1: Consolidated Balance Sheet
2015 2016 2017 2018F 2019F 2020F 2021F 2022F
Goodwill 2 2 2 2 2 2 2 2
Intangible assets 412 402 399 393 389 385 381 379
Gross property, plant and
equipment 5904 5726 5566 5700 5709 5817 5969 6121
Other long-term assets 992 922 996 968 988 1014 1045 1081
Deferred income taxes 640 618 680 680 680 680 680 680
Total non-current assets 7949 7670 7643 7743 7768 7897 8077 8263
Inventories 8701 9257 10558 12350 13415 14563 15776 17055
Receivables 107 108 110 142 154 168 181 196
Prepaid expenses 332 272 198 361 392 425 461 498
Other current assets 9083 10202 11822 12413 13158 13816 14783 15670 Cash and cash equivalents 26374 34666 40592 45379 53019 61582 70951 81205
Total current assets 44597 54505 63280 70646 80138 90554 102153 114624
Total assets 52547 62174 70923 78388 87906 98451 110230 122888
EQUITY 44346 48206 54674 61524 69250 77815 87334 97659
Common stock 3796 3796 3796 3796 3796 3796 3796 3796
Additional paid-in capital 953 953 953 953 953 953 953 953 Retained earnings 38579 42327 48585 55322 62866 71228 80523 90604 Parent company's shareholders 43329 47077 53334 60071 67615 75977 85272 95353 Minority interest 1017 1129 1340 1453 1635 1838 2062 2306
LIABILITIES 8201 13968 16248 16864 18656 20636 22896 25228
Long-term Borrowings 0 0 0 0 0 0 0 0
Deferred revenues 227 281 280 283 286 289 292 295
Total Non-Current Liabilities 227 281 280 283 286 289 292 295
Accounts payable 1058 2171 3138 2640 2867 3113 3372 3646
Short-term Borrowings 206 327 630 478 519 564 611 660
Taxes payable 1042 1092 2645 2856 3209 3484 3984 4307
Other current liabilities 5661 10097 9556 10607 11774 13187 14637 16321
Total Current Liabilities 7968 13687 15968 16581 18370 20347 22604 24933 Total liabilities and
Appendix 2: Consolidated Income Statement
2015 2016 2017 2018F 2019F 2020F 2021F 2022F
Sales revenue 21659 24544 30187 32828 35657 38709 41935 45334
COGS 6672 7314 8450 9216 9875 10730 11532 12394
Gross profit 14987 17230 21737 23612 25782 27979 30402 32939
Sales, General and
administrative 5697 6838 5894 6566 6775 6968 7129 7707
Other operating expenses 1785 1941 3495 3033 3295 3577 3875 4189
Total operating expenses 7482 8779 9389 9599 10070 10544 11004 11896
Interest Expense 15 29 16 30 32 35 38 41
Other income (expense) 796 916 1060 1195 1298 1409 1526 1650 Income before taxes 8287 9337 13392 15178 16978 18809 20887 22653 Provision for income
taxes 1877 2281 3306 3749 4194 4646 5159 5595
Other income 0 0 0 0 0 0 0 0
Net income from
continuing operations 6410 7057 10086 11429 12784 14163 15728 17058
Other -234 -272 -412 -387 -421 -457 -495 -535
Net income 6176 6785 9674 11042 12364 13706 15233 16523
Attributable to:
Equity shareholders of the
parent company 6176 6785 9674 11042 12364 13706 15233 16523 EPS 1.63 1.79 2.55 2.91 3.26 3.61 4.01 4.35 Diluted EPS 1.63 1.79 2.55 2.91 3.26 3.61 4.01 4.35 Weighted average shares outstanding Basic 3796 3797 3797 3797 3797 3797 3797 3797 Diluted 3796 3797 3797 3797 3797 3797 3797 3797 EBIT 7505 8451 12348 14013 15712 17435 19399 21044
Appendix 3: Common Size Consolidated Balance Sheet
2015 2016 2017 2018F 2019F 2020F 2021F 2022F
Goodwill 0.00% 0.00% 0.00% 0.00% 0.00% 0.00% 0.00% 0.00%
Intangible assets 0.78% 0.65% 0.56% 0.50% 0.44% 0.39% 0.35% 0.31% Gross property, plant and
equipment 11.24% 9.21% 7.85% 6.66% 6.05% 5.60% 5.21% 4.86%
Other long-term assets 1.89% 1.48% 1.40% 1.23% 1.12% 1.03% 0.95% 0.88% Deferred income taxes 1.22% 0.99% 0.96% 0.87% 0.77% 0.69% 0.62% 0.55% Total non-current assets 15.13% 12.34% 10.78% 9.27% 8.39% 7.71% 7.12% 6.60% Inventories 16.56% 14.89% 14.89% 15.76% 15.26% 14.79% 14.31% 13.88%
Receivables 0.20% 0.17% 0.16% 0.18% 0.18% 0.17% 0.16% 0.16%
Prepaid expenses 0.63% 0.44% 0.28% 0.46% 0.45% 0.43% 0.42% 0.41%
Other current assets 17.29% 16.41% 16.67% 15.84% 14.97% 14.03% 13.41% 12.75% Cash and cash
equivalents 50.19% 55.76% 57.23% 58.50% 60.76% 62.86% 64.57% 66.20% Total current assets 84.87% 87.67% 89.22% 90.73% 91.61% 92.29% 92.88% 93.40% Total assets 100.00% 100.00% 100.00% 100.00% 100.00% 100.00% 100.00% 100.00% EQUITY 84.39% 77.53% 77.09% 78.49% 78.78% 79.04% 79.23% 79.47%
Common stock 7.22% 6.11% 5.35% 4.84% 4.32% 3.86% 3.44% 3.09%
Additional paid-in capital 1.81% 1.53% 1.34% 1.22% 1.08% 0.97% 0.86% 0.78% Retained earnings 73.42% 68.08% 68.50% 70.57% 71.52% 72.35% 73.05% 73.73% Parent company's shareholders 82.46% 75.72% 75.20% 76.63% 76.92% 77.17% 77.36% 77.59% Minority interest 1.94% 1.82% 1.89% 1.85% 1.86% 1.87% 1.87% 1.88% LIABILITIES 15.61% 22.47% 22.91% 21.51% 21.22% 20.96% 20.77% 20.53% Long-term Borrowings 0.00% 0.00% 0.00% 0.00% 0.00% 0.00% 0.00% 0.00% Deferred revenues 0.43% 0.45% 0.39% 0.36% 0.33% 0.29% 0.26% 0.24% Total Non-Current Liabilities 0.43% 0.45% 0.39% 0.36% 0.33% 0.29% 0.26% 0.24% Accounts payable 2.01% 3.49% 4.42% 3.37% 3.26% 3.16% 3.06% 2.97% Short-term Borrowings 0.39% 0.53% 0.89% 0.61% 0.59% 0.57% 0.55% 0.54% Taxes payable 1.98% 1.76% 3.73% 3.64% 3.65% 3.54% 3.61% 3.50%
Other current liabilities 10.77% 16.24% 13.47% 13.53% 13.39% 13.39% 13.28% 13.28% Total Current
Liabilities 15.16% 22.01% 22.51% 21.15% 20.90% 20.67% 20.51% 20.29% Total liabilities and
stockholders' equity 100.00 % 100.00 % 100.00 % 100.00 % 100.00 % 100.00 % 100.00 % 100.00%