FINANCE
M
ASTER
’
S
F
INAL
W
ORK
PROJECT
EQUITY
RESEARCH:
JERÓNIMO
MARTINS
P
EDRO
A
NTUNES
O
LIVEIRA
FINANCE
M
ASTER
’
S
F
INAL
W
ORK
PROJECT
EQUITY
RESEARCH:
JERÓNIMO
MARTINS
P
EDRO
A
NTUNES
O
LIVEIRA
SUPERVISOR:
J
ORGE
B
ARROS
L
UÍS
I
Abstract
This project aims to estimate the equity value of Jerónimo Martins, the company, leader of the Portuguese food distribution sector, quoted on Euronext Lisbon and included in PSI20, a benchmark stock market index of companies that trade on Euronext Lisbon.
This equity research only considers public information until 31st December 2018.
The main objective of this valuation is to compute a final estimation of the share price, in order to make an investment recommendation whether to buy, sell or hold the stock. At the end of 2018 Jerónimo Martins sales were 17,337 million euros, it employed 108,560 people and its net income was of 401 million euros. In Portugal, Jerónimo Martins has an history in food distribution of over 225 years, being also present in Poland for over 20 years and in Colombia for 6 years.
The valuation of Jerónimo Martins in this project is done considering the performance of the company in the past years, until the end of 2018, its perspective of growth and all factors that influence the operational results of the company.
The methods used in the valuation were the Discount Cash Flow method, the Discounted Dividend Model and a Market Based Valuation.
In the conclusion of this report, a recommendation of investment is given.
Keywords: Equity Research; Financial Valuation; Jerónimo Martins; Food Retailers & Wholesales; DCF; DDM; Multiples.
II
Resumo
Este projeto tem como objetivo estimar o valor patrimonial da empresa Jerónimo Martins, líder do setor de distribuição alimentar em Portugal. Empresa cotada na Euronext Lisbon e incluída no PSI20, o índice de referência das empresas que são negociadas na Euronext Lisbon.
Este projeto de avaliação patrimonial considera apenas informações públicas até 31 de dezembro de 2018.
O principal objetivo desta avaliação é calcular uma estimativa do preço da ação, a fim de fazer uma recomendação de investimento para comprar, vender ou manter as ações. No final de 2018, as vendas da Jerónimo Martins eram de 17.337 milhões de euros, empregavam 108.560 pessoas e o seu lucro líquido era de 401 milhões de euros. Em Portugal, a Jerónimo Martins tem uma história no setor da distribuição alimentar de mais de 225 anos, estando presente também na Polónia há mais de 20 anos e na Colômbia há 6 anos.
Neste projeto a avaliação do grupo Jerónimo Martins é feita considerando o desempenho da empresa nos últimos anos, até o final de 2018, a sua perspetiva de crescimento e todos os fatores que influenciam os resultados operacionais da empresa. Os métodos utilizados na avaliação da empresa foram o método de fluxo de caixa descontado, o modelo de dividendos descontados e uma avaliação com base nas empresas comparáveis do mercado.
Na conclusão deste relatório, é dada uma recomendação de investimento.
Palavras-chave: Avaliação de Empresas; Avaliação Financeira; Jerónimo Martins; Retalho
III
Table of Contents
1. BUSINESS DESCRIPTION ... 7 2. BUSINESS IN NUMBERS ... 8 3. BUSINESS BY GEOGRAPHY ... 9 3.1. JMT IN PORTUGAL ... 9 3.1.1. Pingo Doce ... 9 3.1.2. Recheio ... 103.1.3. Hussel and Jeronymo ... 10
3.1.4. Macroeconomic Situation ... 11 3.2. JMT IN POLAND ... 12 3.2.1. Biedronka ... 12 3.2.2. Hebe ... 12 3.2.3. Macroeconomic Situation ... 13 3.3. JMT IN COLOMBIA ... 14 3.3.1. Ara ... 14 3.3.2. Macroeconomic Situation ... 15 4. CORPORATE GOVERNANCE ... 16 4.1. SHAREHOLDER STRUCTURE ... 16 4.2. COMMITMENT TO STAKEHOLDERS... 17 4.3. THE BOARD OF DIRECTORS ... 17 4.4. MODEL OF GOVERNANCE... 18 4.5. REMUNERATION POLICY ... 19 5. HIGHLIGHTS 2018 ... 20 6. DCF ... 21
6.1. VALUATION -DISCOUNTED CASH FLOW METHOD ... 21
7. DDM ... 26
7.1. DIVIDENDS ... 26
7.1.1. Dividend Discount Model ... 26
8. COMPARABLES ... 29
8.1. MARKET BASED VALUATION... 29
8.2. COMPARABLES BRIEF DESCRIPTION ... 29
8.3. VALUATION –MARKET BASED ... 31
9. CONCLUSION ... 33
DISCLOSURE AND DISCLAIMER ... 34
RECOMMENDATION SYSTEM ... 34
10. ATTACHMENTS ... 35
10.1. FINANCIAL STATEMENTS ... 35
10.2. PERFORMANCE BY BUSINESS AREA IN THE LAST 5YEARS ... 38
10.3. MAIN INDICATORS BY BUSINESS AREA IN THE LAST 5YEARS ... 39
10.4. PERFORMANCE BY GEOGRAPHY ... 40
10.4.1. Detailed Information by Operating Segments ... 40
IV
List of Figures
Figure 1- Sales, EBITDA Margin and EBIT Margin ... 6
Figure 2 - Business Vertical Structure ... 7
Figure 3 – Sales by Business Area 2018... 8
Figure 4 - EBITDA by Business Area 2018 ... 8
Figure 5 - Pingo Doce Logo ... 9
Figure 6 - Pingo Doce Sales (in million euros) ... 9
Figure 7 - Pingo Doce LFL Sales Growth ... 9
Figure 8 - Recheio Logo ... 10
Figure 9 - Recheio Sales (in million euros) ... 10
Figure 10 - Recheio LFL Sales Growth ... 10
Figure 11 - Biedronka Logo ... 12
Figure 12 - Biedronka Sales (in million euros) ... 12
Figure 13 - Biedronka LFL Sales Growth ... 12
Figure 14 - Ara Logo ... 14
Figure 15 - Ara Sales (in million euros)... 14
Figure 16 - Ara Store Network ... 14
Figure 17 - Jerónimo Martins Shareholders ... 16
Figure 18 - Board of Directors ... 17
Figure 19 - Model of Governance ... 18
Figure 20 - Highlights ... 20
Figure 21 - Ahold Delhaize Logo ... 29
Figure 22 - TESCO Logo ... 30
Figure 23 - Eurocash Grupa Logo ... 30
Figure 24 - METRO St. (XETRA) Logo ... 30
Figure 25 - X5 Retail Group Logo ... 30
V
List of Tables
Table I – Net Sales Forecast (in million euros)... 21
Table II - EBITDA Forecast (in million euros) ... 22
Table III - Forecasts (in million euros) ... 23
Table IV - Free Cash Flow to the Firm (in million euros) ... 24
Table V – DCF Variables ... 24
Table VI - DCF Valuation Method (in million euros) ... 25
Table VII - Dividend History (in euros per share) ... 27
Table VIII - Growth Rate in Perpetuity ... 27
Table IX - Valuation - DDM ... 27
Table X - Comparables Multiples ... 31
Table XI - Valuation - Market Based... 32
Table XII - Valuation Summary ... 33
Table XIII - Consolidated Balance Sheet ... 35
Table XIV - Consolidated Income Statment by Functions ... 36
Table XV - Consolidated Cash Flow Statement ... 36
Table XVI - Consolidated Cash Flow Statement discriminated by Activity ... 37
Table XVII - Consolidated Statement of Comprehensive Income ... 37
Table XVIII - JMT in the Market ... 37
Table XIX - Dividends 2014-2018 ... 37
Table XX - Pingo Doce ... 38
Table XXI - Recheio ... 38
Table XXII - Biedronka ... 38
Table XXIII - Key Indicators ... 39
Table XXIV - Net Sales and Services ... 39
Table XXV - EBITDA Mg ... 39
Table XXVI - LFL Growth ... 39
Table XXVII - Number of Employees ... 39
Table XXVIII - Portugal Retail ... 40
Table XXIX - Portugal Cash and Carry ... 40
Table XXX - Poland Retail ... 40
Table XXXI - Others, Eliminations and Adjustments ... 41
Table XXXII - Total JMT Consolidated ... 41
Table XXXIII - Sales and Services ... 42
Industry: Food Retailers & Wholesales
Stock Exchange: Euronext Lisbon
Ticker Code: JMT
Market Cap (in million euros): 6,507
Outstanding Shares: 629,293,220
Free Float: 28.7%
Nominal Value: 1.00€
Price (as of 31-Dec-2018): 10.34€
52-weeks range (€): 10-15€
Expected Return: 27.5%
IPO: November 1989
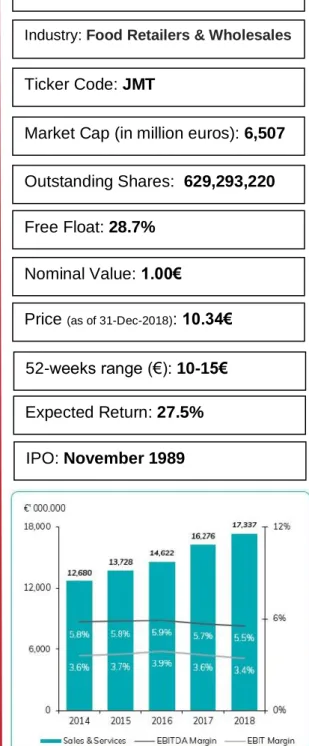
Figure 1- Sales, EBITDA Margin and EBIT Margin
Price Target(as of 31-Dec-2019): 13.18€
Unstoppable growth…
…with new threats ahead.
• Jerónimo Martins has been steadily asserting its leadership in the Portuguese retail market.
• An aggressive entry, announced for 2019, of the largest Spanish retailer - Mercadona, into the Portuguese market, may bring some extra competitiveness.
• Portugal, Poland and Colombia showing good signs of economic growth. In all these countries where Jerónimo Martins is present, wages have increased, unemployment has declined, and average consumer spending has risen.
• Polish new law, The Sunday Trading Ban, will force Jerónimo
Martins’ stores to close on Sundays. Biedronka, by far the food retail leader in Poland, is continuously winning market share and it will be a demanding task to make Sundays’ turnover in the rest of the week. • The investment in Colombia has proven to be the right bet to the
expansion of the company and has been growing quite positively. It is expected to reach the break even in the next 5 years.
• Jerónimo Martins has been exceeding the expectations of its stakeholders. This creates value for the company and increases investor confidence for the future, which is also expected to meet those investors’ expectations.
• Since the beginning of 2014 until the end of 2018 the overall situation of Jerónimo Martins has been improving at a good pace:
o Total sales increased 37% from 12,680€m to 17,337€m, Figure 1.
o Net results of 401€m in 2018 compared with 302€m in 2014. o Number of employees from went from 86,563 to 108,560 in 2018.
All information collected and all the computations made, lead to a
BUY recommendation:
✓ The Discounted Cash Flow (DCF) valuation method gave a share value for FY2018 of 13.18€. Comparing with the valuation as of December 2018 of 10.34€ a potential return of 27%.
✓ The Discount Dividend Model (DDM) pointed to a share value for FY2018 of 13.42€.
✓ When compared the EV/EBITDA and the P/E multiples of Jerónimo Martins with similar companies, it is drawn the conclusion that Jerónimo Martins’ shares are expected to outperform the market.
15 October 2019
Food Retail
Student: Pedro Oliveira
7
1. Business Description
Jerónimo Martins SGPS, SA (JMT) is an international Group based in
Portugal. Jerónimo Martins’ main operations are Food industry and Specialized Retail Sectors. It is a public company registered at the Commercial Registry Office of Lisbon.
The main mission of Jerónimo Martins is to please the requirements and prospects of its stakeholders and valid interests of its shareholders. JMT defends a responsible business management and assumes a sustainable value of creation and growth.
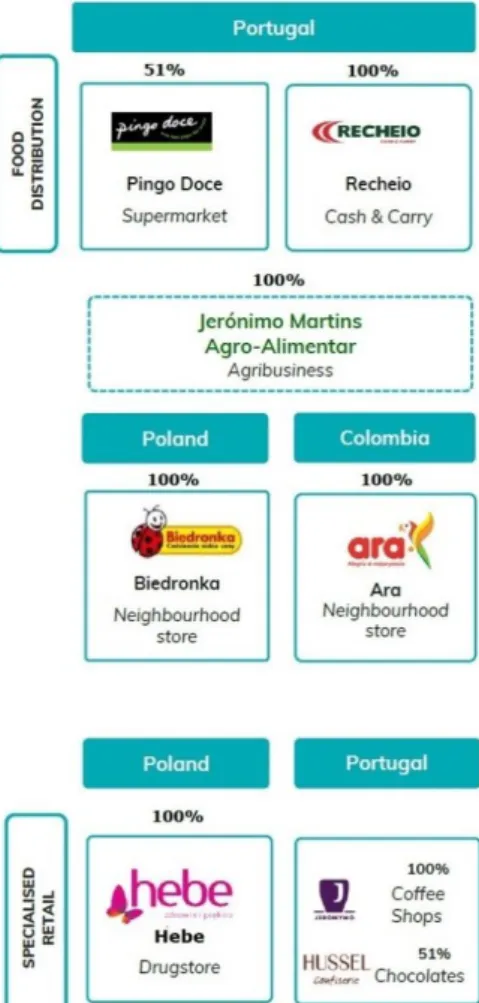
The company has currently operations in 3 countries, Portugal, Poland
and Colombia, Figure 2.
In order to meet its own mission of responsible business management, JMT applies several measures such as defending Human Rights and working conditions and, where present, tries to improve the quality of life of those communities.
8
2. Business in Numbers
Jerónimo Martins SGPS, SA has an experience in the food business of over 225 years. This accumulated know-how allowed to reach some incredible numbers.
As of 31/12/2018 the group had a total of 108,560 employees and 6.5 million euros of market capitalization on Euronext Lisbon.
In 2018 it had a new record sale of 17,337 million euros with a net income of 401 million euros, where the food distribution was responsible for 95% of the group’s consolidated sales, obviously its core business.
Most of the company's sales come from Poland mostly through
supermarkets named Biedronka, Figure 3 and Figure 4, with around
67.4% of total sales corresponding to an EBITDA of 88.6% of the company.
Pingo Doce and Recheio are the main businesses of Jerónimo Martins in Portugal correspondingly with supermarkets and cash and carry businesses. This part of the company represents 27.8% of total sales of the company and a 19.6% of the EBITDA.
Figure 3 – Sales by Business Area 2018
9
3. Business by Geography
3.1. JMT in Portugal
It was in Portugal, in 1972, where JMT opened its first store in the center of Lisbon.
At the end of 2018, in Portugal alone, JMT had 520 stores, 32,426 employees and a total of 4.8 billion euros in sales.
JMT is the food distributor leader in Portugal. JMT is present in Portugal with four different businesses, two in the food distribution and two in specialized retail.
3.1.1. Pingo Doce
Pingo Doce, logo in Figure 5, is the Portuguese leader in the
supermarket sector, with 432 stores spread across more than 300 locations throughout Portugal. Pingo Doce defines itself as a chain of supermarkets with competitive prices and high-quality food products. In the end of 2018, it was estimated that Pingo Doce stores covered a total area of more than 500,000 Sqm and were visited in total by more than 700,000 people per day. The 2018 total sales have been of 3,835 million euros.
In 2018, Pingo Doce opened 10 new stores, refurbished 29 and increased 21 in size. This continuous expansion shows that Pingo Doce is in good health and growing in Portugal. The consistent investment
strategy is also reflected in a growth of the LFL sales of 3.5%, Figure 7,
and in a sales growth of 4.6%, Figure 6, compared to 2017, leading to a
market share increase.
An EBITDA of 188 million euros was achieved by Pingo Doce in 2018 with a margin of 4.9%.
With almost 40 years of experience in Take Away and Perishables, Pingo Doce stood out for being the Portuguese consumers’ favorite food retailer Private Brand.
Pingo Doce has a continuous strategy to increase its market share, focusing on its pillars: The Private Brand; Price; Meal Solutions;
Figure 5 - Pingo Doce Logo
Figure 6 - Pingo Doce Sales (in million euros)
10
Perishables; and enhancing shopping experience. It also as a plan to open 10 new stores in 2019.
3.1.2. Recheio
Recheio, logo in Figure 8, is a chain of 42 stores operating in the cash
and carry sector, being also the Portuguese leader in this business. With more than 45 years in the cash and carry sector, Recheio is known to be the main partner of many big businesses in Portugal, such as restaurants, hotels and traditional retails.
This cash and carry chain has a covered area of more than 130,000 Sqm
in Portugal. The 2018 total sales were of 980 million euros, Figure 9, a
growth of 4.0% (4.4% LFL) when compared with the 2017 total sales of 942 million euros. These numbers are justified by the increase in both the number of costumers and the average value of the basket by customer.
Recheio has also three private brands, which corresponds to more than 50% of the profits when compared with the leading brands they sell in its stores. The weight of Recheio’s sales with its own Private Brand, reached 21.6% in 2018 and, in this last year alone, it launched 182 new products. Its main costumers, traditional stores, benefit from economies of scale and from its know-how.
The EBITDA of Recheio reached 53 million euros with a margin standing at 5.4% of sales.
In the last four years, Recheio won the prize Choice of the Professionals, awarded by the Portuguese center of valuation and satisfaction of the Consumers.
3.1.3. Hussel and Jeronymo
Hussel and Jeronymo are positioned in the specialized retail. Hussel is specialized in the chocolate retail chain and Jeronymo is a chain of coffee shops. Correspondingly they have 24 and 22 small stores. These small businesses will not be studied furthermore, and won’t be considered to this valuation, since the numbers are too small and the effect in the enterprise value and share price is almost insignificant.
Figure 8 - Recheio Logo
Figure 10 - Recheio LFL Sales Growth Figure 9 - Recheio Sales (in million euros)
11
3.1.4. Macroeconomic Situation
It’s easy to identify Portugal’s two big players in the retail market. Those are Jerónimo Martins and Sonae with their big supermarket and hypermarket channels Pingo Doce and Continente, correspondingly. The leaders in the grocery retail market are locals, but the international companies also have a huge importance in this sector, the French giants Intermaché and Auchan, the German discounters Lidl and Aldi, and the Spanish players DIA and Coviran.
In 2019, there will be a new arrival, Mercadona. Those leaders of the Spanish retail market have a total of 25 million euros planned to invest in the beginning of 2019 to open four stores in Porto. Later in the same year, the company expects to have already opened a total of 10 stores and 1 logistic block, all located in the north of Portugal.
This aggressive arrival of the huge neighboring company worries all national and international retail companies operating in Portugal. The arrival was announced in 2016, enough time for those already present, who do not want to facilitate this entry, to prepare themselves. In Portugal the economy shows good signs, with the year of 2018 being a continuous year of economic growth. The inflation stood at 1.0% and the GDP increased 2.1% last year. Exports have been growing since 2013, with a 7.8% growth in 2018 alone. The growth of domestic investment and exports helped the successive growth, and after a time of crisis, Portugal is now seen as a country of opportunity and interest for foreign investors.
The unemployment rate dropped to 7.0% compared to 8.9% in 2017. This is also a good indicator for the average consumption of Portuguese in the retail market.
The food retail performance in Portugal in the year 2018 was very positive, with a growth of 5.0%. Given that 2017 was a good year (3.9% growth) and that in 2018 there was still growth in all retail sectors, it can be concluded that the economy in Portugal is growing and these benefits both retail companies and consumers themselves.
According to APED (Associação Portuguesa das Empresas de
Distribuição) this positive period manifested itself with the increasing
2.8% in sales volume to 12,403 million euros. In this segment, the top three of the categories that recorded the highest growth are Frozen (6.1%), Perishables / Fresh (4.1%) and Groceries (4.0%).
12
In the Cash and Carry operations, the turnover had also a positive trend (+3.8% growth). This growth is mainly explained by the tourism growth in Portugal, which has increased the consumption of the main clients in the cash and carry sector, i.e., hotels and small retailers.
According to Nielsen TSR in 2019 we can expect a continuous growth of the Portuguese Food Retail consumption and in the total of the Cash and Carry Sales.
3.2. JMT in Poland
JMT is present in Poland for more than 20 years and it is the leader in the food distribution.
It was in 1997 that JMT bought a company called Biedronka with 200 stores. At the end of 2018, the number of stores reached a total of 3,130 spread across the country with almost 2,000,000 Sqm.
JMT has two types of businesses in Poland, food distribution and specialized retail.
3.2.1. Biedronka
Biedronka, logo in Figure 11, is the leader chain in the food distribution
in Poland, with more than 2,900 stores. In 2018 alone, Biedronka opened 122 new stores.
It was estimated that in this year alone, the number of completed purchases (tickets) was of 1,3 billion and the total sales were of 11,691
million euros, Figure 12.
3.2.2. Hebe
Hebe is a retail chain of specialized health and beauty with more than 230 stores and 200 million euros total sales in 2018.
Hebe focus in selling products from renowned brands at competitive prices and promises a high-quality service. It also has its own brand which represents 20% of total sales.
Figure 11 - Biedronka Logo
Figure 12 - Biedronka Sales (in million euros)
13
3.2.3. Macroeconomic Situation
In 2018 the Ministry of Finance communicated that Poland had a record budget surplus. 2018 was a fantastic year for the economy in Poland. The GDP reached its best performance since 2007.
The household disposable income in Poland has been constantly growing in the last couple of years, which has been a very positive indicator for Jeronimo Martins’ bet on Poland’s food retail sector. The economy in Poland had a growth of 5.1% in 2018. The solid growth of the economy has also motivated higher salaries and lower unemployment rate that is now in a historical rate of 3.8%. Therefore, the average domestic consumption naturally had a huge increase. Accompanying this economic growth, Poland has significant investments in both the public and private sectors.
As Jerónimo Martins has operations in the Polish Health and Beauty market it is important to refer the growth of 6.7% of this market in 2018.
The Consumer Price Index was of 1.6% in 2018, slightly low when compared with the increase in the fuel prices and with the inflation of 2.6% in the food sector. Even with an increase in the prices of food it is interesting to observe a deflation of 29% in the sugar price.
The ‘Sunday Trading ban’ was a new Polish law implemented in 2018 and it was the considered the toughest challenge of the year. Since March 2018 the Biedronka and Hebe stores were forced to close on several Sundays, i.e., could only open on the first and last Sunday of the month. This adaptation to the new Polish routine was smooth and prepared, but the turnover of these Sundays was not fully recovered in the other days of the week. On the other hand, the food retail market had a 3.3% increase in 2018.
Some consumption habits took the group’s attention. The new era habits like the self-checkouts and the Scan & Go smartphone shopping had an increase and the company is investing in these technologies. In the year 2019, a robust economic growth in Poland is expected. The main challenges for Jerónimo Martins in the Polish market will be to hire staff, since the unemployment rate is at an historical low and to fight losses from the new Polish law, the Sunday trading ban.
14
Figure 15 - Ara Sales (in million euros)
Figure 16 - Ara Store Network
3.3. JMT in Colombia
Colombia was the latest country in which the company decided to bet. It has been growing since 2013 and as of 2018 it has 532 stores, mainly present in the capital Bogota, which represents 40% of Colombia’s national PIB and it reached a total of 600 million euros sales this year alone.
3.3.1. Ara
Ara, logo in Figure 14, food distribution stores are set up in residential
neighborhoods, present in three regions of Colombia: Bogota, the Caribbean Coast and the Coffee Growing region. It is estimated that the Ara stores, in 2018, were visited 10 million times per month in average.
The strategy involving the food distribution business in Colombia, despite being the same sector as Portugal and Poland, is completely different.
In its experience of expanding to other countries, Jerónimo Martins has learned not to take its strategy to the destination country and expect customers to adapt, but instead to adapt to the destination country and bet on a strategy that goes according to what customers are looking for and are familiarized.
In 2018 alone, Ara had a total sale of 599 million euros, opened 143
stores, Figure 16, in the three areas where it is operating and opened a
4th Distribution Centre in the Bogota city to reinforce the logistics
capacity of the region.
15
3.3.2. Macroeconomic Situation
The first thing observed in the Colombian economy was the GDP growth of +1.8% when compared to 2017. It is noticeable the recovery of the domestic demand with the increase of exports and private consumption.
This economic growth was mainly caused by the areas of trade, transportation and other related with services. In other direction the area of the mining industry and construction had a decrease.
Further growth is expected in 2019. Consumer confidence in the retail market has been increasing and hence spending on retail. The recover observed in 2018, leaves a good outlook for the next year.
Another good indicator was the Colombian inflation of +3.2% in 2018, standing in line with the Central Bank’s objective of a 3% increase. Against this indicator was the devaluation of -3.9% of the peso when compared with the euro, with an average exchange rate of 3,352.1 in 2017 to 3,489.6 in 2018.
In 2018 a new president was elected in Colombia. This new government promises a liberal view on private investment. Economic growth is expected to consolidate with lower taxes and controlled inflation. Therefore, an increase in purchasing power is expected. Last year alone, an increase of 2.8% in the retail market was observed. Nielsen Media Research estimates a growth of 4.6% for 2019. Discount format has been registering the highest growth from last years. Habits of Colombian consumers changed in a way that the consumers choose their products more informed and have a higher perception of the cost-benefit of their shopping.
16
4. Corporate Governance
4.1. Shareholder Structure
The share capital of the company Jerónimo Martins, SGPS, S.A. is 629,293,220 euros. This capital is divided into nominal shares of one euro each, meaning a total of 629,293,220 shares that are fully subscribed and paid up.
The only category of shares issued by Jerónimo Martins are ordinary shares and are traded on the Euronext Lisbon Stock Exchange.
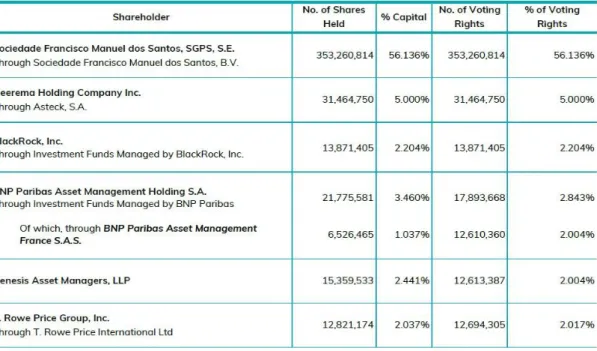
Below, in Figure 17, it is possible to observe the distribution of shares
and the percentage of voting rights of each party. Sociedade Francisco Manuel do Santos, SGPS, S.E. has the majority, i.e., over 50%, which gives them the absolute majority and control of the group.
The remaining 28.7% of the company's shares correspond to floating shares and own shares of the company.
In 1999 the company bought (at an average of 7.06 euros per share) 859 thousand shares to its own portfolio. These shares represent
17
Figure 18 - Board of Directors
0.14% of the company's share capital and the same percentage corresponds to voting rights.
There is no restriction on the tradability of the company's shares, i.e., Jerónimo Martins’ shares are freely traded.
4.2. Commitment to Stakeholders
Jerónimo Martins claims to have a serious commitment to its investors and in this context aims to be as accessible, transparent and correct in the information available as possible, that is, within its already legal obligations to the stakeholders and the whole market in general. The four pillars of commitment to its investors are first accessibility and transparency, second the equal treatment of all investors, third having the website always up to date and with all the information and lastly making sure that information is available on time.
4.3. The Board of Directors
Jerónimo Martins is a Group with a big dimension and with a lot of important decisions to be made. This significant size needs an executive structure that is adapted to this international experience and that is capable to be ready for vast challenges and fast growth and ambitious plans for short and long term.
The Board of Directors, Figure 18, is composed by a Chairman, an
Executive Chief and nine Directors. The CEO of Jerónimo Martins is supported by the Managing Committee that is led by this Board of Directors in order to facilitate day-to-day decision of the Company’s business management.
The Managing Committee also includes Functional Departments that supports the Board, the Managing Committee, the Audit Committee and other specialized Committees.
18
4.4. Model of Governance
The governance model, Figure 19, used by Jerónimo Martins is the most
appropriate for the interest of its stakeholders. Special attention was given by the Company’s Board to follow the best practices of the market.
A Managing Committee was set in 2010. The CEO in the course of his duties is always assisted by this committee.
19
4.5. Remuneration Policy
The remuneration of the most important positions of Jerónimo Martins are very well compensated so the company remuneration policy was highlighted.
The Committee of Remuneration had the responsibility to establish the restrictions on the remuneration of directors built on a variable and a fixed component. An effort was done to make it competitive to the market. The variable component also motivates these individuals to have a bigger effort to reach the best collective performance possible. The directors without executive power, have a remuneration that consists only in a fix part, this includes the remuneration of the Audit Committee.
It is proved by the company years of experience that an adequate remuneration of Shareholders helps the company to accelerate its growth and to set ambitious goals.
20
5. Highlights 2018
In the end of 2017 Jerónimo Martins set itself the clear priorities for the year to come, which were the continuation of outperforming the Polish and Portuguese market, the investment in the operational infrastructure and in the people, which was accomplished with success.
Before getting into numbers, it is important to clarify the use of like for like (LFL). The LFL is the comparison of the stores that operate in the same conditions in terms of number of sales in the year 2017 and 2018, the LFL figure is the comparison of one year to another, this comparison helps getting a realistic view of what happens with the already established stores, excluding expansions and acquisitions. In terms of numbers it is important to point out the total growth in
consolidated sales of 6.5%, Figure 20, with a group LFL of 3.1%. Looking
at this growth considering the different business of Jerónimo Martins, the growth of Biedronka, Pingo Doce, Recheio, Ara and Hebe were respectively of 5.8%, 4.65%, 4.0%, 53.9% and 23%.
The group consolidated sales increased and it also increased the EDITDA by 4.1% to €960 million and the Net Profit attributable to JMT also by 4.1% to €401million.
Funds from operations had a growth of 5.4% to €788 million. Net debt was €80 million at the end of 2018. The gearing that is the net debt divided by the shareholders funds stood at 3.9%.
In the last year the company has exceeded its own expectations of sales for the year.
+6.5% SALES To €13.3 billion +4.1% EBITDA To €960 million +4.1% NET PROFIT To 401 million +3.2% EPS To €0.65 Figure 20 - Highlights
21
6. DCF
6.1. Valuation - Discounted Cash Flow Method
The first and most used valuation method present in this project is the Discounted Cash Flow, also referred as DCF. This method permits to estimate the value of the company, based on the future cash flows that were forecasted as it will be explained further. Based on the future cash flows to the firm, also known as FCFF, it will be computed an estimation of the company equity value. This will permit to make an investment recommendation.
For this valuation, it was used the company’s Financial Statements presented in the Annual Reports, more specifically from 2014 to 2018, the last 5 years. The choice of being 5 years data was taken because it is a mature company with a stable position and growth in the market. The first step was to forecast the sales for the next 6 years. Since Jerónimo Martins has different operations as food retail, cash and carry retail and specialized retail and has operations in different locations, Portugal, Poland and Colombia, it was important to separate the sales of the company in different segments.
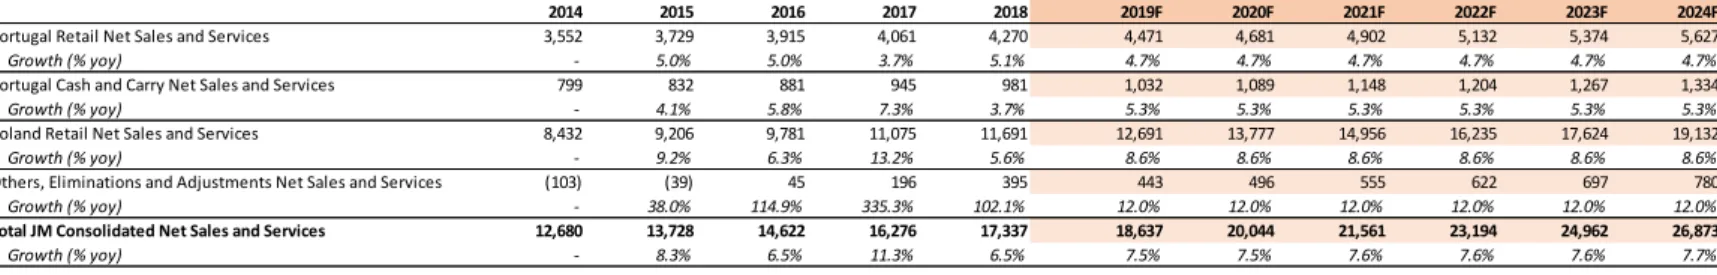
The public information ceded by JMT permitted to separate the sales,
Table I, in four segments: Portugal Retail Net Sales and Services (under Pingo Doce banner); Portugal Cash and Carry Net Sales and Services (under Recheio banner); Poland Retail Net Sales and Services (under Biedronka banner); Others, Eliminations and Adjustments Net Sales and Services, this last one includes what JMT calls business with reduced material (Retail business in Colombia under Ara banner, Health and Beauty in Poland under Hebe banner and Coffee Shops Chocolate stores and Agribusiness in Portugal).
2014 2015 2016 2017 2018 2019F 2020F 2021F 2022F 2023F 2024F
Portugal Retail Net Sales and Services 3,552 3,729 3,915 4,061 4,270 4,471 4,681 4,902 5,132 5,374 5,627
Growth (% yoy) - 5.0% 5.0% 3.7% 5.1% 4.7% 4.7% 4.7% 4.7% 4.7% 4.7%
Portugal Cash and Carry Net Sales and Services 799 832 881 945 981 1,032 1,089 1,148 1,204 1,267 1,334
Growth (% yoy) - 4.1% 5.8% 7.3% 3.7% 5.3% 5.3% 5.3% 5.3% 5.3% 5.3%
Poland Retail Net Sales and Services 8,432 9,206 9,781 11,075 11,691 12,691 13,777 14,956 16,235 17,624 19,132
Growth (% yoy) - 9.2% 6.3% 13.2% 5.6% 8.6% 8.6% 8.6% 8.6% 8.6% 8.6%
Others, Eliminations and Adjustments Net Sales and Services (103) (39) 45 196 395 443 496 555 622 697 780
Growth (% yoy) - 38.0% 114.9% 335.3% 102.1% 12.0% 12.0% 12.0% 12.0% 12.0% 12.0%
Total JM Consolidated Net Sales and Services 12,680 13,728 14,622 16,276 17,337 18,637 20,044 21,561 23,194 24,962 26,873
Growth (% yoy) - 8.3% 6.5% 11.3% 6.5% 7.5% 7.5% 7.6% 7.6% 7.6% 7.7%
22
By separating sales in these four operating segments it allows to make a more realistic forecast. These four segments have different behaviors, different growths and different margins so it is crucial to do this separation.
After collecting the net sales data, it was computed the year-over-year growth and the growth for the next years was forecasted with the average growth of this last 5 years. This approach was followed considering our analysis of the market and the countries in which the company operates.
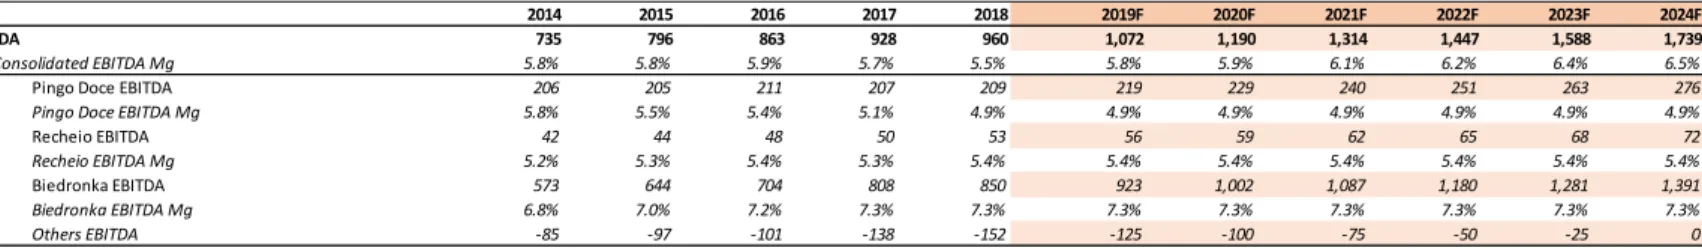
Since there is data available of the ‘Earnings Before Interest, Taxes, Depreciation, and Amortization’ (EBITDA) of these segments, it was assumed for the next years an EBITDA margin equal to the one in 2018 for the different segments. For the last segment where it is included the Colombia operations, it was assumed that in the next 5 years it
would be reached the breakeven point, Table II. Given the market
behavior and the positive results of these operations, this point might be reached sooner. In this more conservative valuation, it was considered that this positive result would be reached be later.
Only after the computation of the different EBITDA by segment it was all summed up to get the JMT Consolidated EBITDA. Since it was forecasted a higher growth for the Polish market which has the highest EBITDA margin of 7.3% and it has a greater weight in the company total sales, it stands out in the consolidated EBITDA, making a growth of the consolidated EBITDA margin for the next years from 5.8% to 6.5%.
2014 2015 2016 2017 2018 2019F 2020F 2021F 2022F 2023F 2024F EBITDA 735 796 863 928 960 1,072 1,190 1,314 1,447 1,588 1,739
JM Consolidated EBITDA Mg 5.8% 5.8% 5.9% 5.7% 5.5% 5.8% 5.9% 6.1% 6.2% 6.4% 6.5%
Pingo Doce EBITDA 206 205 211 207 209 219 229 240 251 263 276
Pingo Doce EBITDA Mg 5.8% 5.5% 5.4% 5.1% 4.9% 4.9% 4.9% 4.9% 4.9% 4.9% 4.9%
Recheio EBITDA 42 44 48 50 53 56 59 62 65 68 72
Recheio EBITDA Mg 5.2% 5.3% 5.4% 5.3% 5.4% 5.4% 5.4% 5.4% 5.4% 5.4% 5.4%
Biedronka EBITDA 573 644 704 808 850 923 1,002 1,087 1,180 1,281 1,391
Biedronka EBITDA Mg 6.8% 7.0% 7.2% 7.3% 7.3% 7.3% 7.3% 7.3% 7.3% 7.3% 7.3% Others EBITDA -85 -97 -101 -138 -152 -125 -100 -75 -50 -25 0
23
For the Capital Expenditures, Table III, it was used a 2.9% ratio in
relation with the already forecasted sales of the year, that is the same ratio, as in the years 2015 and 2016. This ratio was 2.9% and as explained in the previous analysis in the last two years 2017 and 2018, Jerónimo Martins had abnormal higher investments and it is expected to return to normal investments growth.
The first step to forecast the depreciations and amortizations, was to compute the ratio of depreciation in relation with the capex, year by year from 2014 to 2018. Then with this ratio it was computed a moving average with the last 5 years for the next years. Multiplying this ratio with the capital expenditures already forecasted, it is forecasted the deprecations for the next six years.
The Earnings before interest and taxes (EBIT) and Earnings before tax (EBT) forecasts are just successive sums of already computed rubrics, i.e., from EBITDA sum deprecation and got EBIT, then sum financial results and got EBT.
For the effective tax rate, it was assumed for the next five years a tax equal to the last five years. With the tax forecasted then it was summed to the EBT to get the value of net income forecast for the next six years.
The historical Working Capital of 2014 to 2018 was computed by summing ‘Inventories’ and ‘Trade debtors, accrued income and deferred costs’ and ‘Income Tax Receivables’ and subtracted ‘Trade
2014 2015 2016 2017 2018 2019F 2020F 2021F 2022F 2023F 2024F
Depreciations and Amortizations -277 -294 -294 -331 -364 -331 -360 -370 -384 -423 -464
% of Capex 57% 75% 69% 50% 52% 60.6% 61.3% 58.6% 56.5% 57.8% 59.0%
EBIT 459 502 568 597 596 741 830 945 1063 1165 1274
EBIT margin 3.6% 3.7% 3.9% 3.7% 3.4% 4.0% 4.1% 4.4% 4.6% 4.7% 4.7%
Financial Results and other profits -28 -30 -44 -26 -34 -35 -35 -35 -35 -35 -35
Growth (% yoy) - 9.6% 45.1% -40.3% 30.3% 2.9% 2.9% 2.9% 2.9% 2.9% 2.9%
EBT 431 471 524 571 562 706 795 909 1,028 1,130 1,239
EBT Margin 12.1% 12.6% 13.4% 14.1% 13.2% 15.8% 17.0% 18.6% 20.0% 21.0% 22.0%
Tax -104 -117 -130 -152 -132 -176 -199 -227 -257 -282 -310
Effective Tax Rate -24.1% -24.7% -24.8% -26.7% -23.5% -25.0% -25.0% -25.0% -25.0% -25.0% -25.0%
Net Income 327 355 394 418 430 530 596 682 771 848 930
Net Income Margin 2.6% 2.6% 2.7% 2.6% 2.5% 2.8% 3.0% 3.2% 3.3% 3.4% 3.5% Growth (% yoy) - 8.4% 11.2% 6.1% 2.8% 23.2% 12.5% 14.4% 13.0% 10.0% 9.7%
Capital Expenditures -483 -393 -428 -658 -700 -546 -587 -631 -679 -731 -787
as Percentage of Sales (% yoy) - 2.9% 2.9% 4.0% 4.0% 2.9% 2.9% 2.9% 2.9% 2.9% 2.9%
Working Capital -1,743 -1,982 -2,179 -2,486 -2,425 -2,697 -2,900 -3,120 -3,356 -3,612 -3,889
Days Working Capital -50.2 -52.7 -54.4 -55.7 -51.1 -52.82 -52.82 -52.82 -52.82 -52.82 -52.82
Changes in Working Capital - -239 -197 -307 61 -272 -204 -220 -236 -256 -277
24
creditors, accrued costs and deferred income’ and ‘Income Tax payable’.
With the value of Working Capital times 365 divided by the ‘Sales of the year’ we got the Days Working Capital (DWC). The average of DWC from the last years was then used to, multiplied by the forecasted sales getting a forecast of the Working Capital.
The Changes in Working Capital is just the difference year-by-year of the Working Capital value.
Afterwards it was possible to forecast the most important numbers to
this Discounted Cash Flow Valuation of the company, Table IV, the
Free Cash Flow to the Firm.
To discount the FCFF to its present value it was needed to compute the
Weighted Average Cost of Capital (WACC) of JMT, Table V. It is assumed
that the ratios presented in this Table V are constant for future years.
To get the WACC, Table V, it was a step by step process. First starting
with the Risk-Free Rate (Rf). Theoretically this is a rate of an investment with zero risk. To have a proxy of this value it was used the most approximated rate, as of 31 December 2018, we have in the European market, where Jerónimo Martins has most of its operations, the 10 years German Bond. These bonds were at a rate of 0.25%.
The Beta of the company was obtained from yahoo finance database. The Market Risk Premium (MRP) was a weighted mix of the three countries Market Risk Premium where the company operates. These values were collected from Damodaran country risk premium database.
With all the data needed, it was computed the Cost of Equity (Ke) which gave a rate of 8.69%.
2019F 2020F 2021F 2022F 2023F 2024F
EBIT 741 830 945 1063 1165 1274
Taxes on EBIT 25.0% -185 -207 -236 -265 -291 -318
Net Operating Profit Less Adjusted Taxes (NOPLAT) 556 622 709 797 874 956
Plus:
Depreciations and Amortizations 331 360 370 384 423 464
Less:
Capital Expenditure (CAPEX) -546 -587 -631 -679 -731 -787
Changes in Working Capital (ΔWC) -272 -204 -220 -236 -256 -277
Free Cash Flow to the Firm (FCFF) 69 192 227 266 310 357
Table IV - Free Cash Flow to the Firm (in million euros)
Risk Free (Rf) 0.25%
Beta Levered (B) 1.13
Portuguese MRP 9.02%
Polish MRP 7.14%
Colombian MRP 8.60%
Market Risk Premium (MRP) 7.72%
Cost of Equity (Ke) 8.69%
Cost of Debt (Kd) 3.17%
Market Value of Equity (E) 6,507
Market Value of Debt (D) 639
MV Equity + MV Debt (E+D) 7,146
Weight of Equity (We) 91.1%
Weight of Debt (Wd) 8.9%
Racio Debt/Equity (D/E) 0.10
Net Income (NI) 430
Taxes Expenses (tc) 132
% Taxes (%tc) 23.5%
Weighted Avarege
Cost of Capital (WACC) 8.13%
25
The Cost of Debt (Kd) was directly collected from the 2018 Annual Report, where the company stated the average rate at which it obtained its loans which was at 3.17%
The effective tax rate (%Tc) that the company paid in 2018 was easily computed by dividing the company taxes expenses by the consolidated net income of the year.
With all these rates, Ke, Kd and %Tc, along with the weight of equity (We) and weight of Debt (Wd) computed with the Market Value of Equity and Debt, it was reached the WACC by multiplication of this proportional weights with the cost of each capital component.
The Terminal Value, Table VI, was computed by multiplying the
forecasted EBITDA for 2024 with the multiple EV/EBITDA of 6.96x. With all the free cash flow to the firm discounted, it was computed the Enterprise Value. Adding Cash, subtracting Debt it was computed the final Equity Valuation of the Jerónimo Martins group.
The company total Equity Value is 8,296.03 million euros, divided by the 629,293,220 total number of shares, the Discounted Cash Flow Valuation per Shares is 13.18€. As of 31 December 2018, the company
in the market was at a price of 10.34€ per share. It wasidentified an
opportunity of investment, a BUY recommendation is given, since it is concluded that the company is undervalued in the market.
1 2 3 4 5 6
2019F 2020F 2021F 2022F 2023F 2024F
Free Cash Flow to the Firm 69 192 227 266 310 357
Weighted Average Cost of Capital WACC 8.13%
Discount factor 1 0.9248 0.8553 0.7911 0.7316 0.6766 0.6258
PV of FCFF 64.3 164.1 179.9 194.4 209.6
EBITDA 2024 1,739
EV/EBITDA 6.96x
Terminal Value 12,108.23
Sum of Discounted Cash Flows 812.3
Discounted Terminal Value 7,576.96
Enterprise Value 8,389.25
Plus Cash 545.988
Less Debt 639.204
Equity Value 8,296.03
Total Number of Shares 629,293,220
Equity Value/Share 13.18
26
7. DDM
7.1. Dividends
7.1.1. Dividend Discount Model
Our second method to valuate the company was the Dividend Discount Model, also known as DDM. This quantitative method was used to value the company, based on its future dividends and supported by the theory that the sum of the present value of this future dividend is the value of the company.
To forecast the future dividends, it was taken in consideration three main sources of information. The past dividends payed per share of Jerónimo Martins from 2014 to 2018, the already computed forecast of the consolidated net earnings for the next years to come and the Dividend distribution policy of the company.
This valuation method is recommended to be used for companies with a very stable historical distribution of dividends. It is a fact that this is not a company with a very stable past dividends payment but, somehow in a good way since the dividends have been increasing a lot because they follow the positive results of the company. That is why it was followed a more conservative approach to this method.
For this method, it’s very important to point one of the rules in the Dividend Distribution Policy of the future dividends that states that the value of future distributed dividends must be between 40% and 50% of consolidated net earnings. And, by the dividends policy, if the application of this rule, in an abnormal situation results in a decrease of the dividends, the Board of Directors might propose to maintain last year’s dividends, even if this incurs in the use of free existing reserves, obviously not endangering the company situation or not jeopardizing the balance sheet management of the principles adopted.
The dividend growth was estimated based on the already forecasted
growth of net earnings, Table IX, considering that the aforementioned
dividend distribution policy of the company has as a rule that dividends are a percentage of those net earnings.
27
The last variable needed is the Growth Rate in Perpetuity (g) that is needed to compute the Terminal Value (TV). After collecting the growth rate in perpetuity of each country where the company operates from the 2018 Annual Report, it was calculated the g for the whole
company giving the g a weight of each country by its sales, Table VIII.
In the Discounted Cash Flow valuation method, Table IX, it was
forecasted the growth of the net income year by year. This same growth rate is expected in the Dividend Payments since, by the company Dividends Policy, theoretically dividends will grow at the same pace of the net income regardless of the percentage of net income to dividends defined in the company’s policy.
After having the future dividends estimated, that were divided in two
phases of growth, Table IX, the Dividend Growth Period and the
Dividend Stablishing Period, they were then discounted to their present value. This discount was done with the cost of equity capital (Ke) computed when applying the Discounted Cash Flow method. It is discounted at this rate because this is the cost that represents the
2014 2015 2016 2017 2018
Dividend Payments (Euros) 0.305 0.62 0.265 0.605 0.613
Table VII - Dividend History (in euros per share)
Growth Rate in Perpetuity for Portugal 1.0%
Growth Rate in Perpetuity for Poland 1.5%
Growth Rate in Perpetuity for Colombia 1.5%
Growth Rate in Perpetuity (g) 1.4%
Table VIII - Growth Rate in Perpetuity
Table IX - Valuation - DDM
Dividend Growth Period Dividend Stabilising Period Perpetuity
1 2 3 4 5 6 7 8 9 10 11
2019F 2020F 2021F 2022F 2023F 2024F 2025F 2026F 2027F 2028F 2029F
Dividend Payment Growth 10.0% 10.0% 10.0% 10.0% 10.0% 8.0% 6.0% 4.0% 2.0% 2.0% 1.4% Dividend Payments (Euros) 0.6743 0.7417 0.8159 0.8975 0.9872 1.0662 1.1302 1.1754 1.1989 1.2229 1.2395
Terminal Value of Dividends 16.9201
Growth rate of dividends 10.0% Growth Rate in Perpetuity (g) 1.4% Cost of Equity (ke) 8.69%
Discount factor 1 0.9201 0.8465 0.7789 0.7166 0.6594 0.6067 0.5582 0.5136 0.4725 0.4348 0.4000
Present Value of Dividends 0.6204 0.6279 0.6355 0.6432 0.6510 0.6468 0.6309 0.6037 0.5665 0.5317 0.4958 Present Value of Terminal Value 6.7684 Estimated Price per Share 13.4217
# of Shares 629,293,220
28
compensation demanded by the investors that own Jerónimo Martins shares and bear the risk of its ownership.
The present value of the future dividends is higher than the present value of the shares, this means that the shares of Jerónimo Martins are undervalued, and therefore the same conclusion is drawn from the financial assessment previously calculated, that is, a BUY recommendation.
By the Dividend Discount Model, the total value of the company is 8,446 million euros, again a higher value then as of December 2018 value of JMT in the market stock exchange.
29
8. COMPARABLES
8.1. Market Based Valuation
The last method used to value the company was the market-based valuation, also known as market approach. It is important to use this method to compare Jerónimo Martins with similar companies in the market. This comparison will enable us to take conclusion whether the company is in good shape when compared to other that compete with Jerónimo Martins or are simply in the same business as JMT.
To choose the companies that were compared with Jerónimo Martins, firstly a selection of several criteria was made and then, the companies in the market that better matched within that criteria, were the chosen.
The first and mandatory criteria was for the peers to be quoted in a stock exchange market. The second and considered the most important criteria of this selection, was that the companies must operate in the same type of Industry, i.e., Food Retailers & Wholesales. This is important because looking at companies in the same industry we guarantee that they operate in similar ways and with relatively similar assets, which will get a more realistic valuation in the market. The third and fourth criteria were not exclusive, being the location where the companies operated and their size (market capitalization, sales and number of employees).
The five selected companies were Ahold Delhaize (AMS), Tesco (LSE),
Eurocash (GPW), X5 Retail GDR (LSE) and Metro St. (XETRA). It is
important to note that these five selected companies are also on the list of nine peers selected by Jerónimo Martins on their website.
8.2. Comparables Brief Description
Present in United States, Europe and Indonesia, Ahold Delhaize (AMS),
logo in Figure 21, is one of the largest food retail groups in the world.
This company serves more than 50 million clients per week in the locations where it is present, operating supermarkets and e-commerce businesses. It is present in 11 countries, with more than 6,500 stores and 375 thousand employees and an experience in the market of over 150 years. Ahold Delhaize has 49% of Pingo Doce ownership in a joint
30
venture with Jerónimo Martins. Ahold Delhaize headquarters is in Zaandam, Netherlands.
Funded 100 years ago in United Kingdom, Tesco (LSE), logo in Figure 22,
it is now present in 11 countries. It is a big player in the countries where it operates, being a competitor of Jerónimo Martins in Poland. A constituent of the FTSE 100 Index, Tesco is listed in the London Stock Exchange. It has over 6800 stores and 450 thousand employees.
In the Polish Food Retail market, Eurocash (GPW), logo in Figure 23, is
one of Jerónimo Martins biggest competitor and that was one reason for being selected in this valuation approach. Eurocash has a big investment in local stores, helping these small retailers with innovation and marketing. Eurocash was bought by a former General Director of Jerónimo Martins in 1999. The company is placed in the Warsaw Stock Exchange since 2005. It is the leader in the small neighborhood food retail in Poland with over 6100 stores.
The company in the market with the most similar market capitalization,
X5 Retail GDR (LSE), logo in Figure 25, has a market cap. of 6,730 million euros very approximate with the 6,507 million euros of Jerónimo Martins. X5 Retail Group also shortly known as X5, is a company that has almost all its operations in the Russian market, with the headquarters of the company located in Moscow. X5 was founded in 2006 and as of the end of 2018 it had earnings of 387 million euros and 250,874 employees.
The last company selected, Metro St. (XETRA), logo in Figure 24, it is
also of a similar size of Jerónimo Martins, with a market capitalization of 5,307 million euros. Metro is a group from Germany and its shares are traded on the Frankfurt Stock Exchange. Metro activities are strictly related to food retail. Although its earnings are mostly from Germany, Metro serves customers around the world.
Figure 22 - TESCO Logo
Figure 23 - Eurocash Grupa Logo
Figure 25 - X5 Retail Group Logo
31
8.3. Valuation – Market Based
After the selection of the companies in the market to compare with Jerónimo Martins the next step was to collect these companies’ financial statements as of the end of 2018.
For these comparison it were chosen two type of ratios to use as a multiples, the Price Earnings Ratio (P/E) that is equal to the current price of the stock divided by Earnings per Shares, or although being the same, the way it was done, Market Capitalization divided by Total Net Earnings of the year. The other ratio was computed with the Enterprise Value over Earnings Before Interest Taxes Depreciation & Amortization
(EV/EBITDA).
The first step was to compute these multiples for Jerónimo Martins, and it was achieved an EV/EBITDA ratio of 6.96x and a P/E ratio of
16.23x, Table X - Comparables MultiplesTable X.
The average of these multiples obtained from the computation explained above with the financial information of the selected
companies was of an EV/EBITDA of 7.10x and a P/E of 16.73x, Table X.
Without going further, it is already possible to state that by comparison the company has a comfortable position in the market, i.e., in an analysis of the company's numbers it is possible to observe that the investment in JMT shares in theory will be more profitable than the market average.
Company Name Price per Share (€) Market Cap (P) Enterprize Value (EV) EBITDA Earnings EV/EBITDA P/E
Jerónimo Martins 10.34 6,507 6,686 960 401 6.96 16.23 Ahold Delhaize 22.08 26,054 29,159 4,305 1,793 6.77 14.53 Eurocash 4.09 569 649 97 26 6.67 22.25 Tesco 2.12 20,755 19,353 2,456 1,340 7.88 15.49 Metro 13.40 4,826 5,307 625 344 8.49 14.03 X5 Retail 24.78 6,730 8,436 1,485 387 5.68 17.38 AVERAGE 7.10 16.73
Market Data Financial Data Multiples
32
The P/E ratio is very important to investor since it is used to know how profitable the company is, and it helps knowing how profitable it will be in the future. P/E can be seen as the value that an investor has to pay per unit of current earnings, which in JMT case is 16.23x, an amount lower than the 16.73x calculated as the average of the market
that it is needed for the other companies, Table XI.
The EV/EBITDA ratio compares the company EV with its EBITDA. It is one of the most used ratios to compare the relative value of companies. In an overall look this ratio gives the investor the information of how many times EBITDA it as to pay to acquire the entire company, in the case of JMT it is 16.23x, lower than the average of the market of 16.73x which is a favorable indicator.
Although this method gave the company a lower valuation in relation with the previous methods used, it will not be given less validity to the recommendation in this report since this method still confirms that JMT shares are undervalued and therefore an investment theoretically with higher returns than the market.
Average EV/EBITDA 7.10x
EBITDA JM 960
Implied EV of JM 6,814.16
Plus Cash 546
Less Debt 639
Implied Equity Value of JM 6,721
# of JM Shares 629,293,220
Implied Price per share of JM 10.68
Average P/E 16.73x
Earnings JM 401
Implied Valuation of JM 6,710.59
# of JM Shares 629,293,220
Implied Price per share of JM 10.66
33
9. Conclusion
At the beginning of this Master Final Project, an equity valuation of Jerónimo Martins as of December 31, 2018 and an investment recommendation were identified as the main objective. After a full analysis of the Jerónimo Martins situation, analysis of the countries in which the company operates (Portugal, Poland and Colombia) and its different stores and type of business as well as the market as a whole it was possible to do a more realistic forecast of the most important indicators of JMT. It was also determined to study the company historical data and of the most similar companies to Jerónimo Martins.
A clear position has been taken, buy recommendation. All this considering the stock value of the company at December 31, 2018.
The company with a market value of 6,506.9 million euros as of December 31, 2018 with 629,293,220 total number of shares outstanding pointing to a value per share of 10.34 euros. The three equity valuation methods applied to the company led to the same deduction that the
company stock is worth more than it is priced in the market, Table XII. Therefore, it is easily
concluded that the stock is undervalued in the market.
In the first two methods used, it was obtained an expected return of 27.5% (DCF) and 29.5% (DDM). In the last method it is confirmed from the multiples comparison that the company is expected to stand out from its competitors and to have a superior return over its peers.
Applying the Discounted Cash Flow (DCF) valuation method, a company equity value of 8,296.0 million euros was obtained, i.e., a value per share of 13.18 euros.
The Dividend Discount Model (DDM) valuation, resulted in a company equity value of 8,446.2 million euros, i.e., a value per share of 13.43 euros.
Company Equity Value Share Price
(in million euros) (in euros)
Discounted Cash Flow (DCF) 8,296.0 13.18
Dividend Discount Model (DDM) 8,446.2 13.42
Market Based (EV/EBITDA; P/E) 6,710 / 6,721 10.66 / 10.68
Price Value at 31Dec2018 6,506.9 10.34
Valuation Method
34
Comparing Jerónimo Martins with its peers, it was reached in the Market Based valuation, a company equity value of 6.721 with the average EV/EBITDA ratio of the market and obtain a value of 6.710 with the average P/E ratio of the market, i.e., a correspondingly to a value per share of 10.68 and 10.66 euros.
The solid structure of physical and human assets and the high level of experience in the food retailers and wholesaler’s industry increases confidence in our conclusions. Jerónimo Martins shows clear signs of growth in all segments in which it operates and no signs to a contrary path. This growth is expected to continue over the medium term. Over the long term although a still positive route is expected it will certainly have a more stable growth.
Disclosure and Disclaimer
This report is published for educational purposes by Master students and does not constitute an offer or a solicitation of an offer to buy or sell any security, nor is it an investment recommendation as defined by Article 12º A of the Código do Mercado de Valores Mobiliários (Portuguese Securities Market Code). The students are not registered with Comissão de Mercado
de Valores Mobiliários (CMVM) as financial analysts, financial intermediaries or entities/persons
offering any service of financial intermediation, to which Regulamento (Regulation) 3º/2010 of CMVM would be applicable.
Recommendation System
Buy Expected total return (including dividends) of more than 15% over a 12-month period. Hold Expected total return (including dividends) between 0% and 15% over a 12-month period.
Sell Expected negative total return (including dividends) over a 12-month period.
35
10. Appendices
Labels: Blue numbers sourced from Company Annual Reports10.1. Financial Statements
(Thous a nd Euros ) 2014 2015 2016 2017 2018 Assets Tangible assets 2,773,324 2,890,113 3,023,360 3,474,835 3,687,053 Intangible assets 806,194 809,796 786,983 811,040 792,514 Investment property 42,947 20,387 13,952 13,714 11,676 Biological assets - - - - 3,398Investments in joint ventures and associates 74,272 76,478 - 1,557 3,245
Other financial investments 1,252 1,758 1,000 1,417 1,321
Trade debtors, accrued income and deferred costs 102,112 118,604 112,836 111,383 84,713
Derivative financial instruments - 122 - 227
-Deferred tax assets 51,349 56,245 69,756 106,025 114,840
Total non-current assets 3,851,450 3,973,503 4,007,887 4,520,198 4,698,760
Inventories 572,004 638,339 718,618 841,565 970,653
Biological assets - 409 1,181 5,498 3,790
Income tax receivable 2,217 1,373 2,037 5,094 5,035
Trade debtors, accrued income and deferred costs 313,463 277,275 311,130 387,833 435,642
Derivative financial instruments 2,627 128 1,277 294 59
Cash and cash equivalents 430,660 441,688 643,512 681,333 545,988
Total current assets 1,320,971 1,359,212 1,677,755 1,921,617 1,961,167
Total assets 5,172,421 5,332,715 5,685,642 6,441,815 6,659,927
Shareholders’ equity and liabilities
Share capital 629,293 629,293 629,293 629,293 629,293 Share premium 22,452 22,452 22,452 22,452 22,452 Own shares (6,060) (6,060) (6,060) (6,060) (6,060) Other reserves (67,267) (64,392) (96,865) (51,109) (77,046) Retained earnings 817,398 760,400 1,189,191 1,193,319 1,209,259 1,395,816 1,341,693 1,738,011 1,787,895 1,777,898 Non-controlling interests 242,875 251,526 252,500 225,298 238,356
Total Shareholders’ equity 1,638,691 1,593,219 1,990,511 2,013,193 2,016,254
Borrowings 373,877 534,422 114,829 237,762 288,390
as % of Discriminated Total Borrowings 52.3% 81.2% 33.8% 44.3% 45.1%
Trade creditors, accrued costs and deferred income 836 813 793 779 774
Derivative financial instruments 2,681 - 293 - 62
Employee benefits 42,460 42,908 61,823 66,482 65,069
Provisions for risks and contingencies 81,828 83,947 21,582 29,308 26,565
Deferred tax liabilities 58,890 54,527 59,742 71,579 75,627
Total non-current liabilities 560,572 716,617 259,062 405,910 456,487
Borrowings 340,925 123,510 224,581 299,505 350,814
as % of Discriminated Total Borrowings 47.7% 18.8% 66.2% 55.7% 54.9%
Trade creditors, accrued costs and deferred income 2,616,004 2,871,717 3,166,527 3,662,293 3,794,411
Derivative financial instruments 1,715 93 317 2,805 159
Income tax payable 14,514 27,559 44,644 58,109 41,802
Discriminated Total Borrowings 714,802 657,932 339,410 537,267 639,204
Average Maturity (years) 1.5 1.9 1.6 1.4 1.5
% Debt in Euros 31.6% 47.4% 44.2% 24.3% 7.8%
% Debt in Zlotys 57.3% 40.4% 27.8% 44.8% 47.4%
% Debt in Colombian Pesos 11.1% 12.2% 27.9% 30.9% 44.8%
Total current liabilities 2,973,158 3,022,879 3,436,069 4,022,712 4,187,186
Total Shareholders’ equity and liabilities 5,172,421 5,332,715 5,685,642 6,441,815 6,659,927