THIS REPORT WAS PREPARED BY JOÃO ALEXANDRINO, A MASTERS IN FINANCE STUDENT OF THE NOVA SCHOOL OF BUSINESS AND ECONOMICS, EXCLUSIVELY FOR ACADEMIC PURPOSES.THIS REPORT WAS SUPERVISED BY ROSÁRIO ANDRÉ WHO REVIEWED THE
M
ASTERS IN
F
INANCE
EQUITY RESEARCH
We recommend holding Tesco since our February 2015 price target of 363.68 pence per share corresponds to a potential growth of 10.04% compared to the current market price.
Despite the improvement of macroeconomic conditions in the UK (1.5% GDP growth in 2013), Tesco will face more difficulties in its “home” country due to the increase in competition
from both discount stores and upmarket retailers. Moreover, its international businesses are not facing better conditions. In fact, businesses in Japan, US and China have been discontinued, and we strongly believe that Turkey may be the next.
However, Tesco still is the largest retail player in UK and the 3rd most valuable food retail brand worldwide. According to our projections, we believe that the restructuration of current businesses will be successful and that Tesco will keep delivering value to its shareholders.
We think that Investment Property assets may constitute a potential risk for shareholders, since they represent £4.1bn of the Enterprise Value (9%), and there is a lack of information about them and their location. However, according to our sensibility analysis, the HOLD recommendation will not be affected by a change of their value.
Company description
Tesco plc is a British food retailer. It is the largest market player in the UK and one of the largest worldwide in its industry. It has operations in the UK, Thailand, Malaysia, South Korea, Czech Republic, Hungary, Poland, Slovakia, Turkey and Republic of Ireland. Besides retailing the company has also other activities, as Real Estate and a Financial Subsidiary.
TESCO
PLC
C
OMPANY
R
EPORT
FOOD
RETAIL
06 JANEIRO 2014
S
TUDENT
:
J
OÃO
A
LEXANDRINO
[email protected]
It’s time to focus
on restructuring
…
…
because expansion went wrong!
Recommendation: HOLD
Price Target Feb-15: 363.68 p
Price (as of 6-Jan-14) 330.50 p
Reuters: TSCO.L, Bloomberg: TSCO:LN
52-week range (pence) 316.60-388.05 Market Cap (£bn) 26.72 Outstanding Shares (mn) 8,074
Source: Bloomberg, Company Information
Source: Bloomberg
(Values in £ millions) 2013 2014E 2015E Revenues 63,329 63,275 64,165 EBITDAR 6,760 5,643 5,709 EBITDA 5,487 4,370 4,436 EBIT 2,970 2,831 2,807 NI 120 2,367 2,432
EPS (pence) 1.47 29.32 30.12 EV/EBITDA 8.13 10.02 10.05 ROIC 5.6% 6.0% 6.0% Source: Analyst Estimates, Company Information
-25% -20% -15% -10% -5% 0% 5% 10% 15%
TESCO PLC COMPANY REPORT
Table of Contents
Company overview ... 2
Company description ... 3
Geographical distribution ... 3
Strategy ... 4
Shareholder structure ... 4
Valuation ... 6
Key value drivers ... 8
Cost of capital ... 8
Capital structure ... 9
Comparables ... 9
Retail in the UK ...12
Macroeconomic analysis ... 12
Food retail market & Tesco ... 12
Retail in Asia ...16
Macroeconomic analysis ... 16
Food retail market & Tesco ... 17
Retail in the Rest of Europe (RoE) ...19
Macroeconomic analysis ... 19
Food retail market & Tesco ... 20
Non-operating activities ...25
Investment Property ... 25
Tesco Bank ... 26
Scenario ...28
Appendices ...29
TESCO PLC COMPANY REPORT
55% 13%
18% 15%
Graph 1 - Enterprise Value per Business Segment
UK
ASIA
RoE
NonOperating Assets
64% 15%
21%
Graph 2 - Value of Operations per Region
UK
ASIA
RoE
Company overview
Company description
Tesco plc is a British food retailer. The company has a very international outlook, keeping its presence across Europe and Asia, and is considered one of the
world’s largest retailers. According to “BRANDZ Top 100 Most Valuable Global Brands 2013”1, Tesco is the 55th most valuable company globally, being the 5th across the retail industry. In fact, ahead of Tesco, there are only Amazon, Walmart, The Home Depot, and Ebay. Among these, only Walmart and The Home Depot are food retailers as Tesco.
Despite its international presence, the UK business still represents Tesco’s main source of value creation, being responsible for 55% of the Enterprise Value, 68% of the retail revenues and 76% of the retail EBIT.2 Acording to Kantar
Worldpanel, Tesco’s market share in the 12 weeks ending 8th December 2013 dropped from 30.6% to 29.9%, comparing to the same period of the previous year. However, Tesco kept its position as food retail market leader in the UK, maintaining a big difference to the 2nd largest player, Asda, which accounted for 16.9% of market share.
Besides retailing, the company also creates value through other businesses, which we will treat as non-operating. From these, the financial subsidiary (‘Tesco Bank’) and the real estate business unit (‘Investment Property’) are considered to be the most important.
Geographical distribution
The retail business is divided in three main segments: UK, Asia and Rest of Europe (RoE). Operations in the UK, as it has already been stated, represent the principal source of value for the company. The Asia segment accounts for operations in Malaysia, South Korea, and Thailand. We will not include operations in India, as it constitutes a joint-venture between Tesco and Tata, the Indian industrial group. The RoE segment includes Czech Republic, Hungary, Poland, Slovakia, Turkey and Republic of Ireland (RoI). Operations in China were ceased last October, so they will be treated as discontinued during the first year of projections. The same happens to operations in the US, which were sold in last September.
Regarding non-operating activities, Tesco Bank is targeted to customers in the UK and Ireland. Although Investment Property locations are not disclosed, we
1 Published by Milward Brown 2 Analyst Estimates
Source: Analyst Estimates
TESCO PLC COMPANY REPORT
believed that they are located in Asia and RoE (i.e. there are no Investment Property assets in the UK).
Strategy
On March 2011, Sir Terry Leahy stepped down as CEO of Tesco. After 14 years in this position, he was responsible for most of the internationalization process of the company. Philip Clarke became the new CEO, and changed the view of the company regarding internationalization. Due to this renewed vision, the
sustainability of some Tesco’s units around the world was rethought, and therefore operations were ceased in Japan, US and China.
Tesco entered the Japanese market in 2003 by acquiring C2 Network for £139mn net of cash. After ongoing trading losses of about £30mn, it left the
market in 2012 by selling a 50% stake to Aeon, the Japan’s 2nd largest retailer. However, Tesco needed to invest £40mn in the new venture.3
In September 2013 the company settled the exit from US. Tesco had built from
scratch in 2007 a chain of convenience stores called “Fresh and Easy”. After
£1bn of investments and £1bn of accumulated losses, the business was sold to Yucaipa. This deal had a cost of £150mn for Tesco.4
In October 2013, Tesco confirmed that they settled a deal with China Resources Enterprise (CRE), a Chinese state-company, to create a joint-venture, that would
manage Tesco’s operations in China after that. As a consequence, Tesco would only remain with a 20% stake in this JV and would no longer control the business it started 9 years before. Moreover, Tesco needed to invest £185mn in the JV and will need to pay £160mn to CRE in the future.5
Tesco will now focus in investing in the United Kingdom, its most important business unit. Here, despite being the market leader, the company has faced some difficulties.
We also believe that Turkey might be the next place to cease operations. Despite the lack of information disclosed, the company gave signs that it had been difficult to be successful in the country. By following the strategy described above, we believe there is a chance of Tesco leaving the country.
Shareholder structure
The company is currently owned by some institutional shareholders: Berkshire Hathaway Inc. (5.08% stake); Norges Bank (5.00%); Blackrock, Inc. (4.96%); and
3 Company information 4 Company information 5 Company information
TESCO PLC COMPANY REPORT
5,08%
5,00%
4,96%
3,99%
80,97%
Graph 3 - Shareholder Structure
Berkshire Hathaway Inc.
Norges Bank
Blackrock, Inc.
Legal & General Investment Management Limited
Free Floating
Legal & General Investment Management Limited (3.99%). The remaining 80.97% of capital is free float. There is no evidence that any of these will change their position in the future.
TESCO PLC COMPANY REPORT
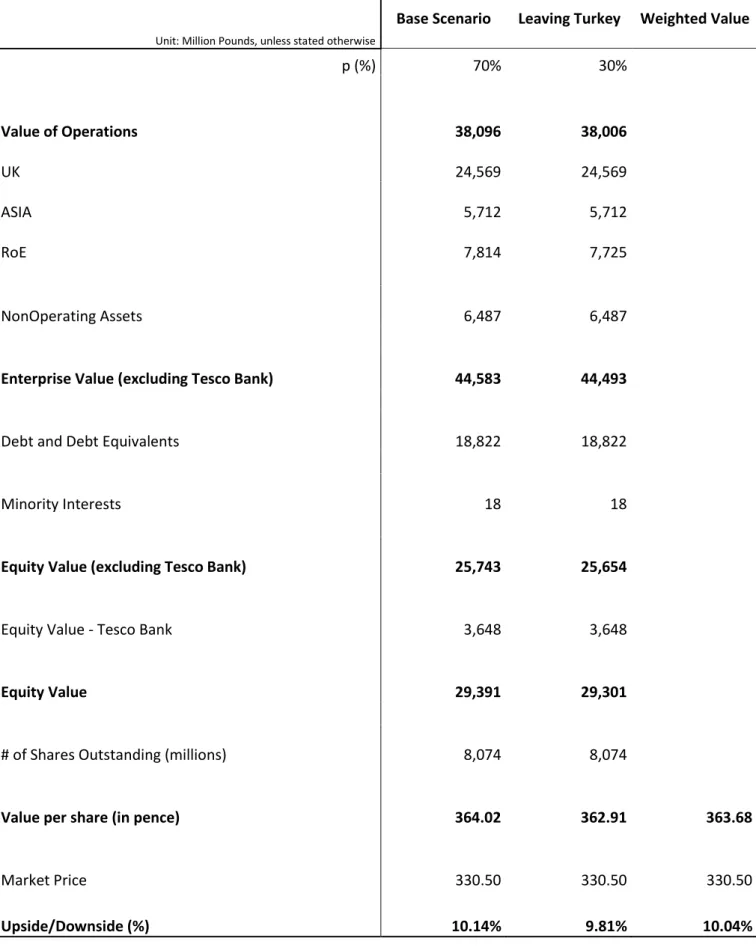
Valuation Methodology
Since Tesco has a financial subsidiary, we performed the valuation of the company in a three step process. Firstly, we calculated the Enterprise Value excluding Tesco Bank. Then, we subtracted debt and equivalents and minority interests to the EV and we got the Equity Value excluding Tesco Bank. And finally we valued the equity of Tesco Bank (through a P/E multiple6) and added back to the previous calculation to reach the Equity Value of the company, which was divided by the number of shares to reach the price per share. In order to get the enterprise value for Tesco, we performed a sum of the parts (SOTP) methodology, using different techniques along the different items. For the three segments of the retail unit, we used Discounted Cash Flow (DCF) models. For Investment Property unit, since there is not much information available regarding the locations of the properties, we assumed the fair value disclosed by the company. For Investments in JV & Associates and Other Non-Operating Assets (Derivative Financial Instruments) we assumed the book value.
For Post-Employment Benefit Obligations and Other Non-Operating Liabilities (Derivative Financial Instruments and Provisions) we assumed the book value. We assumed a 70% probability that our base scenario will occur and a 30% probability that Tesco will leave Turkey with £165mn loss.
6 It was used an equity multiple because Tesco Bank is not as significant as the retail business.
SOTP Methodology
TESCO PLC COMPANY REPORT
Unit: Million Pounds, unless stated otherwise
Base Scenario
Leaving Turkey
Weighted Value
p (%)
70%
30%
Value of Operations
38,096
38,006
UK
24,569
24,569
ASIA
5,712
5,712
RoE
7,814
7,725
NonOperating Assets
6,487
6,487
Enterprise Value (excluding Tesco Bank)
44,583
44,493
Debt and Debt Equivalents
18,822
18,822
Minority Interests
18
18
Equity Value (excluding Tesco Bank)
25,743
25,654
Equity Value - Tesco Bank
3,648
3,648
Equity Value
29,391
29,301
# of Shares Outstanding (millions)
8,074
8,074
Value per share (in pence)
364.02
362.91
363.68
Market Price
330.50
330.50
330.50
Upside/Downside (%)
10.14%
9.81%
10.04%
Table 1- SOTP Valuation
TESCO PLC COMPANY REPORT
EV/EBITDA
Value of Operations
8.6
UK
9.3
ASIA
5.9
RoE
9.3
Key value drivers
In order to project our future Cash Flows (CFs) for Tesco retail operations across its business units, we focused on three different value drivers: Like-for-like (LFL) sales growth, EBITDA margin, and the Number of New Stores. Regarding the
new stores, it was also important to set the Space (‘000 sq ft) per New Store, and the Sales per ‘000 sq ft. We assumed that the cost per new store will increase at the pace of the country inflation.
It is important to mention that we assumed different EBITDA margins for each business segment, different LFL sales growth rates for each country, and the number of new stores are projected for each type of store for all countries.
Cost of capital and Capital Structure
Cost of Capital
Regarding the calculation of the cost of capital that we used to discount the CFs, we assumed the same cost of equity for all the segments. Being Tesco a diversified company, we assume that the value of equity will be the same in the UK, in Asia or in the RoE. Therefore, we used the UK Government 10 years Bond to determine the risk-free rate, we used comparables to determine the unlevered industry beta, which we levered using Tesco’s capital structure, and we assumed a market risk premium of 5.5%. Then, since Tesco’s debt is all
issued in the UK, we also assumed the same cost of debt for all segments. To calculate this, firstly we calculated the yield to maturity of Tesco by summing a CDS of a Tesco 10y bond to the risk-free rate. Then, assuming a 3.3% Probability of Default and an 78.6% Recovery Rate, we reached the cost of debt.7
As we can see in the table, the WACC differentiates across the business segments, as the corporate tax rates also differ.
7Moody’s Investors Service, “Corporate Default and Recovery Rates, 1920-2010”. The Probability of Default and the Recovery Rate
were chosen according to the type of the industry and the type of debt issued.
Table 2 – EV/EBITDA multiples implied in Base Scenario
TESCO PLC COMPANY REPORT
UK
Asia
RoE
Statuatory Tax Rate
23.00% 22.57% 18.42%
Target D/E
65.1%
Risk-Free Rate
2.77%
Industry Unlevered Beta
47.17%
Relevered Beta
77.88%
Market Risk Premium
5.50%
Cost of Equity
7.05%
Risk-Free Rate
2.77%
Default Spread
1.31%
Probability of Default
3.30%
Recovery Rate
78.60%
Cost of Debt
3.34%
WACC
5.29% 5.29% 5.35%
Capital Structure
In what concerns the capital structure for Tesco, we assumed the same D/E ratio it had before, as in our projection, there will not be a significant increase in the amount of debt of the company. Moreover, if we take a look at comparables information, we can notice that Tesco has an acceptable D/E ratio.8 In addition, according to the last annual report, the company has borrowing facilities of £2.9bn, which indicates Tesco will not need to issue bonds in the future.
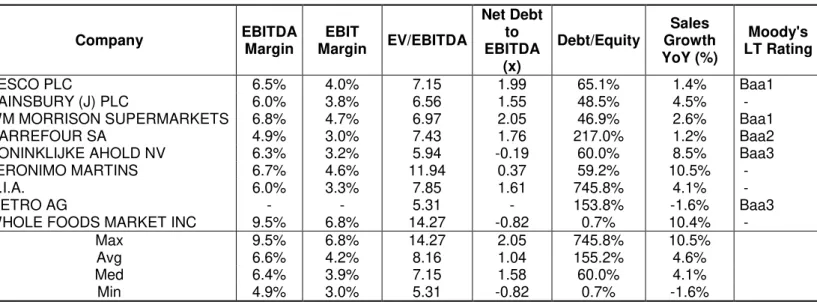
Comparables
We created a peer group not only to compare Tesco with other similar companies, but also to perform a multiple valuation analysis. To decide which companies to add to the peer group, we looked at two criteria: a) the type of activity and b) the location. After a careful analysis, we got the following list of comparables:
8 Check next sub-section, “Comparables”.
Table 3 – WACC decomposition
TESCO PLC COMPANY REPORT
Company EBITDA Margin
EBIT
Margin EV/EBITDA
Net Debt to EBITDA
(x)
Debt/Equity
Sales Growth YoY (%)
Moody's LT Rating
TESCO PLC 6.5% 4.0% 7.15 1.99 65.1% 1.4% Baa1
SAINSBURY (J) PLC 6.0% 3.8% 6.56 1.55 48.5% 4.5% -
WM MORRISON SUPERMARKETS 6.8% 4.7% 6.97 2.05 46.9% 2.6% Baa1
CARREFOUR SA 4.9% 3.0% 7.43 1.76 217.0% 1.2% Baa2
KONINKLIJKE AHOLD NV 6.3% 3.2% 5.94 -0.19 60.0% 8.5% Baa3
JERONIMO MARTINS 6.7% 4.6% 11.94 0.37 59.2% 10.5% -
D.I.A. 6.0% 3.3% 7.85 1.61 745.8% 4.1% -
METRO AG - - 5.31 - 153.8% -1.6% Baa3
WHOLE FOODS MARKET INC 9.5% 6.8% 14.27 -0.82 0.7% 10.4% -
Max 9.5% 6.8% 14.27 2.05 745.8% 10.5%
Avg 6.6% 4.2% 8.16 1.04 155.2% 4.6%
Med 6.4% 3.9% 7.15 1.58 60.0% 4.1%
Min 4.9% 3.0% 5.31 -0.82 0.7% -1.6%
It is important to highlight that Tesco’s margins are close to the average of its peers. Moreover, the company has a lower D/E ratio than most of the other companies being analysed.
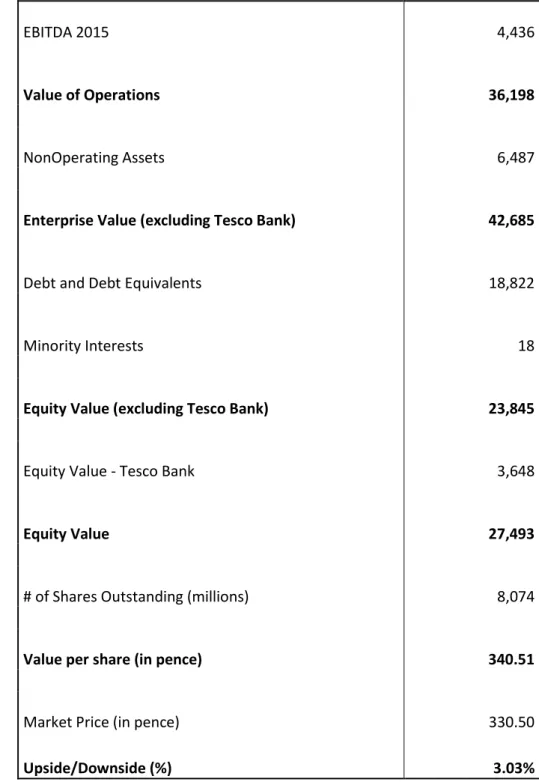
Multiples Valuation
Using the average value of Enterprise Value to EBITDA (EV/EBITDA) multiples of the peer group companies, we performed a valuation of Tesco. The result was a target price of 340.51 pence, which comes in line with our SOTP valuation and
recommends an HOLD of Tesco’s shares.
Table 4 – Comparables List and Data
TESCO PLC COMPANY REPORT
Unit: Million Pounds, unless stated otherwise
EBITDA 2015
4,436
Value of Operations
36,198
NonOperating Assets
6,487
Enterprise Value (excluding Tesco Bank)
42,685
Debt and Debt Equivalents
18,822
Minority Interests
18
Equity Value (excluding Tesco Bank)
23,845
Equity Value - Tesco Bank
3,648
Equity Value
27,493
# of Shares Outstanding (millions)
8,074
Value per share (in pence)
340.51
Market Price (in pence)
330.50
Upside/Downside (%)
3.03%
Table 5 – Comparables Multiple Valuation
TESCO PLC COMPANY REPORT
Retail in the UK
Macroeconomic analysis
British economy has shown signs of recovery and it seems that growth is on its way. After the recession occurred in 2008-2009, the economy started to expand again in the first three quarters of 2010, but since the last quarter of 2010, the economy started to reduce its growth, entering in recession in the last three quarters of 2012. Since the beginning of 2013, the economy has shown new signs of expansion, growing 0.7% in Q2 and 0.8% in Q3. GDP is expected to grow 1.5% in 2013 and 2.6% in 2014.9
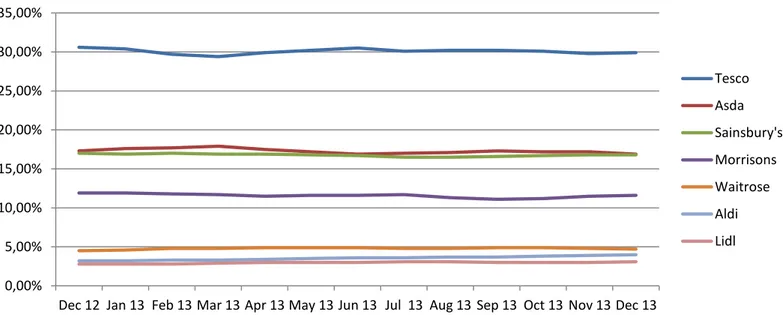
Food retail market & Tesco
The food retail market in the United Kingdom grew 2.0% per year in 2012 and 2013, and is expected to grow 1.7% in 2014 and 1.3% in 2015.10 In fact, in a market that is widely saturated, it has been facing a significant transformation recently. The so called “Big Four” (Tesco, Sainsbury, Morrison and Asda) have been losing market share to both upmarket retailers (Waitrose) and discounters (Aldi and Lidl). By looking at the graph 4, it is possible to observe the positioning of principal food retailers in the UK.
9 World Bank data and forecasts 10 Trading Economics data and forecasts
Waitrose
Discounters
Big Four
Low Price
Low Quality
Graph 4 - Positioning of the UK's principal retailers
High Price High Quality
TESCO PLC COMPANY REPORT
December 2012 December 2013
Big Four
76.8%
75.2%
Discounters
6.0%
7.1%
While on the one hand the quality supermarket Waitrose, which focus on higher quality products with higher prices (see graph) only increased 0.1 pp, on the other, discount stores have moved its market share from 6.0% in December 2012 to 7.1% in December 2013. Aldi has passed from a market share of 3.2% to 4.0%, while Lidl has passed from 2.8% to 3.1%. Moreover, Lidl announced that has plans to more than double the number of stores in the UK.
Among the “Big Four” group, Tesco was the one that lost the highest portion of market share during this period (0.7 pp), while Sainsbury was the one that lost the shortest portion of market share (0.2 pp).
Despite the international presence of Tesco, its main source of value is still its retail business in the UK, representing 55% of the Enterprise Value (EV), according to our calculations. However, this value has been affected by the weak performances recorded in the past years. In order to improve this, the company started a recovery plan last year.
We believe that Tesco will keep losing its market share to 29%, and, then, will maintain this value. However, since the food retail industry is expected to grow, we strongly believe that there will not be a decrease in sales for Tesco.
Number of new stores
In the UK, Tesco has 7 different store formats: Tesco Extra, Tesco Homeplus, Tesco Superstore, Tesco Metro, Tesco Express, One Stop and Dobbies. The last two were acquired by Tesco in 2003 and 2008, respectively.
0,00% 5,00% 10,00% 15,00% 20,00% 25,00% 30,00% 35,00%
Dec 12 Jan 13 Feb 13 Mar 13 Apr 13 May 13 Jun 13 Jul 13 Aug 13 Sep 13 Oct 13 Nov 13 Dec 13
Graph 5 - UK's Food Retail Market Share (%)
Tesco
Asda
Sainsbury's
Morrisons
Waitrose
Aldi
Lidl
Source: Kantar Worldpanel - 12 weeks Market Share
Table 5 –UK’s Food Retail Market Share (%)
TESCO PLC COMPANY REPORT
From “Tesco Stores”, Express and Metro are dedicated exclusively to food,
Homeplus sells non-food items, while Extra and Superstore are focused in food products but also present some non-food lines. Regarding store sizes (see
annex…), Extra, Homeplus and Superstore are bigger stores, while Metro and Express are smaller ones.
One Stop is the typical convenience store and Dobbies is one of the UK’s leading
garden centre businesses.
Due to the restructure plan started last year, we assumed that the total number of net new stores will be 200 for the projected years. We believe that the focus will be Tesco Express, Tesco Metro and One Stop, due to the fact that these are small size stores, which has been the strategy trend of the company. Then, we believe that Tesco Superstore and Tesco Extra, which are stores with higher space, will continue to expand geographically but slower. The same for Dobbies, which we believe is seen as a lower priority for Tesco. From our point of view, Tesco Homeplus will not suffer any kind of new store investment as the company will focus its efforts in food lines rather than non-food products.
In addition, we also considered for analysis the online business (Dotcom-only). This was taken into account for further investments as it requires special automated stores built for this purpose. Inside these, staff members collect the
clients’ orders and pick the products from the store. Then, they introduce them into a system that will hold them and then distribute it for different vans in a ‘first in first out’ order. Tesco built the first Dotcom-only store in October 2008 and since then has opened other 4 of this kind. During this year, they opened a new store with 16% more space than the previous ones. Therefore, we expect that they will keep opening a store of this size per year for the next years.
Like-for-like sales
As it was stated in the beginning of this sub-chapter, Tesco will face an increase in competition in the British retail market. In addition, as we can see in the graph 6, Tesco, alongside with some of its competitors, has been facing some difficulties in LFL sales growth. However, we believe there won’t be a sales
TESCO PLC COMPANY REPORT
4%
2%
2% 3%
-1% 5%
3%
5% 5%
2% 8%
6%
1%
2%
-2% 0%
4% 4% 4% 3%
-4% -2% 0% 2% 4% 6% 8% 10%
2009 2010 2011 2012 2013
Graph 6 - Like-for-like sales growth rate (%)
Tesco
Sainsbury's
Morrisons
Waitrose
EBITDA margin
Another impact caused by a higher competition is the reduction faced in margins. Tesco has been pressing some suppliers in order to reduce its costs, and, in fact, announced recently a partnership with Hilton, a meat supplier. In the future, we think that Tesco will try to increase this kind of partnerships, and therefore increase its margin.
Despite this, we believe that the EBITDA margin will decrease from 8.6% in 2013 to 6.0% in 2014, reflecting the decrease in prices that Tesco will have to do to compete against discounters. We believe this value will be constant until 2016, when it will increase to 6.5%.
TESCO PLC COMPANY REPORT
Retail in Asia
Macroeconomic analysis
Thailand
After a period of almost double digit growth until 1995, Thailand’s economy faced
the effects of the “Asian Crisis” in 1997 and 1998. Then, the economy recovered and from 2002 until 2007 it grew at an average of 5% per year.11
This economic growth reduced its pace in 2009, due to the effects of “Global crisis”, and recorded a negative growth of 2.3%. By growing 7.8% in 2010, the economic expansion was expected to continue, but the floods in 2011 caused a growth of only 0.1% in that year. In 2012, the economy grew 6.4%, and is expected to grow 5.9% and 4.2% in 2013 and 2014, respectively.12
Despite the economic growth, Thailand still has regions, mainly in the North of the country, which register high percentage of poverty. The country is still characterized by inequalities in many different fields. That is the reason why the Gini coefficient has not moved from 0.45 in the last two decades.13
Malaysia
Malaysia’s economy registered an average growth of 7.3% from 1985 to 1995.
Then, the economy suffered the effects of the “Asian crisis” between 1997 and
1998. In the following years, the economy grew until 2008 at an average of 5.5% per year. 14
Malaysia presented in 2010 the NEM – New Economic Model, which has the goal of expanding the economy while keeping sustainability and inclusion. It registered a growth of 7.2% in that year, and 5.1% and 5.6% in 2011 and 2012, respectively. The economy is expected to grow at 5.1% and 5.2% in 2013 and 2014, respectively.15
Although poverty is still a reality in the country, Malaysia’s growth over the last
years led to a reduction in poverty, from 12.3% in 1984 to 2.3% in 2009.16
South Korea
South Korea was one of the world’s most successful cases of growth in the last 50 years. Its economy registered 10% annually growth from 1962 to 1994. After
TESCO PLC COMPANY REPORT
the “Asian crisis”, the country kept growing, but at lower rates. In fact, Korea is now a mature economy, and therefore higher growth rates are not much expected. Currently, it is the 15th largest economy in the world.17
In 2009, the crisis affected Korean economy, which led to a growth of only 0.3%. Then, it started to expand again, but this growth decreased from 6.3% in 2010 to 3.6% in 2011, and to 2.0% in 2012. The economy is expected to grow 2.8% and 3.9% in 2013 and 2014, respectively.18
Food retail market & Tesco
Since its first experience in Thailand in 1998,Tesco has expanded to the Asian region, entering in South Korea (1999), Malaysia (2002), Japan (2003) and China (2004). In 2012, Tesco discontinued operations in Japan due to accumulated losses. In October 2013, the same happened to operations in China.
In the countries in which Tesco still has operations, it has either the first or the second market share position.19 Moreover, Tesco has launched online grocery businesses in Thailand and Malaysia. It is assumed by the company that this is the business segment with the higher potential to grow. However, any future investment is restricted by the restructure plan that is going on in the UK.
Thailand
In Thailand, the food retail industry has four major players: 7-Eleven, Tesco Lotus, Big C and Central Retail Corporation. In a market characterised by the important role of convenience stores, 7-Eleven is the leader, and accounts for almost 7,000 convenience stores.20
For the future, in a market that it is believed to grow 11.51% in 2014 and 8.76% in 201521, we believe that Tesco Lotus has a huge potential to grow and will continue to open stores at the rhythm it did in the past. Therefore, we predict a constant opening of 5 hypermarkets and 300 convenience stores per year. Regarding sales growth, we believe that LFL sales growth will keep stable at 3%, continuing the tendency of last years.
Malaysia
Acording to Trading Economics, in Malaysia, consumers confidence is expected to raise from 95.68 in 2013 to 113.86 in 2014. Moreover, consumer spending is expected to grow in the same period from MYR 105,340mn to MYR
17 World Bank Information and Data 18 World Bank Information and Data 19 Company Information
TESCO PLC COMPANY REPORT
125,258mn.22 In a market in which about 70% of the consumption is driven by supermarkets and hypermarkets23, Tesco has potential to continue to be the fastest growing retailer and market leader.
Therefore, we believe that the number of new stores will continue at the same rythm than the last years, and the focus should continue to be hypermarkets (5 per year).
Regarding sales growth, we believe that the trend of last years will continue, and therefore the main source of growth will be the new stores. So, we assumed that LFL sales growth will be null during the projected years.
South Korea
In South Korea, a new regulation was issued in 2012 that restricts the number of opening hours for big stores. That penalized Tesco in about £100mn.24 Despite of this event, food retail market grew 1.30% in that year and 1.92% in 2013.25 Moreover, the market is expected to 2.36% in 2014 and 2.18% in 2015.26
In an industry in which hypermarkets and supermarkets represent nearly 55% of total retail consumption,27 Tesco needs to decide which is the best way to
“attack” the market. Moreover, in the past years, Emart and Costco have been
growing more than any other supermarket chain.
So, we believe that the company will invest at the same rhythm than in the past, allocating the number of new stores across the different categories.
Regarding LFL sales growth, we believe that Tesco will continue to have negative values in the next two years due to the pressure of other peers. Afterward, this value should stabilize.
EBITDA margin
Since China’s operations, which we believe were not profitable, do not account for this segment anymore, we believe that EBITDA margin will increase 0.5 p.p. from 8.3% in 2013 to 8.8% in 2014. We believe this value will keep stable, which implies EBIT margins between 5.7% and 5.9%.
TESCO PLC COMPANY REPORT
Retail in the Rest of Europe (RoE)
Macroeconomic analysis
Czech Republic
Czech Republic suffered the effects of the 2009 crisis, and its economy decreased 4.5%. Then, it had growths of 2.5% in 2010 and 1.9% in 2011. However, the economy fell 1.3% in 2012 and it is expected to continue with a
negative growth of 0.4% in 2013. In 2014, Czech’s Economy is expected to turn
this around and grow 1.6% in 2014.28
Hungary
The Hungarian economy has also suffered drastically with the global crisis in 2009, with a decrease of 6.8% in its GDP. Then, it recorded growths of 1.3% in 2010 and 1.6% in 2011, but again, in 2012, it had a negative growth rate of 1.7%. This economy is expected to grow by only 0.2% in 2013 and by 1.4% in 2014.29
Poland
Polish economy grew only 1.6% in 2009, but it has expanded its growth rates to 3.9% in 2010 and 4.5% in 2011. However, growth decreased in 2012 to 1.9%,
and is expected to continue decreasing in 2013 to 1.1%. Afterwards, Poland’s
economy is expected to growth at 2.2% in 2014.30
Slovakia
Slovakia’s economy decreased 4.9% in 2009. Afterwards, it has recovered and
grew 4.4% in 2010. However, since then the economy has been contracting and its growth has decreased to 3.2% in 2011 and 2.0% in 2013. This trend is expected to maintain in 2013, with a growth rate of only 1.0%. Then, growth is expected to boost again to 2.8% in 2014.31
Turkey
In RoE segment, Turkey is the only country that is not included in European Union. Despite being a candidate for that since 1999, its entrance process is still in progress due to many obstacles that exist regarding this. An example is the conflict between Turkey and Cyprus.
TESCO PLC COMPANY REPORT
Turkish economy suffered the effects of the crisis in 2009 and recorded a decrease of -4.8%. Then, it returned to its trend of high growth with 9.2% in 2010 and 8.5% in 2011. However, it only grew 2.6% in 2012 and is expected to grow 3.4% and 3.7% in 2013 and 2014, respectively.32
Republic of Ireland (RoI)
Ireland suffered a recession period after 2008, registered negative GDP growth rates during three years (-2% in 2008, -5% in 2009 and -1% in 2010). Then, the economy managed to grow at 1% per year in 2011 and 2012.33 It is expected a GDP growth rate of 0.6% in 2013 and 1.8% in 2014.34
In December 2010, Ireland needed to receive an help package of €85bn from
IMF and European Central Bank. However, three years after, the country decided to return to the markets without any kind of help.
Food retail market & Tesco
Tesco started its internationalization process by entering in France in December 1992. This was achieved through the acquisition of a 76% stake of Catteau, a family-owned company, for £176mn. The objective was to create an important supermarket chain in the country. However, this was refuted in late 1997, when the company decided to quit the business, selling it to the hypermarket chain Promodes for £225mn.35
In other European countries, Tesco started its operations in Hungary in 1995. Then, it continued to expand opening stores in Czech Republic, Poland and Slovakia in 1996, Ireland in 1997, and finally Turkey in 2003.
Tesco is either leader or vice-leader in all these countries except Turkey.36 Moreover it has successfully launched online grocery businesses in all Central Europe countries. However, in recent years, difficulties have arisen especially due to austerity.
Investment in this region will not be a priority for the company in the following years, as the focus is to restructure operations in the UK.
Czech Republic
Despite the recession, food retail industry in Czech Republic grew in 2012 and 2013, 1.0% and 1.1% respectively.37 According to Kantar Worldpanel, the market
32 World Bank Data and Forecasts 33 World Bank Data and Forecasts 34 IMF Estimates
TESCO PLC COMPANY REPORT
is dominated by Kaufland, which accounts for a market share of 17%. Tesco is the 2nd player with a 12% market share. Penny Market and Lidl are also important players, representing 11% and 7%, respectively.
The market is expected to continue growing at 1.1% in 2014 and 2015.38 We believe that Tesco will continue facing the same hurdles that they faced in the past. So, we expect two years of null LFL sales growth, and then this value should settle at 1%, as we assume that economic recovering will boost the food retail market.
Investment will be reduced, and therefore, we expect a constant number of 22 net new stores during the projected period.
Hungary
Still suffering the effects of austerity, Hungarian food retail market has been experiencing a shift. According to Kantar Worldpanel, cheaper products have been preferred, which only reinforces the market share of groceries and small shop chains. Therefore, retailers like Tesco will keep facing difficulties in growing, although the food market is expected to grow 1.0% per year in 2014 and 2015.39 We believe that Hungary should not be a priority for Tesco and investment will continue to be reduced. So, we only expect an opening of 3 stores per year, during the projected period.
Regarding sales growth, we believe that the problems described above will continue to be faced and that the past tendency will continue, so, we expect null LFL sales growth during the projected period.
Poland
In a market that grew 3.8% in 2012 and 4.6% in 2013,40 the costumers are giving a higher preference to discount store. As a consequence, non-discounters like Tesco are facing difficulties to grow in a market that is dominated by a discount grocery: Biedronka. The subsidiary of the Portuguese group Jerónimo Martins is a case of success and, as we can see in the graph, has been able to grow sustainably.
TESCO PLC COMPANY REPORT
It is our belief that Poland will be a difficult market to grow for Tesco, and therefore should not constitute a priority. As a consequence, we think that there will be a reduction in the investment to a constant number of 1 hypermarket and 15 other stores per year.
We believe that LFL sales will be settled at 1%, continuing the pace of the last years and being affected by the fierce competition of discounters.
Slovakia
The Slovakian food market has been affected by the Euro crisis, having registered a negative growth of -0.8% in 2012.41 Even though, Tesco managed to become the market leader in that year, outperforming Coop Jednota, a Slovakian chain that was leader for many years.42 In 2013, showed a slightly recover of 0.3%, but it is expected to continue decrease in 2014 and 2015, 1.6% and 0.4%, respectively.43
In the past years, Tesco has been able to prove its success among Slovakian costumers. However, the decrease in the market that is expected may slow the potential growth of the company. Therefore, Slovakia should be a priority for Tesco investment, but, growth should not been expected immediately.
41 Trading Economics Data 42 Kantar Worldpanel Information 43 Trading Economics Data and Forecasts
2% 2% 3% 2%
-4% 20%
8%
12%
13%
6%
-5% 0% 5% 10% 15% 20% 25%
2009 2010 2011 2012 2013
Graph 7 - Like-for-like sales growth rate (%)
Tesco
Biedronka
TESCO PLC COMPANY REPORT
We assume that Tesco will continue the same pace of investment that did in the last years. Therefore, we expect that 4 hypermarkets and 10 other stores will be opened per year.
As we stated before, we predict some difficulties in LFL sales growth, which we assume would be -1% in 2014 and 2015, 0% in the following 4 years, and 1% afterwards.
Turkey
As a consequence of an economy in constant transformation, food retail market has seen in Turkey growth rates of almost two digits. In fact, the market grew 8.6% in 2012 and 9.1% in 2013, and is expected to grow 12.84% in 2014 and 13.96% in 2015.44 However, the market is composed by too many local small retail chains45, which have higher expertise than Tesco in the market and constitute a major threat. In fact, the company has been facing some difficulties establishing its own position, as it is stated in the company annual report. Moreover, investment in this country is not a priority for the company.
Following this logical thinking, we assume that investment will be reduced, and therefore Tesco will only open 1 hypermarket and 10 other stores per year in the country.
We believe that the trend of past years will continue, and therefore we estimate null LFL growth during the projected period.
Republic of Ireland (RoI)
The food retail industry in Ireland is constituted by 6 main players. There are two discount groceries (Aldi and Lidl) and an upmarket chain (Superquinn) which serve different segments of population from the others (Tesco, Dunnes and SuperValu).
Looking to the evolution of market share in the last year, we can notice that discount stores have been able to increase their market penetration. Aldi managed to increase its market share in 1.2 pp. On the opposite site, Tesco was the one that recorded the highest reduction in market share (1.7 pp).
TESCO PLC COMPANY REPORT
Within a market that is expected to grow 0.81%, according to Trading Economics, we believe that Tesco will have opportunities to shine, while facing some challenges in keeping its market share to players as Aldi and Lidl, and even in maintaining its market leader position as Dunnes is getting closer.
We believe that Tesco will keep the past trends in the number of new stores, but will reduce the investment in the country in the future. No more hypermarkets will be opened as the focus has been smaller stores. Therefore, Tesco will open a store per year for the next 2 years, two in following two, and three stores per year afterwards.
Even though, we believe Tesco sales will not decrease, in what regards LFL sales growth, we believe that the negative trend will continue and Tesco will face a growth of -1% in the next year. Then, in 2015 and 2016, this value will settle at 0% and, it will be 1% afterwards.
EBITDA margin
Following the bad perspectives for some of the markets described above, and the higher competition expected, we believe that EBITDA margin will step down from 10% in 2013 to 9% onwards. This implies an EBIT margin between 3.2% and 2.2% over the projected years.
0,00% 5,00% 10,00% 15,00% 20,00% 25,00% 30,00%
Dec 12 Jun 13 Dec 13
Graph 8 - Ireland's Food Retail Market Share (%)
Tesco
Dunnes
SuperValu
Aldi
Lidl
SuperQuinn
TESCO PLC COMPANY REPORT
Non-operating activities
Besides retailing, Tesco has other activities that also constitute value to the company. We focused our attentions in Investment Property and Tesco Bank
Investment Property
Tesco holds Investment Property assets around the world, which generate income from rents. Since there is no information about what kind of properties Tesco manages or even where they are located, making a precise valuation of these assets was impossible. Therefore, we accepted the fair value estimated by the company in its annual report. However, we predicted the CFs, assuming a null growth rate, and we concluded that the Internal Rate of Return (IRR) implied in this valuation was 7.2%.
In order to evaluate if the IRR obtained is in line with the cost of capital of a real estate company, we set a list of all the real estate companies presented in the countries where we believe Tesco has investment property assets. Looking to the WACC of these companies, we obtained the following results:
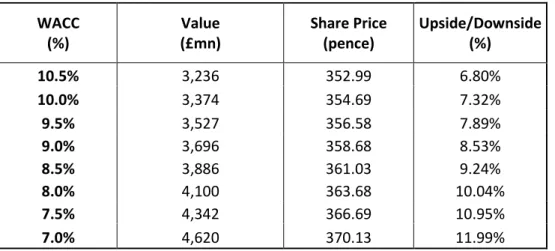
We can conclude that the IRR that we obtained for the implied fair value of these assets might be too small for a real estate company. Therefore, the value of Investment Property may be smaller than what its disclosed by the company. In order to understand the risks that a smaller value of Investment Property may result in the target price, we conducted a sensitivity analysis, presented below.
WACC Max 24,7%
Avg 9,4%
Med 8,5%
Min 1,3%
Table 6 – Real Estate companies WACC analysis
TESCO PLC COMPANY REPORT
Source: Analyst Estimates
Sensitivity analysis
WACC
(%)
Value
(£mn)
Share Price
(pence)
Upside/Downside
(%)
10.5%
3,236
352.99
6.80%
10.0%
3,374
354.69
7.32%
9.5%
3,527
356.58
7.89%
9.0%
3,696
358.68
8.53%
8.5%
3,886
361.03
9.24%
8.0%
4,100
363.68
10.04%
7.5%
4,342
366.69
10.95%
7.0%
4,620
370.13
11.99%
From the sensitivity analysis that we performed, the biggest conclusion is that the
final recommendation would be to hold Tesco’s shares within all the different
values we assumed for the Investment Property WACC.
Tesco Bank
With the aim of supporting its retail customers in the UK, Tesco has a financial subsidiary, Tesco Bank. Regarding its valuation, and since it is a financial institution we decided to reach the equity value instead of the enterprise value. To do so, we used a price-to-earnings multiple of the potential comparables for this kind of financial services company.
Using a P/E multiple of 26.7246 we obtained an Equity Value for Tesco Bank of £3,648mn.
Sensitivity analysis
We conducted a sensitivity analysis to determine the impact in Tesco Bank valuation of using different price-to-earnings multiple, and therefore the impact in
Tesco’s share price. The results were the following:
46 Average P/E multiple of peer group made for Tesco Bank
TESCO PLC COMPANY REPORT
Source: Analyst Estimates
P/E Multiple
Value
(£mn)
Share Price
(pence)
Change
(%)
23.72
3,238
358.61
8.51%
24.72
3,375
360.31
9.02%
25.72
3,511
362.00
9.53%
26.72
3,648
363.69
10.04%
27.72
3,784
365.38
10.55%
28.72
3,921
367.07
11.06%
29.72
4,058
368.76
11.58%
TESCO PLC COMPANY REPORT
Scenario
Continuation of divestures
Following the restructure strategy implemented by Mr. Philip Clarke, and after the divestures in Japan, US and China, we believe that there is a chance that Tesco leaves other countries. Not only because Tesco’s main value creation source still is its UK operations, but also because internationalization did not bring the growth and the success that were expected.
Tesco leaving Turkey with £165mn of accumulated
losses
Tesco operations in Turkey have been described as troubled by the company. In
fact, in the last annual report, it was stated: “(…) to China and Turkey (…) We will be committing less capital in the coming years than we have done in the past
(…)”. Tesco has already left China and we believe that Turkey may be next.
Therefore, we performed a scenario analysis on this probability, assuming that the company will present a loss of £165mn (we assumed that this also includes the amount Tesco will pay to exit the market). We estimated this value assuming a 5% loss margin on the last 5 years revenues. We also assumed an improvement in EBITDA margin of 1% for the rest of the segment.
TESCO PLC COMPANY REPORT
Table 9 – Consolidated Income Statement
Appendix I
–
Financial Statements
Unit: Million Pounds, unless stated otherwise 2009 2010 2011 2012 2013 2014E 2015E 2016E 2017E 2018E 2019E 2020E 2021E 2022E 2023E
Revenue (excluding IFRIC) 52,854 54,931 58,651 62,390 63,329 63,275 64,165 65,683 67,442 69,822 72,077 74,395 77,321 80,352 83,496
EBITDAR 4,924 5,332 5,780 6,143 6,760 5,643 5,709 5,818 5,949 6,122 6,524 6,697 6,912 7,136 7,368
Rents -693 -817 -909 -1,101 -1,273 -1,273 -1,273 -1,273 -1,273 -1,273 -1,273 -1,273 -1,273 -1,273 -1,273
EBITDA 4,231 4,515 4,871 5,042 5,487 4,370 4,436 4,545 4,676 4,849 5,251 5,424 5,639 5,863 6,095
Depreciation and Amortization -1,259 -1,420 -1,499 -1,601 -2,517 -1,540 -1,629 -1,722 -1,819 -1,920 -2,024 -2,133 -2,246 -2,363 -2,484
EBIT 2,972 3,095 3,372 3,441 2,970 2,831 2,807 2,823 2,857 2,929 3,227 3,292 3,394 3,500 3,611
Tesco Bank Trading Profit 68 250 264 225 191 176 176 176 176 176 176 176 176 176 176
Investment Property Operating Profit 178 232 262 301 291 320 326 332 339 345 351 357 363 369 376 Share of post-tax profits of joint
ventures and associates 110 33 57 91 54 73 73 73 73 73 73 73 73 73 73
Net Financial Costs -362 -314 -333 -235 -282 -298 -197 -183 -168 -152 -135 -108 -81 -49 -15
One-off costs: 83 45 203 213 -1,265 -50 -50 -50 -50 -50 -50 -50 -50 -50 -50
Impairment of Goodwill 0 -131 0 0 -495 -125 -125 -125 -125 -125 -125 -125 -125 -125 -125
Other one-off costs 83 176 203 213 -770 76 76 76 76 76 76 76 76 76 76
PBT 3,049 3,341 3,825 4,036 1,959 3,051 3,135 3,172 3,227 3,320 3,642 3,739 3,875 4,019 4,170
Tax -779 -840 -864 -874 -574 -684 -703 -711 -724 -745 -817 -839 -869 -901 -935 Profit from the year from the year
from continuing operations 2,270 2,501 2,961 3,162 1,385 2,367 2,432 2,460 2,503 2,576 2,825 2,901 3,006 3,118 3,235
Discontinued operations -142 -165 -292 -350 -1,266 0 0 0 0 0 0 0 0 0 0
Profit for the period 2,128 2,336 2,669 2,812 119 2,367 2,432 2,460 2,503 2,576 2,825 2,901 3,006 3,118 3,235
TESCO PLC COMPANY REPORT
Table 10 – Consolidated Balance Sheet
2009 2010 2011 2012 2013 2014E 2015E 2016E 2017E 2018E 2019E 2020E 2021E 2022E 2023E
Assets
OPERATING ASSETS
Non-Current Assets
Goodwill 3,850 4,017 4,062 4,235 3,934 3,729 3,867 4,006 4,144 4,283 4,422 4,562 4,701 4,840 4,979
PP&E 23,128 24,142 24,287 25,600 24,776 24,674 26,218 27,830 29,508 31,258 33,080 34,976 36,948 39,001 41,136
Other non-current operating assets 42 25 290 549 643 581 589 603 619 641 661 683 709 737 766
Total Non-Current Assets 27,020 28,184 28,639 30,384 29,353 28,985 30,675 32,439 34,271 36,182 38,164 40,220 42,358 44,578 46,881
Current Assets
Inventories 2,669 2,729 3,162 3,598 3,744 3,672 3,688 3,739 3,801 3,897 3,983 4,070 4,187 4,306 4,474
Trade and Other Receivables 1,735 1,774 2,070 2,120 2,339 2,297 2,310 2,345 2,387 2,451 2,508 2,567 2,644 2,724 2,830
Operating cash 1,177 1,223 1,307 1,391 1,411 1,397 1,416 1,449 1,488 1,540 1,590 1,640 1,704 1,771 1,840
Other current operating assets 157 134 152 48 32 48 49 50 51 53 55 56 59 61 63
Total Current Assets 5,738 5,860 6,691 7,157 7,526 7,414 7,463 7,583 7,728 7,941 8,135 8,333 8,594 8,862 9,207
TOTAL OPERATING ASSETS 32,758 34,044 35,330 37,541 36,879 36,398 38,138 40,022 41,999 44,123 46,299 48,553 50,953 53,440 56,088
NONOPERATING ASSETS
Excess cash and marketable securities 3,528 2,705 1,437 1,577 568 568 568 568 568 568 568 568 568 568 568
Investment Property 1,539 1,731 1,863 1,991 2,001 2,040 2,079 2,118 2,157 2,196 2,235 2,274 2,313 2,352 2,391 Investment in Joint-Ventures and
Associates 62 152 252 351 399 472 545 618 691 764 837 910 983 1,056 1,129
Tesco Bank Net Assets 631 806 1,240 1,538 1,422 1,422 1,422 1,422 1,422 1,422 1,422 1,422 1,422 1,422 1,422
Discountinued operations Net Assets 398 373 431 441 349
Other nonoperating assets 1,643 1,306 881 1,181 1,347 1,347 1,347 1,347 1,347 1,347 1,347 1,347 1,347 1,347 1,347
TOTAL NONOPERATING ASSETS 7,801 7,073 6,104 7,079 6,086 5,849 5,961 6,073 6,185 6,297 6,409 6,521 6,633 6,745 6,857
Total Assets 40,559 41,117 41,434 44,620 42,965 42,247 44,099 46,095 48,184 50,420 52,708 55,074 57,585 60,185 62,945
Liabilities
OPERATING LIABILITIES
Non-Current Liabilities
Other operating liabilities 799 871 1,172 1,532 1,436 1,110 1,126 1,152 1,183 1,224 1,264 1,304 1,355 1,408 1,462
Total Non-Current Liabilities 799 871 1,172 1,532 1,436 1,110 1,126 1,152 1,183 1,224 1,264 1,304 1,355 1,408 1,462
Current Liabilities
Trade and Other Payables 8,585 9,310 10,258 10,992 10,848 10,736 10,882 11,134 11,427 11,825 12,201 12,587 13,076 13,582 14,110
Other operating liabilities 508 618 687 544 640 455 461 472 484 501 517 534 555 576 599
Total Current Liabilities 9,093 9,928 10,945 11,536 11,488 11,191 11,343 11,606 11,911 12,326 12,718 13,121 13,630 14,158 14,709
TOTAL OPERATING LIABILITIES 9,892 10,799 12,117 13,068 12,924 12,301 12,468 12,758 13,094 13,550 13,981 14,424 14,985 15,566 16,172
NONOPERATING LIABILITIES
Post-Employment Benfit Obligations 1,494 1,840 1,356 1,872 2,378 2,378 2,378 2,378 2,378 2,378 2,378 2,378 2,378 2,378 2,378
Other nonoperating liabilities 627 746 613 328 574 574 574 574 574 574 574 574 574 574 574
TESCO PLC COMPANY REPORT
INTEREST BEARING LIABILITIES
Borrowings 15,640 13,049 10,725 11,551 10,427 8,467 8,210 7,948 7,689 7,384 6,907 6,420 5,856 5,249 4,659
Other Interest Bearing Liabilities 0 0 0 0 0 0 0 0 0 0 0 0 0 0 0
TOTAL INTEREST BEARING LIABILITIES 15,640 13,049 10,725 11,551 10,427 8,467 8,210 7,948 7,689 7,384 6,907 6,420 5,856 5,249 4,659
Total Liabilities 27,653 26,434 24,811 26,819 26,303 23,721 23,631 23,658 23,735 23,886 23,840 23,796 23,794 23,766 23,783
Equity
EQUITY ATTRIBUTED TO OWNERS OF
THE PARENT
Share Capital 395 399 402 402 403 404 405 406 407 408 409 410 411 412 413
Share Premium 4,638 4,801 4,896 4,964 5,020 5,076 5,132 5,188 5,244 5,300 5,356 5,412 5,468 5,524 5,580
All other reserves 172 348 66 245 685 1,133 1,586 2,040 2,493 2,946 3,399 3,852 4,305 4,758 5,211
Retained Earnings 7,644 9,048 11,169 12,160 10,530 11,896 13,326 14,785 16,287 17,862 19,686 21,585 23,590 25,707 27,940 TOTAL EQUITY ATTRIBUTED TO
OWNERS OF THE PARENT 12,849 14,596 16,533 17,771 16,638 18,509 20,450 22,419 24,431 26,516 28,850 31,259 33,774 36,400 39,144
Non-Controlling Interests 57 85 88 26 18 18 18 18 18 18 18 18 18 18 18
TESCO PLC COMPANY REPORT
Table 11 – Consolidated Cash-Flow Map
Unit: Million Pounds 2012 2013 2014E 2015E 2016E 2017E 2018E 2019E 2020E 2021E 2022E 2023E
NOPLAT 2,696 2,100 2,196 2,176 2,188 2,213 2,268 2,497 2,546 2,624 2,706 2,791
UK 1,941 1,606 1,473 1,461 1,468 1,472 1,497 1,706 1,733 1,785 1,836 1,887
Asia 486 347 482 502 527 560 599 634 671 713 757 805
RoE 268 147 240 213 193 181 173 157 141 127 112 98
Depreciation & Amortization 1,601 2,517 1,540 1,629 1,722 1,819 1,920 2,024 2,133 2,246 2,363 2,484
UK 730 1,414 694 736 780 826 874 924 976 1,030 1,087 1,147
Asia 322 437 299 322 345 369 394 419 445 472 499 528
RoE 549 666 547 571 597 624 652 681 712 743 776 810
Operating Gross CF 4,297 4,617 3,735 3,805 3,910 4,032 4,188 4,521 4,679 4,870 5,068 5,275
Investment Revamping & Capex -2,516 -817 -611 -2,329 -2,471 -2,615 -2,768 -2,924 -3,086 -3,255 -3,430 -3,612
UK -1,141 -384 -1,704 -1,301 -1,385 -1,473 -1,564 -1,660 -1,761 -1,866 -1,976 -2,090
Asia -870 -295 1,232 -628 -659 -691 -724 -758 -792 -828 -865 -902
RoE -506 -138 -138 -399 -427 -450 -480 -506 -533 -560 -589 -619
Investment in Net Working Capital 163 -529 16 97 133 149 187 183 190 230 240 186
UK 81 -341 54 58 82 84 111 113 116 148 153 115
Asia 50 -65 -46 37 43 51 57 56 59 64 69 60
RoE 32 -124 9 2 8 15 20 14 15 17 18 11
Investment in Goodwill and other
intangible assets 900 -319 -49 -282 -287 -292 -298 -302 -307 -311 -316 -320
UK 607 -240 10 -11 -11 -10 -10 -10 -10 -9 -9 -9
Asia 88 -34 -65 -201 -204 -207 -210 -213 -217 -220 -224 -227
RoE 205 -45 6 -70 -73 -74 -78 -79 -80 -81 -83 -84
Impairment of Goodwill 0 350 97 97 97 97 97 97 97 97 97 97
UK 0 0 0 0 0 0 0 0 0 0 0 0
Asia 0 0 20 20 20 20 20 20 20 20 20 20
RoE 0 350 77 77 77 77 77 77 77 77 77 77
Change in Other Operating
Assets/Liabilities 62 -78 -465 13 22 26 35 33 34 43 45 46
UK 31 -47 -301 6 13 13 20 20 20 27 28 29
Asia 19 -3 -96 8 9 11 12 12 12 13 14 15
RoE 12 -29 -68 -1 0 2 3 2 2 2 2 3
CF Resulting from Investments -1,391 -1,393 -1,012 -2,403 -2,506 -2,635 -2,747 -2,913 -3,071 -3,196 -3,363 -3,602
Operating FCF to the Firm 2,906 3,224 2,724 1,402 1,404 1,397 1,441 1,609 1,608 1,674 1,705 1,672
Change in Excess Cash and
Marketable Securities -139 1,009 0 0 0 0 0 0 0 0 0 0
CF from Investment Property 101 266 251 256 261 266 270 275 280 285 290 294
Change in Investment in
Joint-Ventures and Associates -16 6 24 24 24 24 24 24 24 24 24 24
Change in Discountinued
Operations Net Assets -10 92 349 0 0 0 0 0 0 0 0 0
Change in Other Nonoperating
Assets -300 -166 0 0 0 0 0 0 0 0 0 0
TESCO PLC COMPANY REPORT
Effect from Other Non-Cash -588 -1,206 -408 -523 -536 -550 -564 -577 -592 -608 -624 -641
FCF to the Firm (Excluding Tesco
Bank) 1,771 1,414 2,999 1,218 1,212 1,196 1,231 1,390 1,379 1,434 1,454 1,409
Change in Interest Bearing
Liabilities Liabilities 826 -1,124 -1,960 -257 -263 -259 -305 -478 -487 -564 -608 -589
Interest Paid -235 -282 -298 -197 -183 -168 -152 -135 -108 -81 -49 -15
Tax Shields 51 83 67 44 41 38 34 30 24 18 11 3
Change in Post-Employment
Benefit Obligations 516 506 0 0 0 0 0 0 0 0 0 0
Change in Other Nonoperating
Liabilities -285 246 0 0 0 0 0 0 0 0 0 0
FCF to Equity (Excluding Tesco
Bank) 2,644 843 808 808 808 808 808 808 808 808 808 808
CF from Tesco Bank -1,343 236 137 137 137 137 137 137 137 137 137 137
FCF to Equity 1,301 1,079 944 944 944 944 944 944 944 944 944 944
CF from shareholders -1,301 -1,079 -944 -944 -944 -944 -944 -944 -944 -944 -944 -944
Purchase of treasury shares -13 0 0 0 0 0 0 0 0 0 0 0
Shares purchased for cancellation -290 0 0 0 0 0 0 0 0 0 0 0
Share-Based Payments 125 53 0 0 0 0 0 0 0 0 0 0
Issue of shares 69 57 57 57 57 57 57 57 57 57 57 57
Future purchase of
non-controlling interests -3 0 0 0 0 0 0 0 0 0 0 0
Dividends paid to non-controlling
interests -3 0 0 0 0 0 0 0 0 0 0 0
Dividends authorised in the year -1,180 -1,184 -1,015 -1,015 -1,015 -1,015 -1,015 -1,015 -1,015 -1,015 -1,015 -1,015
Tax on items charged to equity -6 -5 13 13 13 13 13 13 13 13 13 13
Fair Value reserve arised on