PRINT MEDIA AND SOCIAL MEDIA, THE COEXISTENCE AND
NEW STRATEGIES
António Henrique Pombeiro Belair
Dissertation submitted as partial requirement for the conferral of Master in Business Administration
Supervisor:
Professor Leandro Pereira, Visiting Assistant Professor, ISCTE Business School, Department of Marketing, Operations and Management
I
A
CKNOWLEDGEMENTS AND DEDICATIONTo produce this dissertation different people from different origins helped me, some even without knowing it.
First and foremost, the eternal dedication to my mother and father to the continuous support through all my life, without a second thought in helping despite the difficulties or everyday life. My family is the main responsible for the success that I achieve.
Secondly, to my Professor, Leandro Pereira, a true renaissance man, that does everything incredibly well and with the joy of a man that truly loves what he does. An example to follow and an objective to reach.
To the company Marktest, for the precious data that allowed me to have a better inside on our society. To Mr. Ricardo Costa, Mr. Luís Pedro Nunes and Mr. José Manuel Fernandes for their time and invaluable experience in the news media business.
To my brothers in life, for every second of help, support and comprehension.
To my high school friends, for the long lasting friendship every human should be allowed to enjoy.
Finally, to the people I now call friends that transformed a Master’s Degree in one of the richest and most fulfilling experiences in my life, especially to our departed but never forgotten friend, Vicente Castro Feijó.
II
A
BSTRACTToday’s media companies, particularly Print Media organizations seem to struggle in recent years, not only in a financial way, but also regarding a certain escape from the public in general. The tremendous importance of Media companies for western democracies, as gatekeepers, explain why we chose this particular topic. Without their work our societies would not be so vigilant and their evolution would not be so good in the last decades. In this work we tried to look for the cause of this situation and search for answers with a specific co-topic in mind, Social Media. This is easily explained by the close relation between these two in recent years and the consequences from that relation. We analysed data from both phenomena and talked with professional journalists and managers of Media companies to get a closer look of that reality. With that information, we went on to our final objective, to provide possible alternatives and suggestions to the organizations in this line of business, which make them able to improve their general results and their relation with Social Media.
KEYWORDS: Social Media; Print Media; Strategy Development JEL CLASSIFICATION: M11, O31, O33
III
R
ESUMOAs empresas de Media actuais, particularmente as de imprensa escrita parecem estar com dificuldades nos anos recentes, não só financeiramente, mas também em relação a uma fuga de público em geral. A tremenda importância que as empresas de Media têm nas democracias ocidentais, como guardiãs, explicam porque escolhemos este tema. Sem o seu trabalho, as nossas sociedades não seriam tao vigilantes e a sua evolução não seria tão boa como foi nas últimas décadas. Neste trabalho, tentámos investigar a causa desta situação e procurar por respostas com um tópico relacionado em mente, as Redes Socias. Facilmente se pode explicar esta situação pela próxima relação entre os dois, em anos recentes, e as consequências dessa relação. Analisámos dados dos dois fenómenos e falámos com jornalistas e gestores profissionais de empresas de Media para que pudéssemos ter uma melhor visão dessa realidade. Com essa informação, dirigimo-nos para o nosso objectivo final, providenciar possíveis alternativas e sugestões a organizações neste tipo de negócio, que as façam capares de melhorar os seu resultados gerais e a sua relação com as Redes Sociais.
IV
I
NDEXAcknowledgements and dedication ... I Abstract ... II Resumo ... III
1 Introduction ... 1
2 Literature Review... 3
2.1 Social Media- Basic definitions and origins ... 3
2.2 Status Quo ... 4
2.3 The Portuguese Case ... 9
2.4 Print Media - Basic definitions and concepts ... 18
2.5 Status Quo ... 19
2.6 The Portuguese Case ... 22
2.7 Photograph of the Reality ... 26
2.8 Financial Numbers and Graphs ... 33
3 Methodology ... 37
4 Strategy Plan Proposal ... 39
4.1 Previous Parts and Path to Strategy... 39
4.2 External Analysis ... 43
4.2.1 PESTEL ... 43
4.2.2 Five Forces of Porter ... 45
4.2.3 Competitive Analysis ... 48
4.3 Internal Analysis ... 50
4.3.1 Value Chain ... 50
4.3.2 Governance Model – OBS and Competencies... 52
4.4 Strategy Definition ... 54
V
4.4.2 Strengths and Weaknesses ... 55
4.5 Markets ... 59 4.6 Value Proposition ... 60 4.7 Operations ... 61 5 Conclusion ... 64 6 Bibliography ... 65 6.1 Books ... 65 6.2 Journals... 65
6.3 Electronic documents and articles ... 68 7 Annexes... A-1 AI - ITU Key Indicators ... A-2 A.II – Marketest Study Portuguese People and Social Media ... A-4
VI Index of Figures
Figure 4-1 – Porters’s 5 forces model. ... 47
Figure 4-2 – Schematic representation of the value chain for a media organization. ... 51
Figure 4-3 – Traditional newspaper model. ... 53
Figure 4-4 – Schematic representation of the SWOT analysis. ... 57
VII Index of Graphics
Graphic 2-1 – Number of smarphone users worldwide from 2014 - 2020 ... 4
Graphic 2-2 – American internet-users who use at least one social networking site. ... 5
Graphic 2-3 – Number of monthly active Facebook users worldwide as of 1st quarter 2017. .. 6
Graphic 2-4 – Leading social network in April 2017, by number of users. ... 8
Graphic 2-5 – Households with computer/internet access and broadband access 2002 - 2016. 9 Graphic 2-6 – Average price (in Euros) of mobile service in Portugal 2010 – 2016. ... 10
Graphic 2-7 – Percentage of people using smartphone versus feature phone 2013 – 2016. ... 11
Graphic 2-8 – Social networks where accounts/profiles were created (%) 2016. ... 15
Graphic 2-9 – Access to Social Media sites by type of equipment in Portugal 2016 ... 17
Graphic 2-10 – Global circulation market between 2011 and 2015. ... 19
Graphic 2-11 – Global newspaper revenues. ... 20
Graphic 2-12 – US digital audience growth of selected traditional print publishers. ... 21
Graphic 2-13 – Reach of news/information websites in European countries March 2013. .... 22
Graphic 2-14 – Number of total publications in Portugal since 2006 until 2016. ... 23
Graphic 2-15 – Number of publications of general information between 2006 and 2016. ... 25
Graphic 2-16 – Average circulation: Correio da Manhã 2006 - 2016. ... 28
Graphic 2-17 – Average circulation: Expresso 2006 - 2016. ... 29
Graphic 2-18 – Average circulation: Diário de Notícias 2006 - 2016. ... 29
Graphic 2-19 – Average circulation: Jornal de Notícias 2006 - 2016. ... 30
Graphic 2-20 – Average circulation: Público 2006 - 2016. ... 31
Graphic 2-21 – Average circulation: Sol 2006 - 2016. ... 31
Graphic 2-22 – Average circulation: Visão 2006 - 2016. ... 32
Graphic 2-23 – Average circulation: Sábado 2006 - 2016. ... 33
Graphic 2-24 – Impresa’s revenues from Print Media 2006 - 2016. ... 34
Graphic 2-25 – Cofina’s revenues from Print Media 2006 - 2016. ... 35
Graphic 2-26 – Cofina’s revenues from advertising 2006 - 2016. ... 36
VIII Index of Tables
Table 2-1 – Adults using the internet in 2016, by type of equipment, in Portugal. ... 12 Table 2-2 – Adults using the internet in 2016, by type of portable devices, in Portugal. ... 13 Table 2-3 – Internet users that engage in Social Media in Portugal and EU-28, 2011-2016. . 14 Table 3-1 – Summary of features of the interviews realized during research ... 38
1
1 I
NTRODUCTION21st century. The age of the internet, of 4g mobile speed, of autonomous cars, of cameras in every pocket and of Social Media or social networking.
All throughout history, various advances in technology and in the way of living created difficulties to established businesses and companies. It happened with Kodak (KOTTER, 2012) with the arrival of digital photography and with Nokia (VUORI & HUI, 2016) with smartphones just to name two examples.
As Darwin thought us, those who do no adapt, eventually will perish. That is true for animal evolution and is also true for any business that aims at being successful in the long haul. However, in today’s times that has become increasingly hard and demanding to certain organizations. That is understandable given the current pace of technology evolution (see original paper that gave origin to Moore’s Law (MOORE, 2006 and BERMAN & DORRIER, 2016). However, this extraordinary evolution does not affect only the organizations that deal or produce technology, given we live in a world where a laptop is a normal professional tool, and a smartphone is part of our routines. We reached a level where technology is present everywhere and in almost everything. This, just to say that the impact in our lives and, more important for the purposes of this dissertation, in the lives of every organization is tremendous. The amount of organizations affected by technological advances is almost unnumbered, so, for the purposes of studying an adaptation for certain organizations, a type of business must be chosen. That choice fell on the News Media, a type of organization that remain solid until a few years back, when the democratization of access to the internet and the rise in popularity of Social Media began to cause serious problems in organizations that render an essential service to most societies, keeping people informed (LEVI, 2011).
Nevertheless, News Media is a wide concept where one might include various distribution platforms including Radio, TV, Cable, Internet including Social Media, Newspapers and Magazines.
After much thought given to this subject, we came do the conclusion that our focus should be concentrated on Print Media, Social Media and Native Digital News Platforms. The reasons behind this are fairly easy to explain and will be better developed along our work, but, for now, let us just give a simple summary.
2 The Radio business dealt with a crisis before the age of the internet. In the 80’s and 90’s of the 20th century, radio was left behind TV and had to reinvent themselves. The boom of the internet in the first years of the 21st century actually gave some new tools to this type of business making it possible to broadcast worldwide via web, and the emergence of podcasts1 in recent years also helped. So, for the sake or strategic thinking, Radio was not the platform in most need of help. When it comes to TV and Cable TV, although also affected by the World Wide Web, it adapted and made use of the tools throughout Play software available to the audiences and a steady revenue from advertisers that still rely on TV to pass the message to a big chunk of their target. That left us with the Print Media, probably the biggest victim of the global village we call planet earth, where news travels at the speed available from your internet service provider. Regarding online news, besides que TV Channel’s websites and digitally native news organizations, other important platforms play a major role in the news business, Social Media (MESSING & WESTWOOD, 2014; FULLERTON, 2017).
These platforms (as they like to labelled themselves), allow any user to communicate and share text, photography and video, whether we are talking about the account of a private citizen or of a news organization (TV, Radio, Newspaper and others forms) are tremendous. We should remind that, although, any person or organization (SMITH et al, 2015) could have his own website, Social Media differs from this because these sites have millions of accounts from private citizens as well as organizations, meaning being present where everybody is, whereas, with a website, your presence in the internet is reduced to the people that look for your website. Therefore, we aim at doing a study of these various phenomena, and at the end, offer an alternative to the struggling media organizations affected by Social Media.
3
2 L
ITERATURER
EVIEW2.1 SOCIAL MEDIA-BASIC DEFINITIONS AND ORIGINS
Being a relatively young phenomenon, Social Media only entered our lives in the first years of the 21st century, meaning, there is not more than a decade of information and evolution regarding the subjects we are talking about.
During our research the simple task of defining Social Media (VAN DIJCK & POELL, 2013) became harder than we thought at the beginning. However there are some points that are transversal to all Social Media platforms, as demonstrated by Obar and Wildman (2015). The commonalities in current Social Media are:
- Social Media are interactive Web 2.0 Internet-based applications.
- User-generated content, such as text posts or comments (HILLE & BAKKER, 2014), digital photos or videos, and data generated through all online interactions, are the lifeblood of Social Media.
- Users create service-specific profiles for the website or app that are designed and maintained by the Social Media organization.
- Social Media facilitate the development of online social networks by connecting a user's profile with those of other individuals or groups.
To better explain these concepts let us delve on them. The Web 2.0 (O´REILLY, 2009) refers to the second stage of development of the internet, when it surpasses the static stage and becomes more user dynamic and user generated, mainly from the success of Social Media. This new form of interaction between users (whether from personal or institutional profiles), made the contact between people and organisations much closer and faster (SCIFLEET et al, 2013). The closer and faster these relations became, the more they grew worldwide, as the recent numbers show. The opening of the Soviet Bloc in Eastern Europe, the Democratization of South America and the development of Southern Asia countries transformed the world we live in, as a more connected, compact place.
Another very important factor we need to acknowledge is, as we mentioned before, the acceleration of the technology nowadays. However, we did not mentioned a very important point, its accessibility. Smartphones in current days allow its user to do almost all the same
4 things as a laptop or computer, but with a very different feature, the price. When we mentioned the democratization of technology, we were referring mainly to its affordability, whether through a piece of technology (laptops/computers or smartphones), or access to the internet2.
Graphic 2-1 – Number of smarphone users worldwide from 2014 - 2020 (Source: eMarketer)
The statistics relating to this subject all point in the same direction, an exponentially growth in all numbers (numbers from the ITU in Excel page by the ITU).
These directly relates to Social Media, as more people have access to technology and to the internet, more Social Media users there will be, and more of a tool it will become to the organizations (KUMAR et al, 2016).
2.2 STATUS QUO
Almost reaching the end of the 2nd decade of the 21st century, and including all the factors aforementioned, we should be able to reach a certain photography of the worldwide status, and later on, of Portugal, when it comes to the usage and influence of this particular technology
5 and why it is important to the subject at hand, its relation to News Media, in particular, Print Media.
As we said before, the exponential growth of technology and access to the internet, has a reflection on the usage of Social Media. Recent numbers appoint that almost half the world has access to the internet. Has said in this ITU3 report there is a difference, which should be taken into account, between the developed and the developing regions of the world. Nevertheless the number of worldwide households with access to the internet, as of 2016, was 52.3%, worldwide. In 2005, twelve years ago, that number was 18.4%, again worldwide, an increase of 33% in the developing countries and of 39% in the develop world. This is a significant change for just 12 years. Now that we have consolidate the connected and internet-based world we live in, we have to look to the data regarding Social Media, one of the main focus of this work. The most recent numbers direct us to the same point we previously expressed, exponential growth.
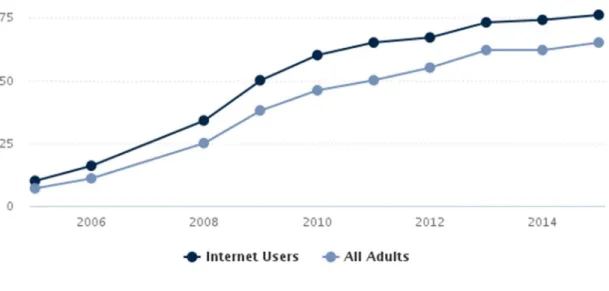
Graphic 2-2 – American internet-users who use at least one social networking site. (Source: Pew Research Center surveys, 2005-2006, 2008-2015. No data are available for 2007.)
6 This image came to us by the research done by the Pew Research Institute, from 2005 to 2015, (PERRIN, 2015) regarding Social Media alone, but, as we can see there is a clear correlation between being an internet user and a Social Media user.
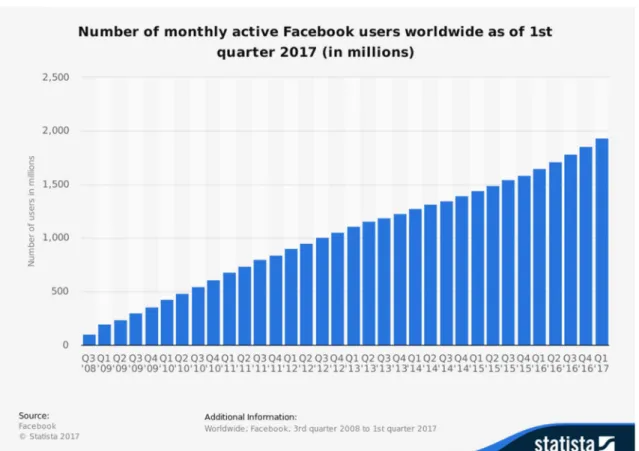
Graphic 2-3 – Number of monthly active Facebook users worldwide as of 1st quarter 2017.
(Source: Facebook Statista.)
This specific graphic only refers to the Social Networking site Facebook, the most used around the world. The current number according to the own Facebook is around 1.968 billion active users. This is not a light number when in context with the total world population, which is around 7 billion. Meaning more than 20% of the world is present in one single Social Media site. Although, there are certain countries where Facebook is not allowed, in those countries, like China for instance, where other Social Media sites were created like QQ, WeChat, Sina Weibo, Baidu Tieba, amongst others. This to say that Facebook might be the one with more users for the last years and currently, but, Social Media sites are made for people and organizations to interact and communicate, and so there are various, accordingly to different types of people and organizations and which they find more suited for them.
7 In the next image, we exemplified through numbers, the power of reach that Social Media has nowadays. That influence and power of reaching millions within seconds has something that organizations working in the news media were not prepared for in such a short period of time (GIL DE ZÚÑIGA et al, 2012 and HOWARD & PARKS, 2012). That does not mean that Social Media is necessarily a threat (GEHL, 2014), but we will discuss that better in a latter part of our work (REEVES, 2017).
8
Graphic 2-4 – Leading social network in April 2017, by number of users. (Source: Facebook Statista.)
9 Now that we demonstrated the reach (PFEFFER et al, 2014) and growth of Social Media on a worldwide level, we advance to the next stage, taking a closer look at our internal data, Portugal.
2.3 THE PORTUGUESE CASE
After an analysis on a worldwide level, we now have to focus our attention on national scale, more specifically, Portugal.
Graphic 2-5 – Households with computer/internet access and broadband access 2002 - 2016. (Sources: INE; Pordata.)
As we stated before, the Social Media phenomenon is not possible without access to the internet. In this specific case, Portugal has some factors that definitely helped in the spreading of this access throughout a majority of the population. As seen on the graphic above, the numbers of households with computers at home, internet access and internet access with a broadband connection4, over the last 10/12 years has become more and more convergent. So much that all three variables are today above 70% of the households. That means that, of the
10 around 10 million people currently living in Portugal, very probably, more than 7 million people have access to all three variables cited.
To add to these factors, others contribute to today’s status in the access to the internet. Since the beginning of the century, there was a big investment in the infrastructures that allow today a good internet access all throughout the entire country. At first, public investment with the old PORTUGAL TELECOM, and more recently private investment with NOS and VODAFONE. These three companies, together with the recently refurbished NOWO5, allows the small Portuguese market to have a good rivalry, which is reflected in the prices that the consumers pay. This is especially relevant since these companies introduced in the market the Three Play and later the Four Play. These services where a single company provides the TV subscription, the internet access and landline service (although through the Voip system), and later the mobile service for cell phones/smartphones, while at first was not available everywhere and the prices were not affordable for everyone, the truth is the technological advances together with a small market with three major players, allowed for the majority of the consumers to afford these services. Proof of that resides in the numbers of the graphic above. But not only. As we said technological advances also played an important role in this equation. And that materializes not only in the prices of internet service providers but also in the products available do most people. In this specific case, we are referring to smartphones, mainly because the price of laptops hasn’t drop so drastically. That caused an increase in the smartphone market, and a drop in prices of services associated with it, as showed next.
Graphic 2-6 – Average price (in Euros) of mobile service in Portugal 2010 – 2016. (Source: ANACOM.)
11
Graphic 2-7 – Percentage of people using smartphone versus feature phone 2013 – 2016. (Source: Marktest, Barómetro de Telecomunicações.)
So, as proven by these previous graphics, the access to the internet has become cheaper, and the amount of smartphones in the markets as practically doubled in 3 years. These numbers serve a purpose we have been referring, meaning, access to internet covers a vast percentage of the population, and the means to access it as well, whether is by computer or smartphone. We emphasize the popularity and accessibility of smartphones, because, as we will talk later, it has become an important factor in the way we use Social Media and the way we maintain ourselves informed.
12
Table 2-1 – Adults using the internet in 2016, by type of equipment, in Portugal. (Source: INE/Survey on ICT Usage in Households and by Individuals, 2016.)
Persons aged between 16 and 74 years old using the internet in the 3 months prior to the interview, by equipment used to access the internet, Portugal
Year 2016 Unit: %
Equipments
Desktop computer 46,0
Tablet computer 43,5
Portable computer 73,0
Mobile phone or smartphone 78,3
Other portable devices 6,6
Smart TV 9,4
Note:
Universe: Persons aged between 16 and 74 years old, living in the national territory that have used the internet in the 3 months prior to the interview. Font:
INE/Survey on ICT Usage in Households and by Individuals, 2016
To better understand today’s relationship of the people with the internet and how they use it, we recurred to a study done by the national bureau of statistics (in Portuguese, the Instituto Nacional de Estatística) integrated in a European study, by the Eurostat (the European bureau), that gives us a better view of this relation.
As hinted before, and as we can see in the graphic above, Smartphones have gained a huge importance in recent years. So much that they are already the equipment most used in accessing the internet. Followed closely by portable computers, that are a majority in today’s market for computers.
13
Table 2-2 – Adults using the internet in 2016, by type of portable devices, in Portugal. (Source: INE/Survey on ICT Usage in Households and by Individuals, 2016.)
Persons aged between 16 and 74 years old using the internet on portable equipment away from and work in the 3 months prior to the interview, by type of equipment, Portugal
Year: 2016 Unit: % Portable equipment 72,0 Portable computer 42,3 Pocket equipment 67,7 Mobile or smartphone 67,7
Other pocket equipment (e.g.: pocket computer, portable games console,
digital audio player or e-book reader) 1,6
Notes:
Universe: Persons aged between 16 and 74 years old, living in the national territory that used
the internet in the 3 months prior to the interview.
Portable equipment includes: portable computer, mobile phone or other handheld equipment such as handheld computer, portable game console, digital audio player or e-book reader.
Handheld equipment includes: mobile phone or other handheld equipment such as handheld computer, portable game console, digital audio
player or e-book reader.
Font:
INE/Survey on ICT Usage in Households and by Individuals, 2016
Not only that, and this is a different point from the ones we mentioned before, a question was asked in the survey relating to the use of the internet away from a work environment. This is of special importance because it refers to people’s private life, tastes, hobbies, etc. The relevance of this question is easily understandable, mainly because a lot of jobs demand working online. If the majority of people keep online after work hours, and at the same percentages as mentioned before, this only underlines the will from a majority of the populace to stay connected, wherever they are. Hence, again, the highlights on smartphones and other portable devices.
14
Table 2-3 – Internet users that engage in Social Media in Portugal and EU-28, 2011-2016. (Source EUROSTAT/INE)
But now, for a more relevant surprise, and just to start analysing this phenomenon, we have the table above. This is of relevance, not only for what it shows regarding Portuguese data, but also for the comparison with the European Union medium. Now this might not come as a surprise but, on all the other questions in the study, the Portuguese numbers were always below the Union’s medium numbers. This regards households with broadband connections, citizens aged between 16 and 74 who have ever use the internet, people who use internet connections away from home and work, amid other relevant data.
However, there was one point where Portuguese numbers were higher than the Europeans medium, and that one is shown above, using the internet to access social networks.
From that we can conclude, in this blessed by the sea country, the relevance and attractiveness of Social Media is higher than the European Medium, which demonstrates its importance to an audience that, for all accounts, is below the continental medium in all other factors.
Persons aged between 16 and 74 years old using the internet to participate in social networks in the 3 months prior to the interview,
Portugal and EU-28, 2011-2016
Unit: % 2011 2013 2014 2015 2016 Portugal 57 70 72 70 74 EU-28 53 57 58 63 x Notes:
Universe: Persons aged between 16 and 74 years old, living in the national territory that have used the internet in the 3 months prior to the interview.
x - data not available
Fonts:
EUROSTAT - Survey on ICT Usage in Households and by Individuals (accessed at 09/11/2016).
15
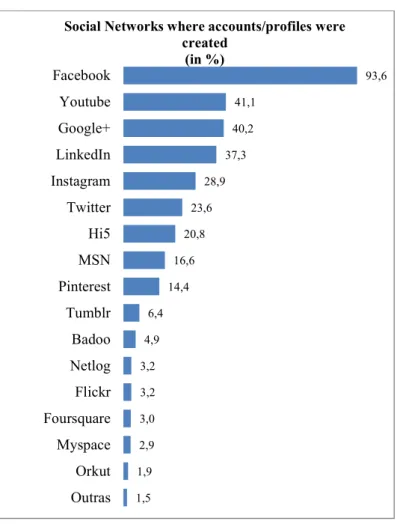
Graphic 2-8 – Social networks where accounts/profiles were created (%) 2016. (Source: MARKTEST – Portuguese people and Social Media.)
However this is only a statistical study, not a more profound survey to the success of Social Media in Portugal. We considered doing it, when we were granted access to a survey done by the competent and recognized company, MARKTEST, with the name “Portuguese people and Social Media 2016”6.
The data, that we so humbly appreciate, helped us to better understand the details of this relation, and, of course, analyse its entanglements with traditional media outlets.
This professionally done survey gave us the inside knowledge we needed to connect the two poles that construct this dissertation.
In this graphic representation we have the confirmation of the global numbers we mentioned above, with Facebook clearly in the lead and the remaining Social Networks with small distances within each other.
6 See Annex A.II – Markest - “Portuguese People and Social Media 2015”
93,6 41,1 40,2 37,3 28,9 23,6 20,8 16,6 14,4 6,4 4,9 3,2 3,2 3,0 2,9 1,9 1,5 Facebook Youtube Google+ LinkedIn Instagram Twitter Hi5 MSN Pinterest Tumblr Badoo Netlog Flickr Foursquare Myspace Orkut Outras
Social Networks where accounts/profiles were created
16 This was an expected reality, given the worldwide reality described previously, Portugal, as a western nation and a European country, would be hard for it to have numbers so antagonistic to the worldwide and European realities.
That being said we should, now, focus on other more relevant insides.
When asked about the functionalities more used in Social Media in fourth place appears the answer we were hoping for, reading news in information websites. We should mention that this fourth place come after, sending/receiving messages, watching videos, commenting on friends’ publications and using the chat service. In this specific point, reading news in information/media websites, the amount of people that answered affirmatively was 61.5%. More than that, as important difference between men (53.7%) and women (69.4%), a relatively small difference between ages, with more young people (BOLTON et al, 2013) using it and less old people using it, but that was as expected. The differences regarding location and social economic status were minor and not very relevant.
Other very specific and important point to our research, was the total of people who use it to share links to newspaper and magazine articles or surveys. That number was almost half (46.8%) of the interviewed, reaching 51% when it comes to women.
This is of major significance, because we now have an independently done scientific survey that gives us positive answers relating to the two interconnecting themes we are writing about. Given the percentages we just talked about, we can say that practically 2/3 of the Social Media users use it to read news, and about half of them use it also to share them with their friends or followers online.
Another relevant issue, that we have been highlighting, is the equipment used to access Social Media sites, and, as mentioned before, Portugal does not distinguish itself from the majority of developed countries. So, as is shown below, the great majority of people (61% and 58%) use portable devices whether computers or smartphones, but, as is expected, the smartphones take the lead. This only reinforces the idea that our current world is on-the-go and the increasingly great power that our pocket devices have allow us to do almost all major online activities, personal or professional. Reading news and interacting via Social Media is just one of those activities.
17
Graphic 2-9 – Access to Social Media sites by type of equipment in Portugal 2016 - Total (%)
(Source: MARKTEST – Portuguese people and Social Media.)
Continuing on our trip to better comprehend the relation between the Portuguese people and Social Media, other data is relevant to us. Although only a third (27.2%), mentioned “To keep myself informed” as one of the reasons why they chose do go to a Social Media site, more than two thirds of the (68.5%) are “fans” or “like” companies or brands (KIETZMANN et al, 2011). But, more pertinent than that is that within that universe, practically half (48.6%) are “fans” or “like” or “follow” news media outlets. In that way, we can retain that although being informed is not one of the main reasons why people start using Social Media, half of them eventually use it as a way to connect with news media outlets.
In a sentence, people still want to be informed and, more than that, they don’t mind at all, to be the ones that spread the content/information. The news business is not a dead business, but the world changed, and with it the way in which the distribution of some goods and services to the public, and, in my view, the news business in one of them.
61,7
58,1
36,5
24,1
2,6
Smartphone Portable computer Desktop iPad or Tablet iPod touch
Access to Social Media sites by type of equipment in Portugal 2016
18 2.4 PRINT MEDIA -BASIC DEFINITIONS AND CONCEPTS
Print Media. The backbone of society’s information and culture over the last centuries. The invention and consequent technological evolution that allowed a vast majority of the populations in western countries to keep themselves informed and gave a strong contribution to the process of strengthening these countries democracies.
The more direct definition is the one that tell us that we are talking about the “means of mass communication in the form of printed publications, such as newspapers and magazines”7. However, we should also mention what media is in a more global view, and that can be defined as the “system and organizations of communication through which the information is spread to a large number of people”8.
It is not possible to talk about Print Media without mentioning all the process that brought us to the level of Print Media that we have today. And the decisive moment is easy to point out in history. Though the earliest printing forms are from the Orient, namely China in approximately 200 AD, regarding woodblock printing and later in 1040 AD a movable type printing, the greatest development in the printing process is the well-known mechanical movable type of printing, by Johannes Gutenberg, around 1439. His developments also included oil-based ink for printing books, adjustable molds, and others9 (EISENSTEIN, 1980). This was the moment when the printing process started to became more practical and accessible, thus paving the way for more printing, as in books and newspapers and magazines. Obviously, there has been a lot more moments in technological development throughout history that contributed immensely to the Print Media evolution, but this was the “creation of fire” moment for this industry.
Of course other technological developments played crucial roles in this industry, such as printing metal presses, the computer and new ways of printing with ink and laser. We should also mention the appearance of photography in the late 1800’s, and consequent evolutions, an emergence that also change the print news industry. We just wanted do to an historical introduction.
7https://en.oxforddictionaries.com/definition/print_media
8https://www.merriam-webster.com/dictionary/media
19 2.5 STATUS QUO
The Print Media in the beginning of this 21st century is full of challenges, hence, why we chose it as part of our theme for this dissertation (KARIMI & WALTER, 2016; PICARD, 2014; MITHELL & HOLCOMB, 2016). Challenges that put in jeopardy some of the players in this industry, but that do not diminished the relevance or crave that people have for news in minute by minute changing world (JU et al, 2014 and FRANKLIN, 2014).
Most of these challenges have to do with technological developments (EVANS & WURSTER, 1997) and the internet connected world we live in, and because of this fast pacing world the answers to those challenges need to be as fast as possible (GAVRILIU, 2012; HARPER, 2010). The print news media has been affected by all that we just said and the references we made in the previous part of our work for the last 20 years or so. Newsrooms and News companies are constantly changing, as is the world around us (GARCÍA-AVILÉS et al, 2014; SOUTHERN, 2017, MARCH 8; MOSES, 2017). Curiously enough, newspapers and magazines have been on the tip of the arrow when it comes to trying to maintain their business by all means. Part of that process has been made by a trial error approach. And there is nothing wrong with that. To be able to do that an organization needs to be as agile and lean as possible.
However, an underlying strategy is needed and a more fast response to the challenges coming our way. But not all are bad news. Circulation worldwide has actually increased in recent years. But as print circulation has increased, digital has increased even more. For now let us analyse the global circulation market between 2011 and 2015.
Graphic 2-10 – Global circulation market between 2011 and 2015.
20 As we said, contrary to popular sayings that Print Media is dying, as can be seen by this graphic, the numbers show other view. So, what is the challenge?
Graphic 2-11 – Global newspaper revenues.
(Source: WPT Analysis, E&Y, Zenith Optimedia, PwC Global Entertainment and Media Outlook: 2016-2020.)
Advertising. Advertising composes the biggest chunk in Print Media revenues. This is not brand new information. However, what we should mention is that advertising is still very important, so why is it shrinking its position in Print Media? Because it is relocating. Brands know that through digital advertising can reach more people and the cost is significant lower than print advertising. Regarding digital, is very difficult to obtain worldwide numbers. However, here is an example:
21
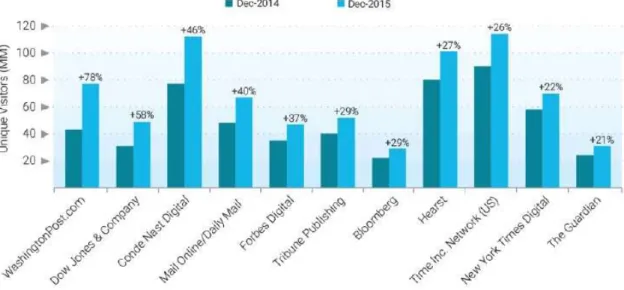
Graphic 2-12 – US digital audience growth of selected traditional print publishers. (Source: comScore Media Metrix Multi-Platform, U.S., Dec 2015/Dec 2014.)
This is an example from the US market alone, so one might say that it does not apply to the rest of the world. Nevertheless, and again without proper raw numbers, the reality in Europe is similar if we consider the reach of news and information websites.
22
Graphic 2-13 – Reach of news/information websites in European countries March 2013. (Source: comScore Statista 2015.)
In this graphic, we have that reach. So, with that information we can infer the growth of digital audiences is global.
So, if we know that newspaper companies are making less money (SJØVAAG & KRUMSVIK, 2017), from advertising at least, but worldwide numbers show an increase in circulation how these two realities fit together?
They fit with less organizations working in the news business, various ones that made the jump to digital only, some that started charging audiences of their digital content through paywalls or subscriptions, amongst other decisions and tools used (GOODFELLOW, 2017).
2.6 THE PORTUGUESE CASE
The last sentence in the previous point, is also true for the Portuguese reality. However, being our reality, we watched the business changing and the adjustments these organizations made, or not, and if they were successful.
23 Firstly, we now have much less publications than we had before. That is easily observable from the data we gathered from the Portuguese Printing and Circulation Association (APCT)10. Although not all the publications are associated, the big majority is (there is one or two exceptions, like the daily sports journal “A Bola”) and that being the case it provides us with a clear image of the number of publications and correspondent circulation.
The data we studied focused on the last 10 years, between 2006 and 2016. There are various types of publications between the typical newspaper with the news of the day or the week, the sports newspaper, the weekly magazine with general information and special reports, and other more specialized publications, such as finance/economy newspapers and magazines, technology magazines, motor related publications, health and lifestyle, kid’s comics, local newspapers amongst other specific publications. The more specific publication growth in this decade was, without a doubt, technology related publications with lifestyle and health not far behind.
Graphic 2-14 – Number of total publications in Portugal since 2006 until 2016. (Source: APCT.) 10 http://www.apct.pt/Analise_simples.php 0 50 100 150 200 250 2006 2007 2008 2009 2010 2011 2012 2013 2014 2015 2016
24 When it comes to the number of publications, the data gathered sends a clear message which is decline.
Without discriminating amid types of publications, there is serious decline over the last decade. In 2006, there were 230 publications in the Portuguese market while a decade after that number is much smaller, 101. The data does not lie, we are in front of a drop to less than half the publications in just 10 years.
We remind that this data includes all publications, and the majority of them are part of a larger media group, and although the decision to stop publishing might come for other reasons, there is no escape in affirming that simply the success of Print Media is in a decline. We should mention that some of the publications have decided to translate to a digital only type of media. Maintaining a website is obviously much cheaper than a paper edition and allows more freedom in the way they work. The most recent example is the “Diário Económico”, an Economy specialized newspaper published since 1989, which also had a cable TV channel, that closed doors in 201611 and is now reduced to a website12 and a weekly printed edition.
There is also another fact that cannot be forgotten, the crisis. After asking for a bail out to the international institutions in 2011, what followed was a deep cut in the purchase power of the majority of the country and its industrial complex, including media companies. That is why such a deep decline can be seen in the graphic after that year. A struggling industry hit with a crisis had its consequences.
On a more focused look, regarding the most general type of publication, the daily or weekly newspaper, that diffuses various subjects, the perspective is not that different.
11https://ecpmf.eu/news/threats/archive/portuguese-dirio-econmico-ceases-print-edition
25
Graphic 2-15 – Number of publications of general information between 2006 and 2016. (Source: APCT.)
While the drop in the last decade is not as profound as with the company of the other types of publications, if we see the maximum (29) and the minimum (14), we cannot escape the conclusion that we are also in front of a decline to half the numbers, from only a few years ago. Also of mention, the drop after the year 2011, that as explained before, started a difficult time for the country, its people and its companies.
On a more specific note, Portugal being a relatively small country and consequently a small market, by any view you apply, the number of publications and consequently the organizations that own them tend do decrease. In Graphic 2-15 we have the general information periodicals in Portugal. Correio da Manhã, Sábado and Destak all belong to Cofina, one the media players in Portugal. Diário de Notícias, Jornal de Notícias belongs to Global Media Group. Expresso, Visão and Courrier Internacional to Impresa. Sol and I Informação (not in the table from APCT, for reasons unknown) belong to NewsHold, with capital from Angola and other countries that was recently in some scandals and put the publications in some trouble. It recently was acquired by Newsplex, a company that emerged from the directors of the newspapers. Leaving us with a few outsiders. Selecções do Reader´s Digest is an international publication and Público belongs do SONAE SGPS a company dedicated to other types of business but with interests in every form of business. In reality it acts more as a sponsorship or as a patronage. The same thing is visible in the digital native Observador. This is not a sustainable business model.
0 5 10 15 20 25 30 35 2006 2007 2008 2009 2010 2011 2012 2013 2014 2015 2016 Number of publications of General Information 2006-2016
26 Regarding the other major players, Correio da Manhã, the biggest and most successful newspaper in Portugal, maybe with the slight exception of Expresso, belongs to COFINA group, a media group more focused on the tabloid type13. This group is also the owner of weekly magazine Sábado and the free distributed Destak. More recently they also invest in a cable channel called CMTV, short for Correio da Manhã TV.
From player to player we reach Global Media Group that has two general information newspapers, Jornal de Notícias and Diário de Notícias, one of the oldest newspapers in Portugal. As other assets of the group, there’s a sport newspaper, O Jogo, the radio TSF, and dedicated magazines as Volta ao Mundo and Evasoes.
The Impresa group, probably the largest group has the weekly newspaper Expresso, the weekly magazine Visão and the Courrier Internacional, as well as other dedicated publications as Exame and Blitz.
2.7 PHOTOGRAPH OF THE REALITY
It is not easy to grasp the reality of these organizations for various reasons. Firstly, and in connection to our study, we are talking about organizations that rarely dedicate themselves solely to Print Media. In the description we made above of the main players in this industry the only one that fits that category would be that company that owns Sol and I Informacao. To understand this reality, we decided to conduct interviews to better know how these organizations work, how they keep afloat financially, amongst other themes. We interviewed the Director of Information of the Impresa Group, Mr. Ricardo Costa, the publisher of the digital native Observador, and former Director of Expresso and Público, Mr. José Manuel Fernandes and former Público journalist and current columnist and commentator Mr. Luís Pedro Nunes. Between them we are talking about roughly 70 years in experience in this area. Those contributions were immensely valuable in the work we have done.
The main points regarding the industry’s current status were transversal while talking to these three gentleman.
The main points were,
27 The duopoly composed by Facebook and Google creates a difficult environment for
media companies in general and specifically for Print Media in their digital fronts. Something that a lot of companies worldwide are already trying to combat, including in Portugal, (SOUTHERN, 2017, March 2)
The complete disappearance or, at least, a great downsize in advertising from two major players in the national market, Banco Espírito Santo and Portugal Telecom. These were two of the biggest companies in Portugal that were hit hard by the
Financial Crisis and other corruption scandals that severely damaged their power and reach.
The introduction from Facebook of its Instant Articles and from Google, the AMP threaten the publishing world, although it can be seen as an opportunity as well. Concluding, the media outlets need to diversify as vastly as possible, given the huge dependence from Social Media and Google. As an example, Mr. Costa told us that 70% of the readers of SIC NOTÍCIAS online come from Facebook. If another 20%, conservative thinking, come from Google, we are talking about 90% or more that come from two digital platforms alone.
Beside relevant “inside information”, we decided to take a look at a more cold information, numbers. We already talked how the number of players has decrease over the years, but we should take a closer look to the circulation and on a broader view, financial numbers of these companies. Although the two biggest companies, Cofina and Impresa, have other ventures in their organization some of the numbers are relevant to us. They are open commercial companies, meaning that they are present in the stock market, and therefore, the financial results speak of the company as a whole and not the publications specifically. In conclusion, these numbers give us only a glimpse and, in the other cases, where we did not have access to the numbers, not even a glimpse.
Regarding circulation numbers what we did was analyse the numbers provided by the APCT. Those numbers are published on a bimonthly rate and reveal the printing and circulation numbers of almost all publications. We decided to focus on the circulation numbers, thus to get a better grip on the recent and current status of the publications. To do that, we separated
28 the data from the last ten years of the main general information publications and we did an average circulation calculation year by year to reach some conclusion of the last 10 years. We chose the main newspapers and magazines in the country that already existed ten years ago and still exist. Some publications disappeared in between our timeline of analysis. Therefore we did not considered them for this investigation.
Graphic 2-16 – Average circulation: Correio da Manhã 2006 - 2016. (Source: Calculated based on APCT data.)
The tabloid Correio da Manhã decreased a little comparing with the start of our evaluation, in 2006. In 20010/2011 it reached an average of 130 000 in circulation, but dropped to the recent numbers around 100 000 in circulation. As said by one of our interviewees, CM is a newspaper that depends heavily on revenues made by the sales of the newspaper itself. It’s presence on the web is very small and basic.
0 20000 40000 60000 80000 100000 120000 140000 2006 2007 2008 2009 2010 2011 2012 2013 2014 2015 2016 Average Circulation Correio da Manhã 2006 - 2016
29
Graphic 2-17 – Average circulation: Expresso 2006 - 2016. (Source: Calculated based on APCT data.)
Concerning Expresso the weekly big newspaper that comes with the general issue, the economy issue and the magazine is a different type of newspaper, comparable to the Sunday editions of the famous New York Times or the Guardian. With one special difference, those newspapers are daily ones. Expresso was always a weekly edition one. However, it made a big investment in recent years in digital content, providing a daily edition online, subscription based or a code based access. In circulation, Expresso was on a decline from 2006 to 2014, coming from 130 000 do 93 000, and making a recuperation in the last 2 years to values close to 100 000.
Graphic 2-18 – Average circulation: Diário de Notícias 2006 - 2016. (Source: Calculated based on APCT data.)
0 20000 40000 60000 80000 100000 120000 140000 2006 2007 2008 2009 2010 2011 2012 2013 2014 2015 2016 Average Circulation Expresso 2006 - 2016
0 5000 10000 15000 20000 25000 30000 35000 40000 45000 2006 2007 2008 2009 2010 2011 2012 2013 2014 2015 2016
30 The bad news comes after these two players. The oldest publication still in circulation, Diário de Notícias, suffered in the last ten years. The evolution has not been great in the last decade, in which DN reached less than half the circulation numbers it once had. It started the decade with more than 35 000, even reaching more than 40 000 in 2008. But the crisis in the last years, and possibly other factors, led to a downward spiral that translates to circulation numbers around 15 000. The digital part of the newspaper has been renewed and some might say that has a certain influence on the tabloid side.
Graphic 2-19 – Average circulation: Jornal de Notícias 2006 - 2016. (Source: Calculated based on APCT data.)
Staying in the same media group, Jornal de Notícias, a big player in the north of the country, also has been affected in the last decade. It started with values around 100 000 and after 2008 it started decreasing achieving in the last two years values above 55 000. Being part of the same group as DN, it also remodelled the digital content of the newspaper.
0 20000 40000 60000 80000 100000 120000 2006 2007 2008 2009 2010 2011 2012 2013 2014 2015 2016 Average Circulation Jornal de Notícias 2006 - 2016
31
Graphic 2-20 – Average circulation: Público 2006 - 2016. (Source: Calculated based on APCT data.)
When it comes to Público, a respected newspaper founded in 1989 by former Expresso Journalists and directors, the decline was not so deep. The decade started with numbers around 45 000, followed by a continuous decline until 2013 with 28 000 and then started a recuperation to the present around 30 000. Público, like other publications in other countries around Europe that we will mention later in our work, started publishing all its content online for free, only later recurring to the already mentioned “paywall”. Strategies aside, for a serious Newspaper, these are damaging number nonetheless.
Graphic 2-21 – Average circulation: Sol 2006 - 2016. (Source: Calculated based on APCT data.) 0 5000 10000 15000 20000 25000 30000 35000 40000 45000 50000 2006 2007 2008 2009 2010 2011 2012 2013 2014 2015 2016
Average Circulation Público 2006 - 2016
0 10000 20000 30000 40000 50000 60000 70000 80000 90000 2006 2007 2008 2009 2010 2011 2012 2013 2014 2015
32 On the other weekly newspaper, Sol, created to compete with Expresso, a great beginning quickly turned down. The first edition was sold out with almost 100 000 in circulation. In the following year dropped to half of that around 50 000 and in 2014 to half of that with 24 000 copies, and a reported loss of 4,4 million euros that year. The numbers of circulation in the year 2016 were not available at the APCT website and therefore for our analysis. Their online platform was, more recently, transferred to the more popular and one of the oldest in Portugal “sapo.pt”. As we mentioned before Sol and I Informação are part of the same company and therefore share resources, now more than ever. The numbers on I Informação were scarce in the APCT and consequently we did not included in our work.
Graphic 2-22 – Average circulation: Visão 2006 - 2016. (Source Calculated based on APCT data.)
Passing on to the magazines, we have the oldest, Visão, part of the Impresa Group, and Sábado, part of the Cofina Group. Concerning Visão it had a constant circulation above 100 000 copies until 2010, when it started do decline to the current around 70 000. We should mention that these are publications that often produce big journalistic pieces and other times dedicate themselves more to the lifestyle and current events topics.
0 20000 40000 60000 80000 100000 120000 2006 2007 2008 2009 2010 2011 2012 2013 2014 2015 2016 Average Circulation Visão 2006 - 2016
33
Graphic 2-23 – Average circulation: Sábado 2006 - 2016. ( Source: Calculated based on APCT data.)
On the other hand, Sábado, started a growing phase from 2006 to 2009 and from that moment forward a decline also manifest itself. The peak in 2009 was an 80 000 copies circulation and the current is around 45 000 copies, without the data of 2017 that might accentuate the fall, in this and in all other publications above, with the same tendency.
As we said before, we do not have access to most of the financial numbers of the organizations behind a majority of these publications. Nevertheless this examination of the past ten years, I believe, gives us a clear picture of the evolution of the success of these publications. The assessment we take from this small gathering of data shows a trend, a descending one in all major publications present in the country regarding general information. That is undeniable.
2.8 FINANCIAL NUMBERS AND GRAPHS
As we mentioned before, very few companies are publicly traded, which means the access to their financial reports is limited to those ones.
In our focused view, only two are relevant, Impresa and Cofina. Media capital is also publicly traded, however, their focus is on TV and Radio, not Print Media.
Following the same process, we decided to gather all the Financial Reports from these companies and focused on one special item, revenue. We should mention that both companies
0 10000 20000 30000 40000 50000 60000 70000 80000 90000 2006 2007 2008 2009 2010 2011 2012 2013 2014 2015 2016
34 have multiple revenue streams, especially Imprensa with their TV area, but that serves a purpose, to prove the transition of advertising (the main source of revenue) from traditional media to digital.
This is a brute gathering of data, mainly because around 2008/2009 the IFRS (International Financial Reporting Standards) were adopted in the EU, and therefore changed, although slightly, the way these companies reported their financial information. This to say that the way the information is reported was not the same throughout the 10 years period we focused and was not the same between companies. The IFRS are general Standards, not mandatory rules regarding the format of the Reports.
Nevertheless, we thought it was another good indication of the recent years’ status of these organizations and what we can conclude to improve.
Graphic 2-24 – Impresa’s revenues from Print Media 2006 - 2016. (Source: Annual Financial Reports of Impresa.)
Fortunately for us, the Impresa reports have well separated the forms of Revenue, and therefore making our work easier, and one more time, demonstrating what we have been mentioning regarding the transition from print to digital in the advertising business. Naturally this is total revenue including the price of the sales from the Print Media, but that would not be enough to cover the costs. Advertising is what keeps the balance straight on the spreadsheets, and in this specific case we are in front of decline of almost 50% after the crisis hit the country. That fact
0 20 000 000 40 000 000 60 000 000 80 000 000 100 000 000 120 000 000 2006 2007 2008 2009 2010 2011 2012 2013 2014 2015 2016 Revenue Impresa Print media in Euros 2006 - 2016
35 together with the digitalization of news explain these number and make us worry about the future.
Graphic 2-25 – Cofina’s revenues from Print Media 2006 - 2016. (Source: Annual Financial Reports of Cofina.)
Regarding Cofina, the analysis of the financial reports was slightly different because it was organized in a different way. Therefore we present two different graphs based on the information available. First the global revenues of the Cofina Group which of course include various items and different sources. Secondly, and more specific, the revenues from advertising. This was worth analyse because Print Media relies greatly on advertising as a revenue source. 0 20 000 000 40 000 000 60 000 000 80 000 000 100 000 000 120 000 000 140 000 000 160 000 000 2006 2007 2008 2009 2010 2011 2012 2013 2014 2015 2016 Revenues Cofina in Euros 2006 - 2016
36
Graphic 2-26 – Cofina’s revenues from advertising 2006 - 2016. (Source: Annual Financial Reports of Cofina.)
As is easily understandable both items under analysis are currently lower comparing to ten years ago. This is merely one of the factors adding to the ones we have been talking about, that have been damaging this sector. But a crucial one, given that without financial equilibrium, there isn´t an organization that can survive, at least at long term.
0 10 000 000 20 000 000 30 000 000 40 000 000 50 000 000 60 000 000 70 000 000 2006 2007 2008 2009 2010 2011 2012 2013 2014 2015 2016 Revenues Cofina from Advertising in Euros 2006 - 2016
37
3 M
ETHODOLOGYWhen it comes to an academic work like this one, a dissertation, certain methodologies must be applied.
First and foremost, what were the objectives when we started this research? Well, there were three main objectives/questions that defined the way we separated our work.
They were,
-What is today’s influence and reach of Social Media and its causes? -How is the Print Media business today? How has it been in recent years?
-What conclusions do we gather from relation between the previous two and what strategies can we offer to this industry?
To be able to answer these questions, we delved ourselves into different sources of information. First and foremost, academic papers and researchers’ results related to these topics as well as credible data from public and private statistical institutions, regulators and independent organizations that cover these areas.
Relating to Social Media, most of our information came from statistical bureaus, given that is accurate and reliable data that can paint a comprehensive picture of our current world and, more specifically, our country and industry.
When it comes to Print Media, although there is also a great deal of information in these bureaus, there was a need from more inside information. If the objective is to help this industry, we needed a deeper understanding of it. In that line of thought we decided to interview professionals of that area with decades of experience. The main reason to that is because there is where we could find a more accurate and experienced vision of how the industry evolved and what are the crucial determinants for its transformations, or lack thereof.
38
Table 3-1 – Summary of features of the interviews realized during research
Interviewee Date of the
Interview Duration Current Position
Mr. José Manuel Fernandes 29th of November of 2016 42 minutes and 41 seconds Publisher at Observador Mr. Luís Pedro Nunes 29th of November of 2016 51 minutes and 16 seconds Columnist at Expresso and LuxWoman; Editor at Inimigo Público; Associate at Produções Fictícias, SA
Mr. Ricardo Costa 242016 th of January of 1 hour and 3 minutes Director of Information at SIC
Aiming at possible new strategies, within the constraints of the data and information we gathered from all these sources, there relies the true research method, trying to answer these challenges.
39
4 S
TRATEGYP
LANP
ROPOSALAfter carefully and thoroughly analysing the two realities that bind us in the way to some conclusions as to what should be done in the Portuguese Print Media industry, we have to have, now, to reach those conclusions, with a look to the future. With the well based company of the two previous parts of this work, as well as, other important academic and industry related innovations and contributions.
4.1 PREVIOUS PARTS AND PATH TO STRATEGY
The main conclusions we gathered from our research in the previous parts of our work can by synthetized in simple and clear ways. Going straight to the point, technology has conquered a huge importance in our daily lives in the last years, with the speed of that conquest becoming faster and faster. Mobile devices in developed countries are now the number one point of access to the internet and consequently, Social Media (LELLA, 2016). This is important because of the part Social Media plays in consuming news via digital ways.
On another part, the Print Media business is not exactly thriving in Portugal, with publications closing year after year in recent times. The technological upgrade is only true for very few players, some still remaining without applications for mobile devices, or not even friendly to use on a traditional laptop. Some organizations saw the changes in the industry and tried to keep up, but always as a necessity and never of their own volition.
This industry, to be capable to survive in the modern world, has to be in constant connection with the technological updates. And the reason for that is simple, because that is the way the news is and will be consumed from now on.
Throughout the interviews conducted in the preparation for the writing of this thesis, some very experienced opinions were heard, as mentioned before. A very serious affirmation was locked in my mind, when Mr. Costa, Director of Information at the Imprensa Group, said to me that newspaper owners and other outlets would be remembered in the history of the management of corporations as the ones that decided to give for free the fruits of their labour expecting that the scale would be enough to continuing being successful. “I don’t believe in the free model” was the punchline, so to say. He was obviously mentioning the newspaper Público, and also gave the examples of the well-known spanish El Pais, as well as the world renowned english newspaper, The Guardian (JU et al, 2014; DE LISLE, 2016). We should make reference that
40 The Guardian is one of the most read newspapers in the world, and the El Pais, made significant changes to grow its reach and therefore its scale with specific editions in Latin America and Brazil.
These are three very close examples of organizations that decided to publish online the majority or totality of their contents for free. Not only the scale was not enough, all of them had to roll back on their decisions, having now a paywall, some kind of premium content or are asking for monetary contributions. Obviously, a costumer used to have it for free would have to be a very loyal one to starting to pay from one day to another.
Is not that the content does not deserve an economical value that should be pay. Is the change of strategy, specifically at a time that other outlets became available with the same quality for little or no cost.
On the other hand, there is other strategic approach that has been growing in recent years, the digitally native media outlet. The most common example is the Huffington Post, which started in the United States and is now present in more than 15 countries and regions around the globe with their own local departments. We are talking about a news outlet born in the World Wide Web, just twelve years ago, that now reaches half the world. And more important to our work, the fact that it was born without a print edition, does not implicate a lack of quality, already winning a Pulitzer, a prestigious award in the United States newspaper world, although recognized worldwide.
In the national atmosphere, the obvious example is the Observador. Also a digitally native media outlet, supported by private investors, but fairly more recent, with only 3 years in the market. This is a specifically interesting example because, although all the newspapers had a digital presence in many forms, the market was and is changing faster that they can keep up. And why is that? According to Mr. José Manuel Fernandes, current publisher of Observador and a professional with roughly 40 years of experience in various newspapers, the reason is that the typical professionals of newspapers saw the online edition as something they had to do, but not specifically something that should really be a focus for the newsroom.
In that sense, the project he leads, went the other way around and focused precisely in the digital environment, and more specifically in the mobile area, that 3 years ago was not as important as it is today. But that vision was the correct one, as the data shows, the mobile access is now number one in most of the developed countries when we are talking about reading news. As he told us, that proved successful, as the objectives Observador had for the first four years,
41 were concluded in the first two years. So there was a market for a digitally native media outlet in Portugal, and so much that the amount of different topics that are now available in the website and mobile application are so diverse that any given person could find something that would talk to them and inform them.
Regarding the business model and the revenues, Mr. Fernandes confirm us that the only source of revenue is the advertising and other related items as sponsored content, and when asked if it had conditions to work that way for years to come or if he was studying other ways of revenue, such as premium content or a paywall14, his response was a definitive “I don’t know. There are various models, but none of them succeeded so far, so for now we do not have a definitive business model. In the digital world that can change fast, and we will change if we have to.” Regarding the evolution of the Observador, it became one of the main mobile applications downloaded in the media environment, with numbers between fifty thousand and one hundred thousand installations from Google Play, the Android official store, and the most used mobile operating system in the world.
On another level, but also a good example for various reasons is the well-known New York Times, who just this year released a report on the “newsroom’s strategy and aspirations” (JOURNALISM THAT STANDS APART, 2017).
Not only we have found it extremely interesting as a strategic reading but it gave us a clear vision on how the NYT operates in this digital era. Immediately in the fourth paragraph there is a direct affirmation:
“We are, in the simplest terms, a subscription-first business. Our focus on subscribers sets us apart in crucial ways from many other media organizations. We are not trying to maximize clicks and sell low/margin advertising against them. We are not trying to win pageviews arms race. We believe that the more sound business strategy for The Times is to provide journalism so strong that several million people around the world are willing to pay for it. Of course, this strategy is also deeply in tune with our long time values. Our incentives point us toward journalistic excellence.”
Just this paragraph tell us how much this organization has its business model well-oiled and working. Not because of a single phrase but because the numbers actually demonstrate that. But more than that, the continuous effort no keep doing what they do best, good and solid