Energy consumption and energy efficiency measures in the Portuguese food
processing industry
Diogo Morais
1, Pedro D. Gaspar
1,2, Pedro D. Silva
1,2, Luís P. Andrade
3, 4and José Nunes
31: University of Beira Interior, Engineering Faculty, Dept. of Electromechanical Engineering,
Covilhã, 6201-001, Portugal
e-mail: [email protected], [email protected], web: http://www.ubi.pt
2: C-MAST - Centre for Aerospace Science and Technologies, Covilhã, Portugal
3: School of Agriculture, Polytechnic Institute of Castelo Branco, Qt.ª Sr.ª Mércules, 6001-909
Castelo Branco, Portugal
4: CATAA – Zona Industrial de Castelo Branco, Rua A, Castelo Branco, Portugal.
Abstract: In the present study, simple energy surveys and audits were performed in 60 companies of
the processing industry of meat, dairy, horticultural and bread and pastry products. 20 of the
companies analyzed were located in the North region, 21 in the center region and 19 in the Alentejo
region. The number of refrigeration chambers, the building infrastructure and the energy
consumptions of the equipment used in the manufacturing processes were evaluated. This study
allows to compare the energy consumption of the different manufacturing processes of regional food
products. The aim of the study is to present several measures and best practices aimed for the
improvement of the energy efficiency of the food sector as all. The implementation of simple and very
cost-effective transversal electricity savings measures such as awareness and/or training of
operators, proper maintenance and monitoring tasks, can benefit the sector. The tailored energy
efficiency measures by sector are discussed. These energy efficient practice measures can offer
savings on several levels, which may increase productivity and competitiveness and improve the
environmental impact, and thus the global sustainability of the Portuguese food sector.
Keywords:
energy, surveys, meat, dairy, horticultural, bread and pastry, consumptions, efficiency.
1.
INTRODUCTIONBecause of economic development, there is an increase in energy consumption, largely from fossil sources. Given the origin of these natural resources and the environmental impact associated with their production and consumption, they made humanity realize that a change is needed. Far from finding a solution for excessive energy consumption, we must then think in the short term, for example, adopting alternative sources of clean energies and, simultaneously, promoting energy efficiency policies.
Faced with an exponential increase in the world population, it will be mainly the agri-food and energy sectors that will be responsible for meeting market needs. This response will be given, avoiding the emission of greenhouse gas, from the additional demand of energy and food.
According to the FIPA (Federation of Portuguese Agri-Food Industries) website, the agri-food industry is considered the largest Portuguese industry, due to its turnover, which in 2010 amounted to 14,000 million euros.
Table 1: Evolution of Agri-Food sector between 2005 and 2010.
2005 2006 2007 2008 2009 2010 Business volume (millions of euros) 11,588 12,044 13,835 15,181 13,992 14,062 Gross value added (millions of euros) 2477 2467 2724 2822 2875 2889
Number of companies 10,268 10,683 11,017 10,835 10,461 10,513 Number of employees 104,942 107,094 112,343 111,408 109,040 109,585 This paper is based on the study carried out in the project +AGRO - Project +AGRO: Organizational, Energy
and Occupational Health and Safety qualifications in the AgriFood Industry (Project 04/SIAC/2015 – SIAC
16159), with the aim of formulating a study to characterize the productive process of SME in the agri-food sector in Portugal and, consequently, to qualify them for the adoption of strategies to increase their competitiveness. productivity and efficiency. Thus, relevant data were collected in 60 companies from North to Alentejo regions of the country.
2. ENERGY CONSUMPTION IN PORTUGAL
Compared with the 28EU's primary energy consumption, and based on data from 2014, Portugal is more dependent on oil, 43.4% from 34.4% of the European average, but on the other hand, it is less dependent on coal 12.8 % and presents a higher energy supply from renewable sources 26.2% compared to the average of 12.6%.
Based on figure 1, the final energy consumption in Portugal was approximately 15,000 ktoe, and its breakdown by sector remains practically unchanged over time.
Figure 1: Final energy consumption by activity sector [Source: INE]. 3. ENERGY EFFICIENCY
Efficient use of energy and its intensity of use are important issues that affect energy systems and define sustainability trends. An efficient use by final consumer is a way to reduce the amount of energy consumed, without compromising socio-economic development and thus translating into sustainable development. Energy efficiency is a key word in today's industry, playing a crucial role in market competitiveness, sustainability and environmental protection. According to estimates by the Food and Agriculture Organization of the United Nations, global food production will have to increase by 70% to sustain the world population expected to reach 9 billion by the year 2050. With this population increase, world energy demand will increase by a third between 2010-2035, making energy and water supply the key to any modern industry's success. 3.1. Energy efficiency policies in Portugal
The National Energy Strategy (ENE) was launched in April 2010 and the main objectives of this plan for 2020 are as follows:
• Dependency: to reduce the country's energy dependence on foreign energy to 74% (it was 83% in 2008) and reduce the energy import balance by 25% with energy produced from endogenous sources; • Renewables: 60% of the electricity produced and 31% of the final energy consumption originate from renewable sources; create another 100,000 jobs in addition to the 35,000 already existing (45,000 direct and 90,000 indirect) in the renewable energy sector; the impact on GDP will increase from 0.8% to 1.7% by 2020;
• Efficiency: 20% reduction of final energy consumption, in accordance with the Community's energy policy and the development of an industrial cluster linked to the promotion of energy efficiency, ensuring the creation of 21,000 energy-efficient, generating a predictable investment of 13,000 million euros by 2020 and providing exports equivalent to 400 million euros;
• Environment: Compliance with the emission reduction targets assumed by Portugal within the European framework. ENE 2020 aims to implement a series of measures and strategies using five major vectors: competitiveness, growth and energy and financial independence; commitment to renewable energies; promotion of energy efficiency; ensure security of energy supply; economic and environmental sustainability. 0 5000 10000 15000 20000 2011 2012 2013 2014 2015 Fin al en er g y co n su m p tio n [k to e] Year
Construction and Public Works Services
Industries Transportation Agriculture and Fish
4. ENERGY EFFICIENCY INDICATORS
The primary objective of energy indicators in industry is to obtain an understanding of the major techno-economic influences on the total final energy consumption industry and in individual industrial subsectors or branches. The analysis of energy indicators should also help to relate energy consumption changes to energy efficiency policies or environmental policies, energy price changes, changes in the foreign trade of energy-intensive intermediate or final products and structural impacts due to business cycles to tailor instruments to improve energy efficiency more satisfactorily. The energy intensity is strongly related to the type of industries and their level of technological development, translating into an economic index of energy efficiency.
The other economic index is the Specific Energy Consumption (SEC), which is the quotient of the total energy consumption and the quantity of final products, in which differences in the production process and type of equipment used between companies can mean big differences.
According to Phylipsen et al. (1997), the energy consumption in the industrial sector is determined by the level of activity, structure of the sector and energy efficiency. The changes in energy consumption of industries are not exclusively related to improvements in energy efficiency in industrial processes, but also related to several other factors: political, economic and environmental. Such factors may determine that the industry of one country appears to be more energy intensive than in another, although the difference may be essentially based on structural differences. These indicators have already determined in other studies, such as Neves et al. (2014); Gaspar et al. (2014); Nunes et al. (2014a, 2014b, 2015, 2016) and Silva et al. (2014, 2016).
For practical use of these indicators it is necessary to simplify the presentation by constructing appropriate aggregates for most structural effects. Structural changes, the effects of international trade and permanent changes in energy consumption are mainly driven by improvements in efficiency. Such improvements can be explained mainly by various technological changes, as well as influenced by other factors:
• Changes in technical efficiency;
• Replacement of technological processes;
• Changes in the manufacturing process used, (eg, dry-path wet-making ceramics or vice versa) that reduce the process energy consumption.
Thus, it is very relevant to establish indicators that express the variation in energy efficiency. In industry, the energy indicators normally used are specific energy consumption (SEC), energy intensity (EI) and carbon intensity (CI).
Specific Energy Consumption: calculated based on total annual energy consumption and annual production volume.
𝑆𝐸𝐶 = 𝐶
𝑃 [kgep/t] (1)
C - Total energy consumption [kgep/year]. P - Production [ton/year].
Energy Intensity: calculated based on the total annual energy consumption and the Gross Value Added of the company's activities.
𝐸𝐼 = 𝐶
𝐺𝑉𝐴 [kgep/€] (2)
C - Total energy consumption [kgep/year].
GVA - Gross value added of the activities of the company related to this industrial unit [€/year].
Carbon Intensity: calculated based on the total annual energy consumption and the amount of annual greenhouse gas emissions (GHG), in units of kg of CO2 equivalent.
𝐶𝐼 = 𝐾𝑔𝐶𝑂2
𝐶 [kgCO2/tep] (3)
C - Total energy consumption [kgep/year]. kg CO2 - Annual GHG emission [kgCO2e/year].
Within the scope of the Energy Consumption Rationalization Plan (PREn), an audit is carried out. Regarding the influence of energy efficiency indicators, Patterson (1996) highlighted the four most influential groups:
• Thermodynamics: based entirely on the science of thermodynamics that indicate the relationship between the actual and ideal process regarding the need for energy use;
• Physical-thermodynamic: consider the amount of energy required in thermodynamic units, but outputs (products) are expressed in physical units;
• Economic-thermodynamic: they have as reference the energy required in thermodynamic units, but the products are expressed in economic units (monetary values);
• Economic: both the energy required, and the products are expressed in economic quantities.
Energy indicators include some of the most important parameters in environmental assessment, such as greenhouse gas emissions, ozone depletion, depletion of natural resources, drought, noise, odor, etc. As such, energy indicators may reflect the environmental impact of energy consumption. The indicators enable simplified information to be made available to policymakers, enable improved energy efficiency policies and measures, and a long-term monitoring of the progress or impact of the initiatives taken.
5. METHODOLOGY
The present study is a summary of the main results of an activity of project +AGRO (www.maisagro.pt) (Gaspar et al., 2018). Companies were contacted to explain the objectives of the study and what was intended with their participation. After the first contact, it was necessary to visit all the facilities to present the project in a more dynamic and interactive way, allowing to know the dynamics of the company.
To carry out the initial information collection, a data collection model was developed that reflected the current characteristics of the company / industry.
Objectives: To carry out a general characterization and an energetic characterization of the companies under study.
Sample: The data collection model was applied to 60 agro-food companies from 4 different ranks.
Variables: The following variables were analyzed: Chamber volume, material used for insulation and flooring. Method of Collection: Personally, through meetings marked with the companies surveyed, and using appropriate equipment.
In order to maintain the privacy of the companies, a numerical codification was adopted and assigned to each company according to the sector of operation and the region.
5.1. Measurement of parameters
In the energy characterization component of each company, it was necessary the installation of energy analyzers in the electric boards, which allowed the acquisition of the necessary data for the elaboration of the study. For refrigeration and freezing equipment, the data collected concern the temperature and humidity inside the equipment. To obtain the data, the following equipment was used: Equipments for individual safety; Clamp meter; Multimeter; Power analyzers; Multicontacts; Infrared Distance Meter; Camera; Thermographic camera; Other general tools. Data were also required from companies, such as:
• Energy consumption (electricity, gas oil, natural gas, propane gas, firewood, naphtha, pellets, others); • Characteristics of tariffs and consumption of electricity;
• Infrastructures (location plan); • Features with heat generators;
• Disaggregation of the consumption of electric energy; • Characteristics of cold rooms;
• Cooling systems. 6. RESULTS
From the data collected in the companies, it was possible to start the analysis and interpretation of the data provided in the scope of the project. In terms of thermal energy production equipment, they were counted and identified according to their type and according to the fuel used for their operation.
It was possible to carry out an initial analysis of all the companies, dividing their consumption by energy source. Figure 2 shows the average annual consumption of companies in €/year.
Figure 2: Average energy consumption per energy source per company.
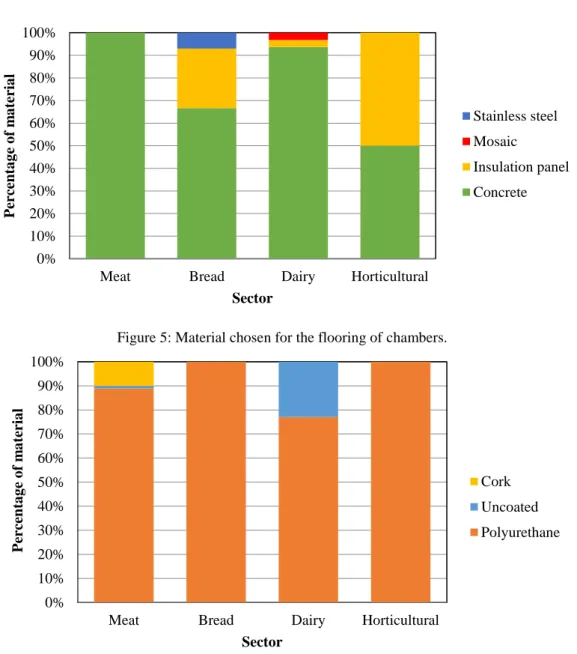
The volume, construction and insulation of the refrigeration and freezing chambers were also investigated as they are one of the main energy consuming equipment in an agri-food industry. The audit results are shown in Figures 4 to 7.
Figure 3: Average volume of chambers by sector.
Figure 4: Material used in the construction of chambers of refrigeration and freezing. 0 € 5.000 € 10.000 € 15.000 € 20.000 € 25.000 € 30.000 € E n er g y co sts
Source of energy by materials
Electricity Diesel oil Naphtha Gas Propane Natural Gas Pellets Wood 0 10 20 30 40 50 60 70 80 90
Meat Bread Dairy Horticultural
Vo lum e (m 3 ) Sector 0% 10% 20% 30% 40% 50% 60% 70% 80% 90% 100%
Meat Bread Dairy Horticultural
P er ce nta g e o f m a ter ia l Sector Concrete Stainless steel Masonry Insulation panel
Figure 5: Material chosen for the flooring of chambers.
Figure 6: Thermal insulation material used in chambers.
As can be seen in Figures 3 to 6, the meat and dairy sectors have a larger volume inside the refrigeration and freezing chambers compared to the bakery and horticultural sectors. Regarding the material used for the construction of the chambers, it is possible to see that the insulation panel predominates. The fact that they made this choice translates into a lower thermal loss compared to concrete or masonry due to their coefficient of thermal conductivity.
As for the preferred floor by the sectors, there is the concrete. In horticultural crops, both the concrete and the insulation panel are the most used. In terms of thermal insulation used in the chambers, we have a higher percentage of polyurethane. It is also possible to verify that there are, in a small percentage, companies in the dairy sector that do not have any type of thermal insulation.
As can be seen in Fig. 8, the water heater is the type of generator most used in the set of sectors under analysis. The most commonly used fuel is propane gas, as shown in Figure 9. With respect to the refrigerating fluid used in refrigeration and freezing systems (Figure 10), it has been observed that there are still a lot of banished fluids circulating in the industry, such as R22.
0% 10% 20% 30% 40% 50% 60% 70% 80% 90% 100%
Meat Bread Dairy Horticultural
P er ce nta g e o f m a ter ia l Sector Stainless steel Mosaic Insulation panel Concrete 0% 10% 20% 30% 40% 50% 60% 70% 80% 90% 100%
Meat Bread Dairy Horticultural
P er ce nta g e o f m a ter ia l Sector Cork Uncoated Polyurethane
Figure 7: Breakdown of thermal energy production equipment by type [%].
Figure 8: Breakdown of the fuel by source [%].
Figure 9: Breakdown of the type of Refrigerant [%].
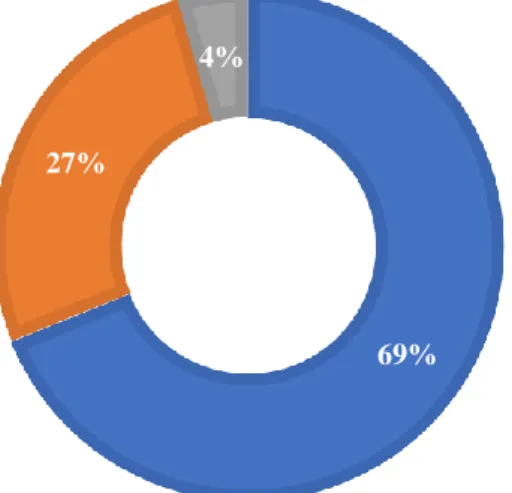
Another important factor in energy efficiency is the type of lighting used inside the chambers. The use of the LED is preferential, since it presents lower energy consumption, as shown in Figure 11.
20% 22% 20% 15% 1% 22% Water Boiler Water heater Steam Boiler Heater Heat Pump N/A 57% 8% 21% 2% 2% 10% Gas Propane Natural Gas Electricity Nafta Pellets Diesel oil 2% 75% 7% 2%2% 6% 2% 2% 2% R427A R404A R407A R437A R422D R22 R417A R12 R134A
Figure 10: Type of lighting used in refrigeration and freezing chambers.
7. MEASURES OF ENERGY EFFICIENCY
There are two sets of energy efficiency measures classified as Transverse Measures and Specific Measures for each industry sector. The transversal measures translate four groups of technological performance: Electric Motors, Heat and Cold Production, Lighting, Industrial Process Efficiency and Other Measures not specified. Transversal measures can be applied to most Portuguese industries. Measures of this type are those that have the greatest effect in terms of increasing energy efficiency for the Portuguese economy as a whole. In order to be applied, it is necessary that those in charge of sectors be instructed with these measures.
7.1. Refrigerant
A correct choice of the refrigerant fluid is also seen as a measure of energy efficiency.
The fluids R404A, R502 and R13, for example, have higher pressures, which is why they are used in applications with low evaporation temperatures. Refrigerant fluids R12 and R134a present lower pressures, being used in applications with higher evaporation temperature, between -20ºC and 0ºC. One of the most relevant studies in the area of cooling system efficiency was done by Werner et al. (2006) and carried out in New Zealand. This study was based on the comparison of 34 refrigeration chambers and proved that there is a considerable difference between the energy consumed in the chambers and the savings that would obtain if they optimized the system, in the order of 15-26% could be achieved by applying best practice technologies. 7.2. Refrigeration and freezing systems
In addition to the need to know the capacity of the refrigeration system to overcome the thermal loads that develop in the chambers of refrigeration or in the deposits of fluids, a good design of the refrigeration plant is fundamental:
• Use refrigeration systems for each level or temperature range, i.e. with a single level of suction cooling and freezing. This action achieves energy saving levels close to 20%;
• As the compressor only works with the superheat fluid in the vapor state, this condition is due to a small overheating.
• The ducts from the evaporators to the compressor must be well insulated to avoid high overheating, which penalizes the efficiency of the refrigeration cycle. Energy savings of 1 to 1.5% are achieved; • Avoid conducting the refrigerant with long lengths and with many curvatures and correctly select the
diameter of the suction pipes (larger diameter). You can achieve energy savings of 1.5 to 2.5%. • Use the optimum charge of the refrigerant in the system (avoid leakage). Energy savings of 1 to 4%
are achieved;
• Change from traditional refrigerant to an organic one. Energy savings of 10 to 15% are possible; 7.3. Lighting
Electricity consumed in lighting installations in the different sectors of activity (industry, services and household) accounts for approximately 25% of the country's overall consumption, and about 5% to 7% of the
69% 27% 4% Fluorescent Incandescent LED
overall electricity consumption of an industrial facility.
The sizing of the lighting system should take into account factors such as the layout of the luminaires, the preference for natural lighting when possible and the lighting sectioning.
7.4. Equipment maintenance
The maintenance of equipment and installations is fundamental to guarantee the efficiency of the performance of the technical installations. The most common is to perform only emergency corrective maintenance, without any programming, causing unnecessary damages and costs to the company. Currently, maintenance processes have evolved, and several industries are already aware that maintenance is an important practice, it is a fundamental support to achieve the strategic objectives of companies, and more, it is profitable. Maintenance, when organized and carried out, results in an increase in the useful life of the equipment.
7.5. Power management
Control of these data may lead to significant energy savings, as well as the detection of possible anomalies in the production system, as well as the forecast of consumption. It is frequent to find in the companies, certain equipment or sectors responsible for a large part of the global consumption, without having meters installed, which makes it impossible to determine the respective specific consumption as well as the detection of situations of anomalous consumption.
Conducting audits contributes to the definition of sectors or equipment where monitoring and control procedures, such as meter installation, are warranted. In this context it is also suggested the regular analysis of energy consumptions, with the objective of verifying the change in the registered consumption pattern; the comparison of the company's specific energy consumptions with others of the same industry (benchmarking analysis) and to set goals of energy saving; the focus on training, information and awareness of employees in the field of energy in order to eliminate less correct behavior in the field of energy consumption, without neglecting their safety and quality of work.
7.6. Renewable energy use
Portugal is located at a geographical point where you can enjoy the energy coming from the sea, the wind and the sun due in large part to the different morphologies that we have. Having these privileges, the choice for renewable energies should be higher than currently found, especially in industries. Solar thermal energy has an enormous potential of use, being very little used in the industrial sector. It consists of taking advantage of the energy emitted by the sun and its transformation into heat, ideal for heating water. It has the capacity to provide, naturally and economically, part of the heat that the company needs. As this is the most common, there are still other uses of this type of energy, such as the use in refrigeration machines that use heat to produce cold (absorption systems), and thus can reduce the consumption of electricity. The photovoltaic system allows to convert the energy released by the sun into electric energy.
7.7. Thermal insulation
Thermal insulation has the function of delaying thermal dissipation. These materials can be adjusted to the place where they are installed, whether in size, shape or surface appearance. It is a crucial element in energy conservation, reducing heat transfer with the medium, and as a result, an excellent measure that improves the energy efficiency of an industrial facility. It has a reduced investment against the advantages obtained. Its use allows:
• Reduce energy costs by minimizing heat losses; • Reduce condensate;
• Provide protection for the cold; • Protect equipment;
• Control process temperatures; • Protect against fire;
• Serve sound insulation.
7.8. Training and raising awareness of human resources
A real energy efficiency policy is not just about equipment but also about all areas adjacent to production. The training of employees allows the measures to be implemented in a more natural way. To this end, companies
should carry out awareness raising actions that focus on the following aspects: • Environmental impacts associated with high energy consumption; • The benefits of implementing energy efficiency measures;
• The energy dependence of industries and how the situation can be reversed: • What is the individual civic attitude that allows a correct energy management. 8. CONCLUSIONS
Based on the data collected in 60 companies, an evaluation was made of the measures implemented and possible to implement with emphasis on energy efficiency. This data was treated, making possible to perform a general evaluation on the field of energy consumption in the agrifood industries in Portugal. A constant work is required both a logistical component and production strategies in order to make companies efficient energy and thereby reduce energy spending.
The adoption of efficiency measures by SMEs equips them with the necessary instruments to become more competitive and dynamic in the market. The reduction of the energy costs, allow the saved money to be redirected to areas such as logistics, ensuring an expansion to the international market, which for these companies proves to be a crucial step for its continuity. With the energy efficiency measures presented along this paper, many of which require a reduced investment, it is intended to expose companies to the necessity and ease of implementation of the same and the advantages that come from them.
ACKNOWLEGMENTS
This study is within the activities of project Project +AGRO: Organizational, Energy and Occupational Health and Safety qualifications in the AgriFood Industry (Project 04 / SIAC / 2015 – SIAC 16159) promoted by COMPETE2020 and co-financed by FEDER under the Portugal 2020 initiative.
REFERENCES
Abdelaziz, E. A., Saidur, R. and Mekhilef, S. (2011) ‘A review on energy saving strategies in industrial sector’,
Renewable and Sustainable Energy Reviews. 15(1), 150–168.
Al-Mansour, F. (2011). Energy efficiency trends and policy in Slovenia. Energy, 36.
Bastos, E., Cruz, A., Silva, P.D., Gaspar, P.D. Caracterização dos consumos de energia dos sistemas de
refrigeração de empresas no setor agroindustrial - Beira Interior Norte. International Conference on
Engineering – Engineering for Economic Development (ICEUBI2013), University of Beira Interior, Covilhã, Portugal, November 27-29, 2013.
Kinne, B. S. (2003). Sustainable Energy Solutions.
Evans, J., Hammond, E., Gigiel, A., Reinholdt, L., Fikiin, K., Zilio, C. (2013). Improving the energy performance of cold stores. In: 2nd IIR Conference on Sustainability and the Cold Chain, Paris, 2013, 2-4 April 2013, Paris, France
Energy, N., Action, E., Climate, N., Plan, C., Regulation, R.-, Management, E. C, Plan, T. (2017), Intensive Energy Consumption Management System (SGCIE)
Gaspar, P.D., Elias, M., Pereira, C.D., Andrade, L.P., Pinheiro, R., Paiva, T., Soares, C., Gândara, J., Henriques, M., Laranjo, M., Potes, M.E., Santos, A.C.A., Santos, F.C., Silva, P.D., Nunes, J., Coutinho, P., Carneiro, J., Várzea, J.P., Vaz-Velho, M., Araújo, M.A., Ribeiro, M., Santos, J., Matias, J. (2018). Caracterização e Análise Energética de Empresas Agroalimentares. +AGRO - Qualificação organizacional, energética e de segurança e saúde no trabalho da indústria agroalimentar. Gaspar, P.D., Elias, M. (Eds). Universidade da Beira Interior. (ISBN: 978-989-654-452-2)
http://inovenergy.inovcluster.pt [accessed in: 01/07/2018]
http://www.adene.pt [accessed in: 01/07/2018]http://www.arecba.pt [accessed in: 02/07/2018] http://www.epe.gov.br [accessed in: 02/07/2018]
http://efinerg.aeportugal.pt [accessed in: 05/07/2018]
Huyen Do T.T., Schnitzer H., Hai Le T., (2014). A decision support framework considering sustainability for the selection of thermal food processes, Journal of Cleaner Production, 78, 112-120.
Mulobe, N. J. and Huan, Z. (2012). Energy efficient technologies and energy saving potential for cold rooms. In 2012 Proceedings of the 9th Industrial and Commercial Use of Energy Conference, IEEE, Stellenbosch, South Africa, 15-16 Aug. 2012.
efficiency-methodologies for the manufacturing industry. Energy Policy 25, 715-725.
Pradella, A. M., Gouvêa da Costa, S.E., Pinheiro de Lima, E., Vieira da Silva, W. (2017). Energy efficiency indicators in the food industry: a systematic review. DEStech Transactions on Engineering and
Technology Research, 685–690.
Conselho Empresarial para o Desenvolvimento Sustentável(BCSD). Manual de boas práticas de eficiência energética, 1–29.
Rochartre, L., Azevedo, S., Lavares, J. “notas prévias”, Manual de boas práticas de eficiência energética, ISR, Coimbra, 2005, 7.
Semkov K., Mooney E., Connolly M., Adley C. (2014). Efficiency improvement through waste heat reduction,
Applied Thermal Engineering, 70, 716-722.
Vera I., Langlois L. (2007) Energy indicators for sustainable development, Energy, 32, 875-882.
Werner, S.R.L., Vaino, F., Merts, I., Cleland, D.J. (2006). Energy use in the New Zealand cold storage industry. IIRIRHACE Conference, The University of Auckland, 2006.
Neves, D., Gaspar, P.D., Silva, P.D., Nunes, J., Andrade, L.P. (2014). Computational tool for the energy efficiency assessment of horticultural industries - Case study of inner region of Portugal. Lecture Notes
in Computer Science 8584 (LNCS), Part VI, 87-101.
Nunes, J., Silva, P.D., Andrade, L.P., Gaspar, P.D. (2014a). Characterization of specific energy consumption of electricity of portuguese sausages industry. H.H. Al-Kayiem, C.A. Brebbia, S.S. Zubir (Eds.), WIT
Transactions on Ecology and the Environment, 186, 763-774.
Silva, P.D., Gaspar, P.D., Andrade, L.P., Nunes, J., Domingues, C. (2016). Best practices in refrigeration pplications to promote energy efficiency – the Portuguese case study", Ch. 3, in D. Cunningham (Ed.), Food Industry: Assessment, Trends and Current Issues, Series Food and Beverage Consumption and Health, Nova Publishers, USA.
Nunes, J., Silva, P.D., Andrade, L.P., Gaspar, P.D. (2016). Key points on the energy sustainable development of sausages industry - the Portuguese case study", Renewable & Sustainable Energy Reviews, 57, 393-411.
Nunes, J., Neves, D., Gaspar, P.D., Silva, P.D., Andrade, L.P. (2014b). Predictive tool of energy performance of cold storage in agrifood industries: The portuguese case study. Energy Conversion and Management,
88, 758–767.
Nunes, J., Silva, P.D., Andrade, L.P., Domingues, C.L., Gaspar, P.D. (2015). Energy assessment of the Portuguese meat industry. Energy Efficiency, 1-16.
Silva, P.D., Gaspar, P.D., Nunes, J., Andrade, L.P. (2014). Specific electrical energy consumption and CO2 emissions assessment of agrifood industries in the central region of Portugal. Applied Mechanics and
Materials, 675-677, 1880-1886.
Gaspar, P.D., Silva, P.D., Nunes, J., Andrade, L.P. (2014). Characterization of the specific electrical energy consumption of agrifood industries in the central region of Portugal. Applied Mechanics and Materials,
590, 878-882.
NOMENCLATURE
GDP Gross domestic product
PREn Energy Consumption Rationalization Plans
FAO
Food and Agriculture Organization of the United Nations
SME Small and medium-sized enterprisesSEC Specific energy consumption
EI Energy Intensity
CI Carbon Intensity
![Figure 1: Final energy consumption by activity sector [Source: INE].](https://thumb-eu.123doks.com/thumbv2/123dok_br/18212383.876793/2.892.91.764.370.546/figure-final-energy-consumption-activity-sector-source-ine.webp)

![Figure 7: Breakdown of thermal energy production equipment by type [%].](https://thumb-eu.123doks.com/thumbv2/123dok_br/18212383.876793/7.892.267.514.130.380/figure-breakdown-thermal-energy-production-equipment-type.webp)