2018
Impact of climate change and contamination in the oxidative stress response of marine organisms
“ Documento Definitivo”
Doutoramento em Ciências do Mar
Ana Rita José Lopes
Tese orientada por:
Professor Doutor Rui Afonso Bairrão da Rosa Professor Doutor Mário Emanuel Campos de Sousa Diniz
2018
FACULDADE DE CIÊNCIAS
Impact of climate change and contamination in the oxidative stress response of marine organisms
Doutoramento em Ciências do Mar
Ana Rita José Lopes
Tese orientada por:
Professor Doutor Rui Afonso Bairrão da Rosa Professor Doutor Mário Emanuel Campos de Sousa Diniz Júri:
Presidente:
● Doutora Maria Manuela Coelho, Professora Catedrática e Presidente do Departamento de Biologia Animal, Faculdade de Ciências da Universidade de Lisboa
Vogais:
● Doutora Maria Helena Costa, Professora Catedrática, Faculdade de Ciências e Tecnologias da Universidade Nova de Lisboa
● Doutora Rosa de Fátima Lopes de Freitas, Investigadora Auxiliar, Departamento de Biologia Animal, Universidade de Aveiro
● Doutor António Manuel Barros Marques, Investigador Principal, Instituto Português do Mar e Atmosfera - IPMA ● Doutor Carlos Alexandre Sarabando Gravto, Professor Auxiliar, Faculdade de Ciências da Universidade de Lisboa
● Doutor Rui Afonso Bairrão da Rosa, Investigador FCT de nível de desenvolvimento, Faculdade de Ciências da Universidade de Lisboa (orientador)
Documento especialmente elaborado para a obtenção do grau de doutor Fundação para a Ciência e Tecnologia (SFRH/BD/97070/2013)
“The Sea, once it casts its spell, holds one in its net of wonder forever” - Jacques Yves Cousteau
“Everybody is a genius. But if you judge a fish by its ability to climb a tree, it will live its whole life believing that it is stupid.”
- Albert Einstein
“Even Alice had to fall before she found her Wonderland” - Unknown
“A vida é curta demais para se acordar com arrependimentos. Ama as pessoas que te tratam bem. Esquece aquelas que não. A vida coloca cada um no seu lugar. Tudo vai e vem por uma razão.
Se tens uma segunda oportunidade, agarra-a. Ninguém disse que a vida seria fácil, só prometeu que iria valer a pena.
Vive, deixa viver e sê feliz.”
Acknowledgments
“Hoje” sinto-me uma pessoa feliz, completa, mas sobretudo sortuda. Tenho do meu lado os melhores do mundo e sem os quais, cada um do seu jeito, esta etapa não teria sido vivida da mesma forma e intensidade. Mas mais importante ainda é saber que esta etapa também vocês a tomaram como vossa, sentindo as minhas frustrações e sorrindo a cada conquista. Por isso o meu maior obrigado a todos vós!
Quero agradecer em primeiro lugar às duas pessoas que me acompanharam neste meu percurso e me ajudaram a chegar onde estou hoje, os meus orientadores.
Obrigada Rui por me teres acolhido no laboratório em 2011, altura em que comecei o meu mestrado e esta aventura na minha segunda casa. Obrigada por me teres tornado na pessoa que sou hoje, pois nem só de sorrisos se faz o mundo. A Marisa Liz tem uma música que sumariza o meu sentimento no fim desta etapa “Lembra-me das minhas fraquezas. E eu conto-te como as tornei nas minhas certezas”. Hoje sei reconhecer a ter a capacidade de te agradecer por me pores à prova, pois cheguei aqui, consegui, cresci e tornei-me numa melhor profissional. Não costumo prezar um amigo pela forma como está sempre de acordo comigo, mas sim pela capacidade de me fazer ver onde errei. Por isso o meu mais sincero obrigada.
Ao Mário, obrigada por teres aceite o convite do Rui também em 2011 e me teres vindo a acompanhar desde aí. Obrigada por seres um professor e um colega de bancada excepcional, por ouvires as minhas frustrações e teres sempre uma palavra amiga de volta. Obrigada pela tua paciência e sobretudo pela tua calma e paz interior que sempre me ajudaram nos tempos mais difíceis. Nunca irei esquecer as conversas de laboratório, os risos e a amizade que se criou ao longo destes anos.
Agradeço também a Fundação para a Ciência e Tecnologia (FCT) pelo financiamento da minha bolsa (SFRH/BD/97070/2013) e também pelos projectos PTDC/AAG-GLO/1926/2014 e PTDC/AAG-GLO/3795/2014, liderados pelos Doutores Rui Rosa e Tiago Grilo, respectivamente, que financiaram o material necessário para o desenvolvimento desta dissertação. Como não podia deixar de ser, quero agradecer à minha família do Laboratório Maritimo da Guia. Aos de passagem – Luana Mincarelli, Marta Morais, Lidia García, Meri Bilan, Eve
Otjacques – e aos de sempre – Tiago Repolho, Marta Pimentel, Catarina Frazão, Eduardo Sampaio, Catarina Santos, José Paula, Miguel Baptista, Maria Rita, Francisco Carvalho, Francisco Borges, Érica Moura, Cláudia Pereira, Ricardo Cyrne, Inês Rosa, Gisela Dionísio, Ana Couto, Sofia Francisco, Vasco Pissara, Ricardo Lopes, Maria Paulo, Filipa Faleiro, Joana Portugal, Eduarda Pinto, Ana Luísa Maulvault, Patrícia Anacleto, Carolina Camacho, Vera Barbosa, Marta Santos.
Quero também agradecer aos de para sempre.
Em especial à Kuka, por me acompanhar nesta fase, foram quatro anos de luta, mas conseguimos, chegamos à nossa meta, parabéns para nós. Obrigada por toda a tua amizade, por lado-a-lado teres vivido toda esta fase com a mesma intensidade que eu. Foi extremamente reconfortante ter a minha pessoa, a minha colega de secretária a viver esta fase ao mesmo tempo que eu e contigo poder partilhar todas as frustrações e alegrias que só nós compreendíamos na altura. Obrigada! À minha Cátia e ao meu Grilo. “What is a friend? A single soul dwelling in two bodies” (Aristotle). Neste caso três, obrigada por serem das pessoas mais fantásticas e fascinantes que conheço e tenho na minha vida, é um orgulho ser vossa amiga. Foram vocês uns dos maiores suportes nesta etapa, sem vocês e sem o vosso apoio incondicional sem dúvida que teria sido um percurso sem graça. Não consigo expressar o quanto são importantes para mim, quer a nível profissional quer a nível pessoal, são sem sombra de dúvida as minhas pessoas, aquelas que quero levar para o resto da minha vida. Aquelas que me irão perguntar há quanto tempo nos conhecemos e irei responder “it’s been 84 years” e “this is this”, porque é o que é, e é para sempre.
Á minha espanhola preferida, a minha Sara, que sempre me conseguiu enviar todo o seu amor e amizade, em todas as alturas, que veio para ficar. Obrigada por me mostrares o teu lado doce, divertido e espontâneo. Obrigada por todos os sorrisos e abraços partilhados, nas despsdidas e nas chegadas. Se um dia Madrid não vier a Portugal, Portugal vai a Madrid.
À minha família do 2765 – Ina, Vítor, Daniel, Anaísa, Flecha. É um privilégio enorme ter-vos na minha vida. Obrigada por me terem acolhido tão bem no vosso grupo e por me acompanharem nesta luta, por me questionarem sobre o que faço, mesmo quando não percebiam tão bem o que é que faço. Por me retirarem de casa nos meus dias loucos e me fazerem lembrar que existe mais do que trabalho e que quando se tem uma família e amigos assim como vocês o equilíbrio entre tabalho e amizade é facil e tudo se torna melhor.
Aos que entraram na minha vida em momentos tão diferentes, mas que continuam e que não imaginam o quanto me mudaram. À minha Daniela, à minha Joana e ao meu André, obrigada. Os tempos de Peniche não voltam, mas a cada dia que passa construímos histórias e aventuras novas, que vou guardar sempre no meu coração. Ao Ricardo Durão, obrigada por teres entrado na minha vida numa das piores fases possíveis, sem fazeres a menor ideia ajudaste-me mais do que alguma vez imagisnaste. Obrigada por seres o meu parceiro de treino, mas acima de tudo por seres esse amigo com um coração do tamanho do mundo, um amigo que vou preservar. À Lucy, Nuno, Vicente, Dora, Evin, Lena, Diogo, Martim por serem absolutamente únicos. É tão bom chegar à minha terra natal e ser inundada do vosso amor!
Quero agradecer aos meus tios de coração Arminda e Rui e às minhas pessoas Joana e Luis, a família de coração é aquela que temos o privilégio de escolher e eu não podia ter feito melhor escolha. Obrigada pelos jantares de sábado, por todas as gargalhadas e momentos. Obrigada Joana e Luis por partilharam comigo o vosso mundo, um mundo chamado Laura, o baguinho que se tornou na minha princesa. É um orgulho ser a “Miinha Ita”.
À minha Madrinha Lena, ao Tio Rui, à Cristina, à Maria e à Constança por todo o vosso apoio em todas as fases da minha vida. Por me mostrarem que há laços que não se quebram e por me fazerem ver que há palavras que não são precisas ser ditas para ser verdade. Também gosto muito de vocês e tenho muito orgulho em vocês.
À família que ganhei quando conheci o amor da minha vida. Obrigada Ana, Natacha e Carlos por todo o carinho e apoio. Por todos os mimos e por todos os jantares que reconfortaram o coração. Não podia estar mais feliz com a família que me calhou.
“Alice: How long is forever? White Rabbit: Sometimes, just one second.” ― Lewis Carroll, Alice in Wonderland
Por fim quero agradecer aqueles sem os quais não consigo passar um segundo na minha vida. Em especial ao amor da minha vida. Obrigada Alex por seres a pessoa mais cativante, carinhosa e generosa do mundo e por ser eu a privilegiada da tua escolha. Obrigada pela tua compreensão, pela tua ajuda, mas acima de tudo por me fazeres crescer e querer ser uma pessoa melhor. Quero também agradecer ao meu Lucky - “Until one has loved an animal a part of one’s soul remains
unawakened” (Anatole France) - por todos os mimos e por toda a companhia ao longo destes 5 anos. Vocês elevam a palavra família a um novo nível. Obrigada!
Por fim, quero agradecer aos mais importantes. Aos que me conhecem desde o dia zero. Ao enorme pilar familiar que tenho. Obrigada pai e mãe por fazerem de mim a pessoa que sou hoje, é a vocês que devo tudo. Obrigada por sempre me apoiarem nos momentos difíceis, e por mostrarem tanto orgulho nos momentos felizes. Obrigada por me ensinarem a lutar pelo que quero, contra tudo e todos, a levantar a cabeça e andar com orgulho. Quero também agradecer aos meus avós Luísa e Fernado. Obrigada pelo orgulho estampado nos vossos olhos e por todo o amor que sempre tiveram por mim. Quero agradecer em especial a ti avô, por seres um exemplo de garra, preserverança e luta, por enfrentares uma das piores batalhas de sempre com esperança no coração e por nunca teres desistido, nem nos dias mais dificeis. Ser tua neta é um dos maiores privilégios da minha vida.
Quero também agradecer em avanço a todas as pessoas que irão um dia ler esta dissertação, pois no fim do dia é com vocês que o meu “trabalho” está completo.
“Sharing knowledge is the most fundamental act of friendship. Because it is a way you can give something without loosing something” - Richard Stallman
Contents
Abstract ………1
Resumo ………3
Resumo Alargado ...5
List of Articles ...9
List of Abbreviations and Units ... 11
List of Figures ... 15
List of Tables ... 21
Chapter 1. GeneralIntroduction ... 23
Global Climate Change – A high CO2 World ... 23
Ocean under High CO2 ... 25
Ocean Warming ... 28
Ocean Acidification ... 30
Contamination under Climate change ... 31
Heavy metals - the mercury case ... 32
Biological responses ... 34
Oxidative stress under climate change ... 35
Protective mechanisms... 36
Cellular damage ... 40
Conventional biomarkers and marine tree of life ... 41
General Objectives ... 44
References ... 47
Part One. Within- and Trans-Generational Effects Under Ocean Acidification ... 67
Chapter 2. Absence of cellular damage in tropical newly-hatched sharks (Chiloscyllium plagiosum) under ocean acidification conditions... 69
Abstract ... 69
Materials and Methods ... 72
Results………..………..79 Discussion ... 82 Acknowledgments... 85 Competing of interests... 85 Funding ... 85 References ... 86
Chapter 3. Transgenerational exposure to ocean acidification induces biochemical distress in a
keystone amphipod species (Gammarus locusta) ... 93
Abstract ... 93
Material and methods ... 96
Results ... 103
Discussion... 107
Acknowledgements ... 110
Conflict of Interest ... 110
References ... 111
Part Two. 119Biochemical Responses Under a Multiple Stressor Environment ... 119
Chapter 4. Physiological resilience of a temperate soft coral to ocean warming and acidification .... 121
Abstract ... 121
Materials and Methods ... 124
Results ... 128
Acknowledgments... 132
Competing of interests ... 132
References ... 133
Chapter 5. Encased in troubled waters: Oxidative damage in shark embryos under ocean warming and the protective role of the capsule against contamination... 141
Abstract ... 141
Material and methods ... 144
Results ... 150 Discussion ... 156 Acknowledgments ... 160 Funding ... 160 Conflict of Interest ... 160 References ... 161
Chapter 6. Ocean acidification dampens physiological stress response to warming and contamination in a commercially-important fish (Argyrosomus regius) ... 169
Abstract ... 169
Material and Methods ... 172
Results ... 179
Discussion ... 189
Conclusions ... 193
Acknowledgments... 194
References ... 195
Biochemical responses under a multi-stressor environment ... 205
Biochemical responses across taxa ... 209
Within- and trans-generational biochemical responses ... 211
Future Directions ... 212
References ... 214
1
Abstract
Atmospheric carbon dioxide (CO2) levels are increasing at an unprecedented rate, changing the carbonate chemistry (in a process known as ocean acidification) and temperature of the worlds ocean. Moreover, the simultaneous occurrence of highly toxic and persistent contaminants, such as mercury, will play a key role in further shaping the ecophysiology of marine organisms. Thus, the main goal of the present dissertation was to undertake the first comprehensive and comparative analysis of the biochemical strategies, namely antioxidant defense (both enzymatic and non-enzymatic antioxidants) and protein repair and removal mechanisms, of several marine organisms – from invertebrate (Veretillum cynomorium and Gammarus locusta) to vertebrate species (Argyrosomus regius, Chiloscyllium plagiosum and Scyliorhinus canicula) – encompassing different life-stages and life-strategies to the predicted climate-mediated changes. The findings provided in the present dissertation proved that organisms’ responses were mostly underpinned by temperature (increasing lipid, protein and nucleic acid damage), that also culminated into increased mercury bioaccumulation and toxicity, while ocean acidification as a sole stressor usually played a minor role in defining species vulnerability (i.e. responsible for increased oxidative damage in the marine calcifying organisms G. locusta). Nonetheless when co-occurring with warming and contamination scenarios, acidification was usually responsible for the reduction of heavy metal accumulation and toxicity, as well as decreased warming and contamination-elicited oxidative stress. Additionally, organisms’ responses were species-specific, and organisms that usually occupy more variable environments (e.g. daily changes in abiotic conditions) usually displayed greater responses towards environmental change than organisms inhabiting more stable environments. Furthermore, and assuming the relevance of transgenerational effects, it seems that the negative effects of OA are potentially being inherited by the offspring’s, compromising the efficiency of future generations to endure the upcoming conditions.
Key-words: Ocean acidification, Warming, Mercury contamination, Biochemical defense
3
Resumo
Os níveis de dióxido de carbono na atmosfera têm vindo a aumentar drasticamente, alterando a temperatura e a química dos oceanos, num processo designado de acidificação dos oceanos. Adicionalmente, a ocorrência simultânea de contaminantes tóxicos, tais como o mercúrio, irá desempenhar um papel fundamental na resposta fisiológicas dos organismos marinhos. Desta forma, o objetivo principal da presente dissertação foi o de realizar uma análise comparativa dos mecanismos de defesa (antioxidantes e mecanismos de reparação/eliminação de proteínas) em organismos marinhos – invertebrados (Veretillum cynomorium, Gammarus locusta) e vertebrados (Argyrosomus regius, Chiloscyllium plagiosum, Scyliorhinus canicula) - abrangendo diferentes estágios e estratégias de vida em relação às alterações ambientais globais previstas para o final deste século. Os resultados apresentados na presente dissertação provaram que a resposta dos organismos foi principalmente afetada pelo aumento da temperatura dos oceanos (traduzindo-se num aumento de dano lipídico, proteico e de DNA), culminando também numa maior bioacumulação e toxicidade do mercúrio, enquanto a acidificação dos oceanos, geralmente desempenhou um papel menos relevante relativamente à vulnerabilidade das espécies (sendo apenas responsável pelo aumento de dano oxidativo em organismos calcificadores, como foi o caso do G. locusta). No entanto, durante a exposição simultânea de fatores, a acidificação foi responsável pela redução da toxicidade e acumulação de metais pesados, bem como pela diminuição do stress oxidativo causado pelo aquecimento e contaminação do oceano. Por fim, a resposta dos organismos varia de espécies para espécie, e geralmente organismos que habitam em ambientes mais variáveis – mudanças diárias nas condições abióticas – conseguem responder de forma mais positiva às alterações climáticas que organismos que habitam ambientes mais estáveis. Além disso, e tendo em conta os efeitos parentais em resposta às alterações do oceano, parece que os efeitos negativos da acidificação dos oceanos irão potencialmente ser herdados pelos descendentes, comprometendo desta forma a sobrevivência das gerações futuras.
Palavras-chave: Acidificação dos oceanos, Aquecimento dos oceanos, Contaminação,
5
Resumo Alargado
Desde a Revolução Industrial os níveis dióxido de carbono (CO2) atmosférico têm vindo a aumentar, atingindo pela primeira vez na história da humanidade valores consistentemente acima dos 400 ppm. Para além disso, é esperado que as concentrações atmosféricas de CO2 cheguem aos 1000 ppm até ao final deste século. Sendo um dos principais gases do efeito de estufa, este incremento – cerca de 80% nos últimos dois séculos – tem também intensificado a temperatura atmosférica e consequentemente o aumento da temperatura dos oceanos (i.e. 90% da temperatura atmosférica é absorvida pelo oceano). Desta forma, para a temperatura média da superfície dos oceanos, que tem vindo a aumentar a uma taxa de 0.1 °C por década, prevê-se um aquecimento adicional de 1–4 °C até 2100. Considerando que os oceanos são um dos maiores reservatórios naturais de CO2 e que absorvem cerca de um terço das emissões antropogénicas, é esperado que a dissolução do CO2 na água do mar leve ao aumento da quantidade de iões hidrogénio na água, que por sua vez irão reduzir o seu pH num processo designado de acidificação dos oceanos. Adicionalmente, esta alteração na química da água do mar irá também diminuir a concentração e saturação de iões carbonato de cálcio causando um impacto adicional sobretudo para espécies que sintetizam um exosqueleto calcário (i.e. corais, moluscos, crustáceos, etc). Aliado a estes fatores, a ocorrência simultânea de contaminantes tóxicos e extremamente persistentes, tais como metais pesados como o mercúrio, também irá desempenhar um papel fundamental na resposta fisiológicas dos organismos marinhos. Sendo compostos não degradáveis, os metais pesados são facilmente acumulados nos sedimentos marinhos ou em organismos marinhos, entrando na teia alimentar – bioacumulação – sendo transferidos para níveis tróficos mais elevados – biomagnificação.
É espectável que as futuras alterações climáticas afetem os vários níveis de organização biológica dos organismos marinhos – desde o nível molécular ao organismo. Contudo, a crescente informação relacionada com este tópico tem deixado a componente molecular um pouco mais aquém. Nomeadamente no que diz respeito aos mecanismos de resposta dos organismos marinhos ao aumento das espécies reactivas ao oxigénio (ROS) que é esperado ocorrer quando expostos às condições supramencionadas. Os ROS são naturalmente formados durante os processos metabólicos (i.e. respiração e fotossíntese), mais concretamente durante o processo de redução do oxigénio para a produção de energia na cadeia de transporte de eletrões. Deste
processo resultam intermediários extremamente recativos (i.e. ROS) tais como o ião superóxido (O2-), peróxido de hidrogénio (H2O2) e o radical hidroxilo (HO•), com uma elevada capacidade de causar danos irreversíveis nos lípidos, proteínas e DNA dos organismos marinhos. Contudo, e em condições normais os organismos marinhos exibem mecanismos de defesa contra as ROS, tais como compostos enzimáticos (e.g. superóxido dismutase, catalase, glutationa peroxidase, etc) e não enzimáticos (e.g. vitaminas, acido úrico e ascórbico, etc). Adicionalmente podem também exibir uma resposta secundária sustentada pela produção de proteínas de choque térmico (HSP), cujo papel principal é o de garantir a conformação e função proteica.
Desta forma o principal objetivo da presente dissertação foi o de integrar, pela primeira vez, uma análise comparativa das estratégias bioquímicas, incluindo os mecanismos de defesa antioxidante (enzimáticos e não enzimáticos) e de reparação/eliminação de proteínas dos organismos marinhos, abrangendo espécies invertebradas (Veretillum cynomorium, Gammarus locusta) e vertebradas (Argyrosomus regius, Chiloscyllium plagiosum, Scyliorhinus canicula), bem como diferentes estágios e estratégias de vida em relação às alterações climáticas esperadas até ao fim deste século. Assim, a presente dissertação foi dividida em duas partes: Parte 1 – com o objetivo de entender as defesas bioquímicas utilizadas pelos organismos marinhos face à acidificação dos oceanos, quer numa só geração quer a nível transgeracional (Capítulos 2 e 3, respectivamente); e a Parte 2 – onde se pretendeu fazer uma abordagem mais holística do sinergismo entre os diferentes fatores (i.e. aquecimento e/ou acidificação do oceano, e a exposição simultânea à contaminação por mercúrio (orgânico e inorgânico), Capítulos 4-6).
Os resultados apresentados na presente dissertação provaram que a resposta dos organismos marinhos foi principalmente estimulada pelo aumento da temperatura dos oceanos o que se traduziu num aumento de dano dos lípidos, proteínas e de DNA, resultando também num maior aumento da concentração de mercúrio nos tecidos dos organismos marinhos [especialmente no fígado (caso do metilmercúrio) e nas brânquias (caso do cloreto de mercúrio)], bem como numa maior toxicidade, especialmente do mercúrio inorgânico, que se traduziu numa elevada taxa de mortalidade em embriões do tubarão S. canicula. Relativamente à acidificação dos oceanos, esta desempenhou de uma forma geral um papel menos relevante relativamente à vulnerabilidade das espécies (sendo apenas responsável pelo aumento de dano oxidativo em organismos calcificadores, como foi o caso do anfípode G. locusta). No entanto, durante a exposição simultânea de fatores, a acidificação foi responsável pela redução da toxicidade e acumulação de metais pesados, bem como pela diminuição do stress oxidativo causado pelo
7
aquecimento e contaminação do oceano. Especificamente, os iões hidrogénio (H+) resultantes da dissolução do CO2 na água parecem contrabalançar o aumento de ROS causado pelo aumento da temperatura e pela contaminação do oceano, através da conversão de iões H+ e HO• em água, eliminando os radicais livres e consequentemente levando a uma diminuição da atividade das enzimas de stress oxidativo, culminando desta forma num decréscimo do dano celular.
Relativamente às respostas a nível taxonómico, a presente dissertação demonstrou que a resposta dos organismos varia de espécie para espécie. Desta forma, organismos que habitam em ambientes mais variáveis (i.e. zona intertital de regiões temperadas e estuários) no que diz respeito às condições abióticas de temperatura, salinidade e oxigénio, respondem de forma positiva às alterações climáticas (i.e. aumento das respostas antioxidantes e de proteínas de stress térmico, de forma e evitar dano celular) do que organismos que habitam ambientes mais estáveis (e.g. zonas tropicais). Contudo, como em tudo existem exceções à regra, uma vez que tubarões recém eclodidos (C. plagiosum) parecem estar melhor preparados, ao possuir um sistema de defesa antioxidante evolutivamente mais ancestral, baseado em compostos não enzimáticos, como a ureia e o N-óxido de trimetilamina (TMAO), que parecem conferir um maior grau de proteção que os compostos enzimáticos (estudados em peixes teleósteos, evolutivamente mais recentes, contudo insuficientes para evitar dano celular). Mas uma vez mais, os mecanismos de resposta empregues variam de espécie para espécie e também consoante o seu estado de vida e o stress ao qual estão expostos. Assim, e apesar da acidificação dos oceanos não ter provocado dano oxidativo em C. plagiosum, o efeito combinado da temperatura e da contaminação numa outra espécie de tubarão (embriões de uma espécie temperada – S. canicula) foi responsável por 100% de mortalidade após 6 dias de exposição. Levando-nos a assumir que o aumento da temperatura, como já provado noutras espécies, leva ao aumento da toxicidade do mercúrio devido ao aumento da atividade metabólica, que leva a uma maior concentração e acumulação de mercúrio nos tecidos desta espécie.
Adicionalmente, organismos calcificadores demonstram ser mais afetados pela acidificação dos oceanos, uma vez que é esperado que os iões H+ diminuam também o pH intracelular, afetando proteínas responsáveis pelo desempenho da célula. Além disso, e tendo em conta os efeitos parentais das alterações do oceano, parece que os efeitos negativos da acidificação dos oceanos em anfípodes da espécie G. locusta, irão potencialmente ser herdados pelos seus descendentes, comprometendo desta forma a sobrevivência das gerações futuras.
Desta forma, e como reforçado na presente dissertação, a contribuição das respostas bioquímicas ao longo da teia trófica é extremamente importante para podermos determinar corretamente quais as respostas individuais de cada organismo ao oceano do futuro, e para complementar os estudos já realizados relativamente às variações a nível fisiológico (i.e. metabolismo, reprodução, crescimento). Apenas assim poderemos determinarmos de forma correta os efeitos das mesmas na fenologia e distribuição das espécies, e determinar possíveis extinções. Por fim, consideramos que estudos relativos aos efeitos a nível trans- e multigeracional são extremamente importantes e que deveriam ser o foco num futuro próximo, uma vez que muitas vezes os efeitos das alterações climáticas não são visíveis numa só geração. Desta forma, determinar de que forma o condicionamento parental poderá afetar a descendência é extremamente importante para que se possa complementar a informação já existente.
9
List of Articles
This thesis comprises a total of five scientific papers, listed below, each corresponding to a chapter (2-4 and 6). Three of the articles are already published in peer-reviewed international journals, and one under review.
Chapter 2
Lopes AR, Sampaio E, Santos C, Couto A, Pegado MR, Diniz M, Munday PL, Rummer JL, Rosa R. Absence of cellular damage in tropical newly-hatched sharks (Chiloscyllium plagiosum) under ocean acidification conditions
Cell Stress and Chaperones (2018) (DOI: 10.1007/s12192-018-0892-3)
Chapter 3
Lopes AR, Borges F, Figueiredo C, Sampaio E, Diniz M, Rosa R, Grilo TF. Transgenerational exposure to ocean acidification induces biochemical distress in a keystone amphipod species (Gammarus locusta)
Submitted
Chapter 4
Lopes AR, Faleiro F, Rosa IC, Pimentel MS, Trübenbach K, Repolho T, Diniz M, Rosa R. Physiological resilience of a temperate soft coral to ocean warming and acidification
Cell Stress and Chaperones (2018) (DOI: 10.1007/s12192-018-0919-9)
Chapter 5
Lopes AR, Santos C, Diniz M, Rosa R. Encased in troubled waters: Oxidative damage in shark embryos under ocean warming and the protective role of the capsule against contamination Submitted
Chapter 6
Sampaio E*, Lopes AR*, Francisco S, Paula JR, Pimentel M, Maulvault AL, Repolho T, Grilo TF, Pousão-Ferreira P, Marques A, Rosa R. Ocean acidification dampens physiological stress response to warming and contamination in a commercially-important fish (Argyrosomus regius)
Science of the Total Environment (2018) 618: 388-398 (Doi: 10.1016/j.scitotenv.2017.11.059) * equally contributed
11
List of Abbreviations and Units
% Percentage
~ Approximately
> Above
± Plus – minus
µatm Micro atmosphere
µL Microliter µm Micrometer µM Micromolar µm Micromole 1O 2 Singlet Oxygen 4-HNE 4-hydroxynonenal 8-OHdG 8-hydroxy-2’-deoxyguanosine
AAS Atomic absorption
Spectrometry abs Absorbance ABTS 2,2'-azino-bis(3- ethylbenzothiazoline-6-sulphonic acid) AChE Acetylcholinesterase ANOVA Analysis of variance
ATP Adenosine triphosphate
BSA Bovine serum albumin
C2H6Hg Dimethylmercury C9H12O2 Cumene hydroperoxide
Ca2+ Calcium ions
CaCO3 Calcium carbonate ions
CAT Catalase CDNB 1-chloro-2,4-dinitrobenzene CH3Hg Methylmercury CH4 Methane CO2 Carbon dioxide CO3-2 Carbonate ions
CT Total dissolved inorganic
carbon
dw Dry weight
e- electron
e.g. For example (from the Latin
“exampli gratia”)
ELISA Enzyme-linked
immunosorbent assay
ETC Electron transport chain
etc Etcetera
ƐmM Extinction coefficient
F0 Parental/First generation
F1 Offspring/Progeny
Fe Iron
g Relative centrifugal force
GHG Greenhouse gases
GLM Generalized linear models
GPx Glutathione peroxidase GR Glutathione reductase GSH Glutathione GSSG Oxidized glutathione GST Glutathione S-Transferase h Hour H+ Hydrogen ions H2CO3 Carbonic acid
H2O Water
H2O2 Hydrogen peroxide
HCL Hydrochloric acid
HCO3-1 Bicarbonate ions
Hg Mercury Hg0 Elemental mercury HgCl2 Mercury chloride HgII Inorganic mercury HgT Total mercury HO• Hydroxyl radical
HSC Heat shock cognate
HSP heat shock protein
HSR Heat shock response
i.g. That is (from the Latin “id est”)
IPCC Intergovernmental panel on
climate change KCl Potassium chloride kDa Kilodalton kg Kilogram KH2PO4 Potassium phosphate km Kilometer km2 Square kilometer
KOH Potassium hydroxide
L Litter
LPO Lipid peroxidation
m Meter M Molar MDA Malondialdehyde Me2Hg Dimethylmercury MeHg Methylmercury mg Milligram min Minutes mL Milliliter mM Millimolar N2O Nitrous oxide
Na2HPO4 Sodium phosphate
NaCl Sodium chloride
NADP+ Nicotinamide adenine
dinucleotide phosphate
NADPH
Dihydronicotinamide-adenine dinucleotide phosphate
NaOH Sodium hydroxide
NBT Nitro blue tetrazolium
Nm Nanometers nmol Nanomole NO Nitric oxide O2- Superoxide ion O2 Oxygen O3 Ozone OA Ocean acidification ºC Degrees celsius
OCLTT Oxygen and capacity limited thermal tolerance concept
OMZ Oxygen minimum zone
OONO- Peroxynitrite
OW Ocean warming
PBS Phosphate buffered saline
pH Power of hydrogen
pHe external pH
pHi internal pH
pHT pH total scale
13 PUFA Polyunsatured fatty acid
RNS Reactive nitrogen species
ROS Reactive oxygen species
rpm Revolutions per minute
SOD Superoxide dismutase
sp. or spp. Specific epithet of species not identified. Single or several species within a genus
SST Sea surface temperature
TAC Total antioxidant capacity
TBARS Thiobarbituric acid reactive substances
Tc Critical temperature
Td Denaturation temperature
TGP Transgenerational plasticity
TMAO Trimethylamine N-oxide
Topt Optimum temperature
Tp Pejus temperature
U Units
Ub Ubiquitin
v/v Volume/Volume
ww Wet weight
XOD Xanthine oxidase
yr Year
Δ Delta
15
List of Figures
Chapter 1
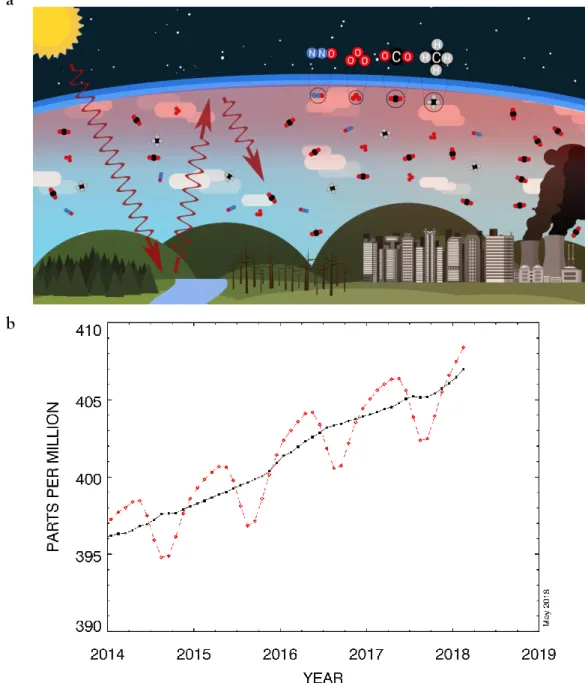
Figure 1 – (a) Diagram of the greenhouse effect: greenhouse gases (CO2, N2O, O3, CH4) sources and the capture of solar heat, increasing atmospheric temperature; (b) Annual average CO2 emissions, from 2014-present, data from Mauna Loa Observatory (NOAA 2018)
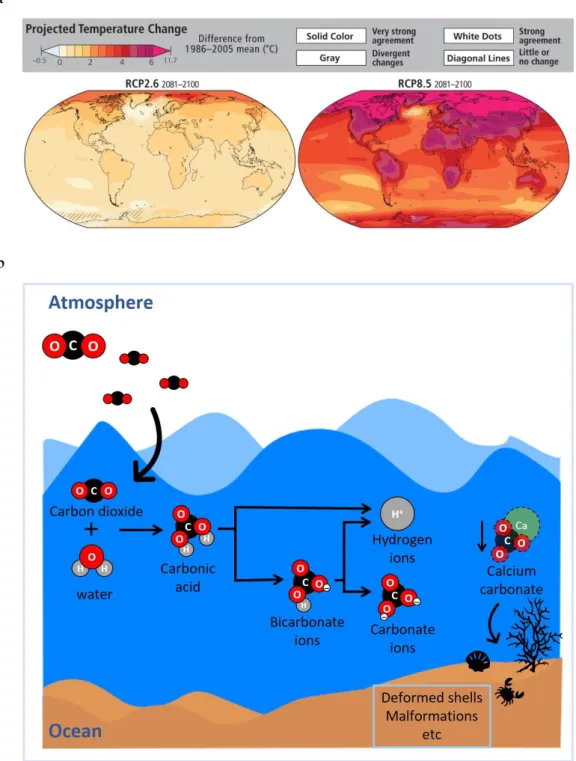
Figure 2 – (a) Projected changes in annual average surface temperature for 2081-2100, according
to RCP2.6 and 8.5 (source: IPCC 2014); (b) Ocean acidification schematics of the fate of carbon dioxide (CO2) as it dissolves in the seawater
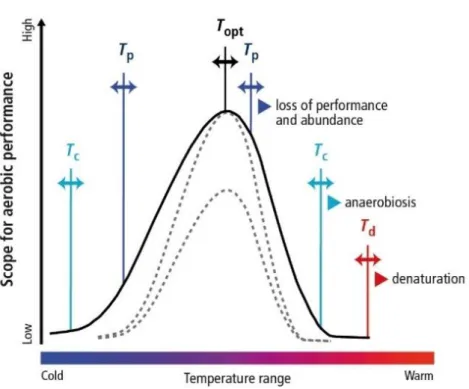
Figure 3 – Schematics of the thermal window of oxygen and capacity limited thermal tolerance
concept (OCLTT) of marine organisms. Optimum temperature (Topt) correspond to the temperature which a specific performance (e.g. growth, reproduction) is maximal. Pejus temperatures (Tp) correspond to the first temperature threshold to which a specific animal has a time-limited tolerance. Critical temperatures (Tc) is the second temperature threshold, where O2 availability becomes insufficient, demarks the beginning of the anaerobic metabolism. Denaturation temperature (Td) is characterized by the onset of cell and protein damage. Full black curve represents the performance curve under normal conditions. Dashed grey curve represent the performance curve options under OA and/or hypoxic seawater (source: Pörtner et al. 2014, following Pörtner 2002; 2012; Pörtner and Farrell 2008)
Figure 4 – Schematic response of a marine organism to OA. Effects are mediated via diffusive
CO2 entry (black arrows) into the body and cell compartments, resulting in a rise in
pCO2 (highlighted in red), a drop in compartmental pH (highlighted in blue), and their effects (red arrows) on various processes (red text) in tissues and cellular compartments (source: Pörtner et al. 2014; after Pörtner 2008)
Figure 5 – Mercury (Hg) cycle: atmospheric and oceanic Hg sources; oxidation – reduction,
[elemental Hg (Hg0), inorganic Hg (HgII) and methylmercury (MeHg)]; bioaccumulation and biomagnification throughout the marine food chain.
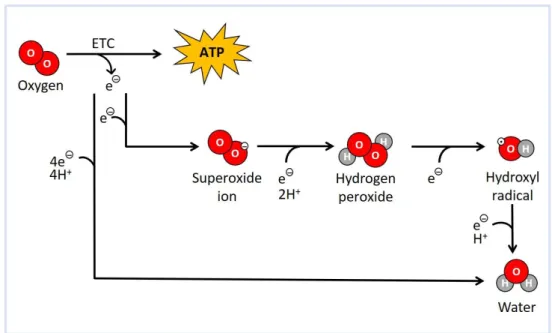
Figure 6 – Routes of oxygen (O2) metabolism in marine organisms and reactive oxygen species (ROS) formation. Electron transport chain (ETC) as an electron (e-) source during
the reduction of O2 to produce adenosine triphosphate (ATP). One-electron reduction sequencing causing the formation of ROS, such as: superoxide ion (O2-), hydrogen peroxide (H2O2) and hydroxyl radical (OH•), with water (H2O) as a final product. Four-electron reduction of O2 to form H2O (adapted from Lushchak 2011).
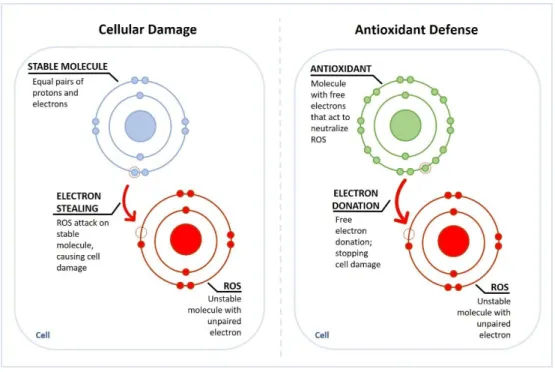
Figure 7 – Schematics of reactive oxygen species (ROS) action within the cell: electron stealing
of a stable molecule, causing cell damage (left side); electron donation by an antioxidant, avoiding cell damage (right side).
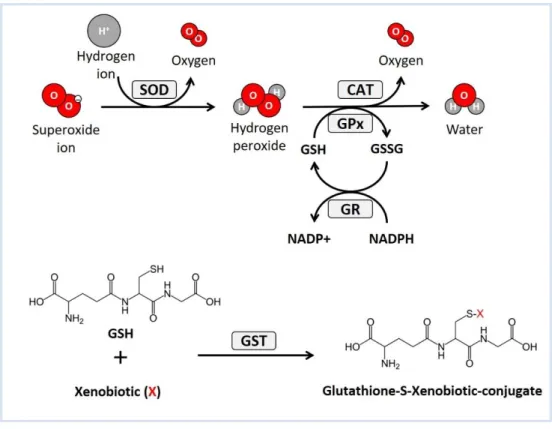
Figure 8 – Schematics of the activity of superoxide dismutase (SOD), catalase (CAT) and
glutathione peroxidase (GPx) against reactive oxygen species (ROS), and glutathione-S-transferase (GST) against xenobiotics.
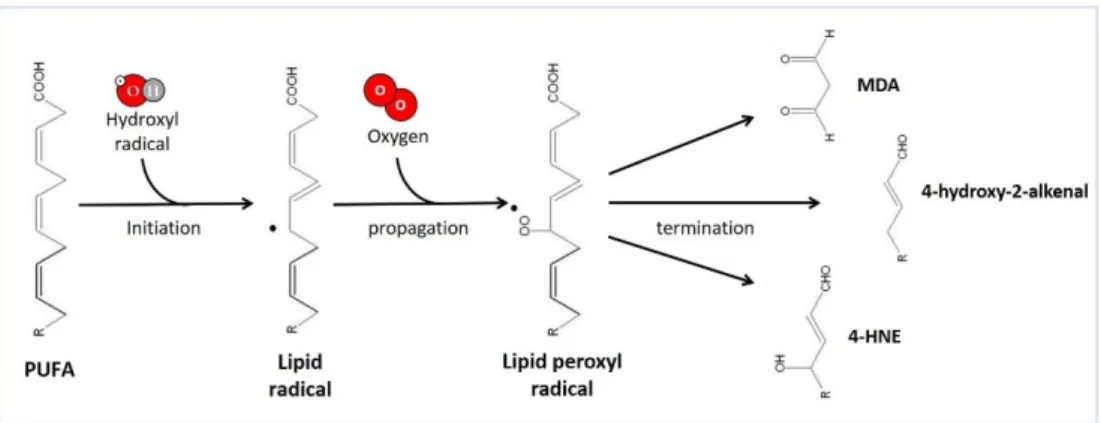
Figure 9 – Lipid peroxidation of polyunsaturated fatty acids (PUFA)
Chapter 2
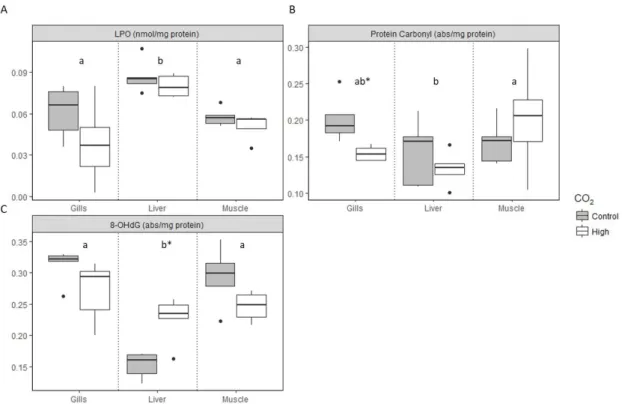
Figure 1 – Impact of high CO2 exposure on levels of: (A) LPO, (B) Protein carbonyl, and (C) 8-OHdG levels in C. plagiosum tissues. The horizontal line within the box indicates the median, boundaries of the box indicate the 25th and 75th percentiles, and the whiskers indicate the highest and lowest values of the results. Different letters represent significant differences between tissues, while asterisks (*) represent significant differences within tissues. GLM analyses described in Supplemental TablesS2 and S5.
Figure 2 – Impact of high CO2 exposure on levels of: (A) SOD, (B) CAT, (C) GPx, (D) Aconitase activities, and (E) TAC in C. plagiosum tissues. The horizontal line within the box indicates the median, boundaries of the box indicate the 25th and 75th percentiles, and the whiskers indicate the highest and lowest values of the results. Different letters represent significant differences between tissues, while asterisks (*) represent
17
significant differences within tissues. GLM analyses described in Supplemental TablesS3 and S6.
Figure 3 – Impact of high CO2 exposure on protein repair and removal, namely: (A) HSP and (B) Ub levels in C. plagiosum tissues after 50days exposure to high CO2. The horizontal line within the box indicates the median, boundaries of the box indicate the 25th and 75th percentiles, and the whiskers indicate the highest and lowest values of the results. Different letters represent significant differences between tissues, while asterisks (*) represent significant differences within tissues. GLM analyses described in Supplemental TablesS4 and S7.
Chapter 3
Figure 1 – Diagram of the experimental design. Parental generation (F0): C – amphipods reared
under control pCO2 levels; H – amphipods reared under elevated pCO2 levels. Offspring generation (F1): offspring reared under the same treatment as their progenitors (continues line) [Control (C–C) or High CO2 (H–H)]; or reared on the opposing treatment (dotted line) [High CO2 – Control (H–C) or Control – High CO2 (C–H)].
Figure 2 – Impact of high CO2 exposure on: A) LPO (nmol mg-1 total protein); and B) DNA damage (relative abs mg-1 total protein) levels in G. locusta parents and offspring’s. Values represent mean ± SD. Different letters represent significant differences between treatments identified by GLM analyses which are described in Supplemental Tables SII and SIII.
Figure 3 – Impact of high CO2 exposure on: A) HSP (µg mg-1 total protein); and B) Ub (µg mg-1 total protein) levels in G. locusta parents and offspring’s. Values represent mean ± SD. Different letters represent significant differences between treatments identified by GLM analyses which are described in Supplemental Tables SIV and SV.
Figure 4 – Impact of high CO2 exposure on: A) SOD (% Inhibition min-1 mg-1 protein); B) CAT (nmol min-1 mg-1 total protein); C) GPx (nmol min-1 mg-1 total protein); D) GST (nmol min-1 mg-1 total protein) activities; and E) TAC (mM Trolox mg-1 total protein) levels in G. locusta parents and offspring’s. Values represent mean ± SD. Different
letters represent significant differences between treatments identified by GLM analyses which are described in Supplemental Tables SVI-SXI.
Chapter 4
Figure 1 – Antioxidant enzyme activities in Veretillum cynomorium under ocean warming and
acidification conditions: (A) Catalase (CAT) and (B) Glutathione S-transferase (GST). Values represent mean ± standard deviation.
Figure 2 – Lipid peroxidation (MDA - malondialdehyde) levels in Veretillum cynomorium under
ocean warming and acidification conditions. Values represent mean ± standard deviation.
Figure 3 – Heat shock protein (HSP70/HSC70) concentrations in Veretillum cynomorium under
ocean warming and acidification conditions. Values represent mean ± standard deviation.
Chapter 5
Figure 1 – Survival (%) of S. canicula exposed to different combinations of temperature and
HgCl2 contamination for 7 days. GLM analyses described in Supplemental Table SI.
Figure 2 – Total mercury (HgT) accumulation in S. canicula capsule. The horizontal line within
the box indicates the median, boundaries of the box indicate the 25th and 75th percentiles, and the whiskers indicate the highest and lowest values of the results. Different letters represent significant differences between treatments. GLM analyses described in Supplemental Table SII.
Figure 3 – Total mercury (HgT) accumulation in S. canicula tissues. The horizontal line within
the box indicates the median, boundaries of the box indicate the 25th and 75th percentiles, and the whiskers indicate the highest and lowest values of the results. Different letters represent significant differences between tissues, while asterisks (*) represent significant differences between contamination treatments. GLM analyses described in Supplemental Table SIII.
Figure 4 – Impact of HgCl2 and warming exposure on levels of: A) Heat shock proteins (HSP) and B) Ubiquitin (Ub) in S. canicula tissues. The horizontal line within the box
19
indicates the median, boundaries of the box indicate the 25th and 75th percentiles, and the whiskers indicate the highest and lowest values of the results. Different letters represent significant differences between tissues, while asterisks (*) and cardinals (#) represent significant differences between contamination and temperatures, respectively. GLM analyses described in Supplemental Tables SIV and SV.
Figure 5 – Impact of HgCl2 and warming exposure on levels of: A) Lipid peroxidation (LPO) and B) DNA damage levels in S. canicula tissues. The horizontal line within the box indicates the median, boundaries of the box indicate the 25th and 75th percentiles, and the whiskers indicate the highest and lowest values of the results. Different letters represent significant differences between tissues, while cardinals (#) represent significant differences between temperatures. GLM analyses described in Supplemental Tables SVI and SVII.
Figure 6 – Impact of HgCl2 and warming exposure on: A) Superoxide dismutase (SOD), B) Catalase (CAT), C) Glutathione peroxidase (GPx), D) Glutathione S-Transferase (GST), E) Acetylcholinesterase (AChE) activities and F) Total antioxidant capacity (TAC) in S. canicula tissues. The horizontal line within the box indicates the median, boundaries of the box indicate the 25th and 75th percentiles, and the whiskers indicate the highest and lowest values of the results. Different letters represent significant differences between tissues, while asterisks (*) and cardinals (#) represent significant differences between contamination and temperatures, respectively. GLM analyses described in Supplemental Tables SVI-SXI.
Chapter 6
Figure 1 - Total mercury (HgT) accumulation (mean ± SE) in A. regius: a) Differences among
tissues (muscle, gills and liver); and shaped by interactions between temperature (19 and 23 ºC) and CO2 (400 and 1500 µatm) within b) muscle, c) gills and d) liver, respectively. Graphs were plotted according to significant factors yielded by GLM analysis described in Table 1 and 2, respectively.
Figure 2 - Malondialdehyde (MDA) build-up concentrations (mean ± SE) in A. regius muscle driven by an interaction between MeHg contamination (Non-contaminated and
contaminated) and temperature (19 and 23 ºC). Graphs were plotted according to significant factors yielded by GLM analysis described in Table 3 and 4, respectively.
Figure 3 - a) Catalase (CAT) enzyme activities (mean ± SE) driven by MeHg contamination (Non-contaminated and Contaminated). b) Superoxide dismutase (SOD) activities (mean ± SE) in A. regius muscle driven by an interaction temperature (19 and 23 ºC) and CO2 (400 and 1500 µatm). Graphs were plotted according to significant factors yielded by GLM analysis described in Table 4.
Figure 4 -Glutathione S-Transferase (GST) activities (mean ± SE) in A. regius muscle driven by: a) an interaction between temperature (19 and 23 ºC) and CO2 (400 and 1500 µatm); and b) an interaction between MeHg contamination (Non-contaminated and contaminated) and CO2 (400 and 1500 µatm). Graphs were plotted according to significant factors yielded by GLM analysis (triple interaction) described in Table 4.
Figure 5 -Heat shock protein70 (Hsp70) concentrations (mean ± SE) in A. regius: a) tissues; b) in the gills shaped by MeHg contamination (Non-contaminated and Contaminated) and CO2 (400 and 1500 µatm); in the c) muscle shaped by an interaction between temperature (19 and 23 ºC) and CO2 (400 and 1500 µatm); and in the d) liver shaped by an interaction between MeHg contamination (Non-contaminated and Contaminated) and CO2 (400 and 1500 µatm). Graphs were plotted according to significant factors yielded by GLM analysis described in Table 5.
21
List of Tables
Chapter 3
Table I – Summary table of the oxidative damage (LPO and DNA), protein repair and removal
mechanisms (HSP and Ub) and antioxidant response (SOD, CAT, GPx and GST activities and TAC) in G. locusta following within- and transgenerational exposure to ocean acidification
Chapter 6
Table I – GLM analysis of A. regius Fulton’s K and total mercury (HgT) concentration in tissues
(3 levels within contaminated treatments: liver, muscle and gills) exposed to MeHg contamination (2 levels: non-contaminated and contaminated) for 30 days. Model formula on top, family and respective model AIC in the bottom. Est – Estimates; Std Error – Standard Error. Bold values indicate p < 0.05. For more details please see the R script in Supplemental Data.
Table II – GLM analysis of total mercury concentration (HgT) within each sampled tissue (liver,
muscle and gills) of A. regius exposed to MeHg for 30 days, under crossed treatments of temperature (T, 2 levels: 19 ºC and 23 ºC) and CO2 (CO2, 2 levels: 400 µatm and 1500 µatm). Model formula on top, family and respective model AIC in the bottom. Est – Estimates; Std Error – Standard Error. Bold values indicate p < 0.05. For more details please see the R script in Supplemental Data.
Table III – GLM analysis of malondialdehyde (MDA) build-up in A. regius after 30 days exposed
to crossed treatments of MeHg contamination (MeHg, 2 levels, non–contaminated and contaminated) and temperature (T, 2 levels: 19 ºC and 23 ºC). Model formula on top, family and respective model AIC in the bottom. Est – Estimates; Std Error – Standard Error. Bold values indicate p < 0.05. For more details please see the R script in Supplemental Data.
Table IV – GLM analysis of oxidative stress response (CAT, SOD and GST) in A. regius after 30
days exposed to crossed treatments of MeHg exposure (MeHg, 2 levels: non– contaminated and contaminated), temperature (T, 2 levels: 19 ºC and 23 ºC) and
CO2 (CO2, 2 levels: 400 µatm and 1500 µatm). Model formula on top, family and respective model AIC in the bottom. Est – Estimates; Std Error – Standard Error. Bold values indicate p < 0.05. For more details please see the R script in Supplemental Data.
Table V – GLM analysis of heat shock protein 70 (Hsp70) production in A. regius tissues (gills,
muscle and liver) and, posteriorly within tissues, under crossed treatments of MeHg exposure (MeHg, 2 levels, non–contaminated and contaminated), temperature (T, 2 levels: 19 ºC and 23 ºC) and CO2 (CO2, 2 levels: 400 µatm and 1500 µatm). Model formula on top, family and respective model AIC in the bottom. Est – Estimates; Std Error – Standard Error. Bold values indicate p < 0.05. For more details please see the R script in Supplemental Data.
Chapter 7
23
General
Introduction
1.1.
Global Climate Change – A high CO
2World
“Climate change is no longer some far-off problem; it is happening here, it is happening now”
- Barack Obama
he 18th century was known in the history of mankind as the Era of change, where simple hand using tools were replaced by powered machinery and factories, nonetheless, this era of growth and expansion did not come without a cost (Allen 2010). With the Industrial Revolution, man began the burning of fossil fuels - coal, oil and natural gas - increasing the amount of greenhouse gases (GHG) emissions - carbon dioxide (CO2), methane (CH4), nitrous oxide (N2O) and ozone (O3) - into the atmosphere (IPCC 2014). This continuous emission of GHG is acting as a thick blanket around the Earth, absorbing the heat radiation resultant from the Sun, in a phenomenon known as the greenhouse effect, increasing the average global surface temperature (see Fig. 1a; Black and Weisel 2010). Additionally, increasing human pressures - habitat modification and pollution - started what years after we became to acknowledge as Climate Change1.
Carbon dioxide (CO2) emissions, one of the main GHG, that has been relatively stable during the 10,000 years preceding the Industrial Revolution, with levels ranging around 280 ppm, has increased 80% in the last two centuries, reaching for the first time in human history levels consistently above 400 ppm (see Fig. 1b; IPCC 2014; Lüthi et al. 2008). Furthermore, and unless anthropogenic CO2 emissions are reduced, they are predicted to reach ~1000 ppm until the end of the century (Gattuso and Hansson 2011; Pörtner et al. 2014).
1 The United Nations Framework Convention on Climate Change (UNFCCC) defined climate change has the direct and indirect causes of
human activities, while climate variability refers to natural causes.
The CO2 concentration in the Earth’s atmosphere is naturally absorbed and emitted as part of the carbon cycle. In fact, CO2 reaches the atmosphere through various “sources” and can be partly reabsorbed by “reservoirs” – oceans, lakes, rivers and plants (Pittock 2009). Nonetheless the unreasonable burning of fossil fuels and changes in the land use - deforestation, industrialization and urbanization - caused the atmospheric CO2 concentration to rise above the Earth capacity (Black and Weisel 2010).
a
b
Figure 1 – (a) Diagram of the greenhouse effect: greenhouse gases (CO2, N2O, O3, CH4) sources
and the capture of solar heat, increasing atmospheric temperature; (b) Annual average CO2
25
With the Earth warmed by almost 2 ºC since pre-industrial times, we are now witnessing sea-level rising, causing the flooding of coastal cities and changing weather patterns, which will culminate in stronger storms, and severe droughts, resulting in an additional 80,000 km2 of grass and farmland turned into desserts each year (Black and Weisel 2010). In fact, the Earth is now warming so fast that it is believed that we are half-way to reach a tipping point. Additionally, future projections point out to a further 1.1-6.4 ºC increment until 2100, as well as an increase in the severity and frequency of heat waves (Pörtner et al. 2014).
1.2.
Ocean under High CO
2The ocean is by far the most dominant feature of our planet, covering around 70% of the Earth’s surface, and representing 97% of the Earth’s total water content, it pertains 99% of the world’s entire biosphere (Costello et al. 2015; Kaiser et al. 2005; Reid 2016). With almost 40% of the world entire population living near the coastal areas (within 60 km distance), the anthropogenic pressure in the world’s ocean is extremely high (Kaiser et al. 2005).
Being one of the most efficient CO2 “reservoir”, the ocean plays a key role in mitigating climate change, decreasing atmospheric CO2 build-up by absorbing more than 25% of the current global anthropogenic CO2 emissions (~106 metric tons of CO2 per hour), and storing more than 90% of the atmospheric heat content (Pörtner et al. 2014).
The rise in atmospheric CO2 concentration and the greenhouse effect is also increasing average sea surface temperature (SST; Fig. 2a), which has risen by 0.1 ºC per decade since pre-industrial times, and with predictions pointing out to a further 1-4 ºC rise until 2100 (Collins et al. 2013; Rosa et al. 2014). Moreover, as CO2 dissolves in the seawater, a chemical chain of reactions is expected to occur (see Fig. 2b). Firstly, carbonic acid (H2CO3) is produced and can be further dissociated into bicarbonate ions (HCO3-1), with the additional formation of hydrogen ions (H+), which will decrease the seawater pH, contributing to a process known as ocean acidification (OA) (Caldeira and Wickett, 2003; Doney et al., 2009; Zeebe and Ridgwell, 2011). Surface-ocean pH levels, that have been relatively stable for over 800 million of years, have dropped 0.1 units since pre-industrial times – representing a 30% increase in ocean acidity - and if anthropogenic CO2 emissions continue to increase, it is forecast to a further 0.13-0.42 pH unit drop until the end
of this century (~100-150 % H+ increase) (Caldeira and Wickett 2005; Gattuso and Hansson 2011; Pörtner et al. 2014).
Future ocean climate-related changes are expected to challenge marine organisms across all levels of biological organization - from molecular to organism level - affecting population, communities and ecosystems dynamics (Fabry et al. 2008; Harvey et al. 2013; Pörtner et al. 2005; Pörtner et al. 2004).Furthermore, these changes could affect species physiology, causing shifts in species distribution (Edwards and Richardson 2004; Harvey et al. 2013; Kroeker et al. 2013; Parmesan and Yohe 2003), ultimately leading to worldwide extinction events (Thomas et al. 2004). Nonetheless, we should bear in mind that the response towards climate change is species-specific, varying among taxonomic groups, trophic level and life stages (e.g. early life stages are more vulnerable than adults), and dependent upon the stressor to which they are exposed to (Byrne 2011; Dupont and Thorndyke 2009; Halpern et al. 2007).
Some of the major effects of ocean warming and acidification, known to date, on marine organisms are summarized below.
27 a
b
Figure 2 – (a) Projected changes in annual average surface temperature for 2081-2100,
according to RCP2.6 and 8.5 (source: IPCC 2014); (b) Ocean acidification schematics of the fate of carbon dioxide (CO2) as it dissolves in the seawater, and the consequences of decreased
1.2.1.
Ocean Warming
Temperature is a key factor known to influence marine organisms, especially marine ectotherm2 performance and physiology. It determines species distribution, across latitudinal and depth ranges, and within the organisms’ optimum thermal window, it can even benefit them, as slightly increases in temperature can provide more food sources and energy for biological and biochemical processes (e.g. growth, reproduction, etc.) (Pörtner et al. 2001; 2005). Nonetheless, OW is expected to reduce the amount of dissolved oxygen (O2; already decreased at a rate of 0.1 to > 0.3 µmol kg-1 yr-1) in the ocean, once O
2 solubility is temperature-dependent, therefore increasing ocean stratification and expansion of oxygen minimum zones (OMZs) (Reid 2016; Schmidtko et al. 2017; Stramma et al. 2010). This will limit the amount of O2 that reaches deeper waters and threaten the survival of water-breathing marine organisms, reducing the nutrient availability, and consequently primary production (Pörtner 2001 ; Pörtner et al. 2000; Pörtner and Knust 2007). Additionally, and considering that marine organisms live and function within limited temperature ranges (Topt), it is expected that beyond those limits (Tp – pejus), the metabolic demand and oxygen consumption increases, forcing aerobic organisms to adopt an anaerobic strategy. This may cause other downstream events, such as decreased growth and reproduction, and the activation of antioxidant and heat-shock defenses mechanisms to avoid cellular damage (see the oxygen and capacity limited thermal tolerance concept (OCLTT) in Fig. 3; Pörtner 2002; 2010; 2012; Pörtner and Farrell 2008; Pörtner and Knust 2007).
Furthermore, OW is also changing species’ phenology3, which will shift organisms’ spawning, migration and dispersal seasons, affecting reproduction and life cycle timing, ultimately driving prey-predator mismatches (Drinkwater et al. 2010; Magnan and Gattuso 2016). Temperature is also known to influence swimming performance and the activity rates of marine fishes, which will affect both predator avoidance and feeding success (Fuiman et al. 2005; 2006). As mentioned above, increases in SST changes species’ geographical distribution, but when temperature suppresses species thermal limits, while some may move to an optimal thermal niche or expand their geographical range, others may withdrawal and even disappear (Eddy and Handy 2012; Perry et al. 2005). This will increase the invasion of alien4 species, that will compete
2 Organisms’ whose body temperature regulation depends on the surrounding environment 3 Timing of biological events
29
with native species for food and habitat, disrupting trophic interactions and community structure (Bellard et al. 2013).
Figure 3 – Schematics of the thermal window of oxygen and capacity limited thermal tolerance
concept (OCLTT) of marine organisms. Optimum temperature (Topt) correspond to the
temperature which a specific performance (e.g. growth, reproduction) is maximal. Pejus temperatures (Tp) correspond to the first temperature threshold to which a specific animal has
a time-limited tolerance. Critical temperatures (Tc) is the second temperature threshold, where
O2 availability becomes insufficient, demarks the beginning of the anaerobic metabolism.
Denaturation temperature (Td) is characterized by the onset of cell and protein damage. Full
black curve represents the performance curve under normal conditions. Dashed grey curve represent the performance curve options under OA and/or hypoxic seawater (source: Pörtner et al. 2014, following Pörtner 2002; 2012; Pörtner and Farrell 2008).
Warming is also threatening one of the most diverse ecosystems in our planet - coral reefs. As temperature rise the symbiosis between corals and zooxanthellae is disrupted, in a phenomenon known as coral bleaching (Glynn 1996). This disruption between the zooxanthellae and their host, which is primarily initiated with the overproduction of reactive oxygen species (ROS) in the symbiont photosystem II (Downs et al. 2002; Lesser 1997; Mydlarz et al. 2009), is one of the major threats to coral health, limiting their reproduction and causing coral death, ultimately culminating into habitat lost, decreased biodiversity and local extinction (Carpenter et al. 2008; Hoegh-Guldberg 1999; Hoegh-Guldberg et al. 2007).
1.2.2.
Ocean Acidification
The consequences of decreasing seawater pH are extremely vast, and while some organisms are known to thrive under such conditions – primary producers using CO2 as an inorganic carbon source – to others OA is known to have far-reaching consequences, ultimately leading to biodiversity loss, with repercussions at the community- and ecosystem-level (Cattano et al. 2018; Connell et al. 2018; 2013; Hernández-Hernández et al. 2018; Kroeker et al. 2010; Nagelkerken and Connell 2015).
Key calcifying organisms, such as mollusks, crustaceans, echinoderms and corals will be especially vulnerable under OA (Kroeker et al. 2010; Wittmann and Pörtner 2013). This is due to the fact that CO2 is reducing the concentration of carbonate ions (CO3-2), that will compete for calcium ions (Ca2+) with the highly reactive H+ ions. Consequently, this will decrease the concentration of calcium carbonate ions (CaCO3), and the saturation state (Ω) of calcite, magnesium-calcite and aragonite minerals in seawater surface, the building blocks of marine organisms’ shells and skeletons (see Fig.2b; Cao et al. 2007; Delille et al. 2005; Doney et al. 2009; Knoll and Fischer 2011).
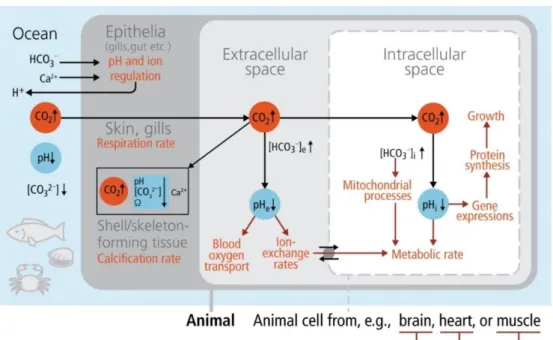
Additionally, OA is also expected to induce changes in the acid-base balance of marine organisms (Fig. 4). As CO2 increases, H+ ions are released and even though some marine organisms (i.e. fishes and crustaceans) have the ability to adjust their internal pH through active ion transport (i.e. HCO3– increase and/or H+ excretion), the assumption that such compensation will provide them a wide CO2 tolerance could be overestimated (Heuer and Grosell 2014). In fact, increased acid-base regulation may have energetic costs, causing other downstream consequences, such as impaired growth (Baumann et al. 2012; Heuer and Grosell 2014), reduced metabolic performance (Rosa and Seibel 2008), decreased oxygen binding and delivery (Pörtner et al. 1998; Pörtner and Reipschlöger 1996), altered behavior (i.e. prey-predator interaction, dispersal, settlement and habitat choice) (Clements and Hunt 2014; Dixson et al. 2010; Nagelkerken and Munday 2015), impaired protein function – causing oxidative stress and damage (discussed later on this chapter) (Dean 20010; Hu et al. 2011; Tomanek 2011) – ultimately increasing mortality (Baumann et al. 2012; Pörtner and Reipschlöger 1996).
31
Figure 4 – Schematic response of a marine organism to OA. Effects are mediated via diffusive
CO2 entry (black arrows) into the body and cell compartments, resulting in a rise in pCO2
(highlighted in red), a drop in compartmental pH (highlighted in blue), and their effects (red arrows) on various processes (red text) in tissues and cellular compartments (source: Pörtner et al. 2014, after Pörtner 2008)
1.3.
Contamination under Climate change
Human activities are changing the marine environment, not only by inducing climate-related changes, such as OW and OA, but also through the boost of contamination. Anthropogenic activities, such as mining processes, chemical combustion, agriculture activities, medical wastes and sewage discharge, are increasing the load of pollutants – organic chemicals, litter, debris and heavy metals etc. – in aquatic systems, especially when considering coastal areas (Clarkson et al. 2003; He et al. 2005; Tchounwou et al. 2012). The increase of toxic chemicals into coastal areas can result in harmful effects on marine wildlife, ecosystem degradation, ultimately causing human poisoning (Fung et al. 2004; Ip et al. 2004; Morton and Blackmore 2001).
The major source of waste release to marine environments is due to domestic and industrial sewage discharges. Sewage encompasses a vast array of pathogens (e.g. Salmonella spp., Escherichia coli, Streptococcus sp., fungus and viruses) (Grillo et al. 2001; Islam and Tanaka 2004), which
decreases O2 concentration in the seawater, due to bacterial activity, and increases nutrient levels, increasing algal blooms and consecutively toxin production (Bonsdorff et al. 1997; Hernandez et al. 1998; Islam and Tanaka 2004).
Additionally, pesticides resulting from agriculture activities contribute to almost 50 % of the total marine pollution. Due to its wide application in pest control and persistency in the environment (i.e. low degradability rate), pesticides release high levels of NH4 and NO3, being a major contributor to OA (Islam and Tanaka 2004). Pesticides are also known to have harmful effects on organisms’. At sublethal levels they cause neurotransmission disruption (Casida 2009) and interfere with pheromonal systems – reducing matting success (Park and Propper 2002). Furthermore, they also affect organisms’ health, instigating cellular and molecular damage, ultimately leading to the death of the organism (Islam and Tanaka 2004).
1.3.1.
Heavy metals - the mercury case
Heavy metals are naturally occurring constituents of the marine environment, and by-products of industrial processes. Metals are non-degradable and persistent in the environment, accumulating in sediments in the sea floor, or absorbed by marine organisms, entering the food chain – bioaccumulated by marine organisms – and transferred to higher tropic levels – biomagnified (Bryan and Darracott 1979; Rainbow and Luoma 2011; Wang et al. 2002). Furthermore, the ten most toxic heavy metals in marine environments are, in order of increasing toxicity: zinc, arsenic, chromium, copper, lead, selenium, nickel, silver, cadmium and mercury (Davies 1978).
Being one of the most hazardous heavy metals for all living organisms, mercury (Hg) is usually found in the natural environment in three different forms: elemental Hg (Hg0), inorganic Hg (HgII) and organic Hg [methylmercury (MeHg: CH
3Hg)] (see Fig. 5). As HgII reaches the seawater it can either be reduced into Hg0 and released to the atmosphere or methylated by bacteria into MeHg, increasing Hg bioavailability, bioaccumulation and biomagnification in marine food webs (Boening 2000; Braune et al. 2015; Jaishankar et al. 2014). The adverse effects of Hg on marine organisms depend on its speciation, the extent of exposure (frequency, quantity and duration) and individuals life stage (Clarkson and Magos 2006).
33
Figure 5 – Mercury (Hg) cycle: atmospheric and oceanic Hg sources; oxidation – reduction,
methylation – demethylation and deposition processes of different Hg forms [elemental Hg (Hg0), inorganic Hg (HgII) and methylmercury (MeHg)]; bioaccumulation and biomagnification
throughout the marine food chain.
Specifically, Hg accumulation is known to be tissue-specific, accumulating preferentially in the gills – the main entrance into the body – and in lipid-rich organs such as the liver (Cairns et al. 1975; Jezierska and Witeska 2006). Furthermore, due to its high affinity for the thiol group of proteins, Hg effects on marine organisms can be extremely vast, including: i) organ function loss (Gonzalez et al. 2005); ii) accumulation of ROS in organisms’ cells due to impaired antioxidant defense mechanisms, increasing the vulnerability towards oxidative stress and damage (Berntssen et al. 2003; Gonzalez et al. 2005; Mieiro et al. 2010; Tchounwou et al. 2012) and ultimately iii) death (Coccini et al. 2000). Additionally, Hg can also block ion channels or be transported along the central nervous system, causing neurotoxicity (Clarkson et al. 2003; Lürling 2015), and consequently impaired behavior patterns, such as predator avoidance (Berntssen et al. 2003; Boyd 2010; Sampaio et al. 2016; Sloman 2007).
![Figure 5 – Mercury (Hg) cycle: atmospheric and oceanic Hg sources; oxidation – reduction, methylation – demethylation and deposition processes of different Hg forms [elemental Hg (Hg 0 ), inorganic Hg (Hg II ) and methylmercury (MeHg)]; bioaccumulation](https://thumb-eu.123doks.com/thumbv2/123dok_br/19257440.978132/49.892.170.727.98.557/atmospheric-oxidation-reduction-methylation-demethylation-deposition-methylmercury-bioaccumulation.webp)