Faculdade de Motricidade Humana
Morphological ultrasound evaluation in
acute and chronic muscle overloading
Avaliação ecográfica da morfologia muscular perante situações de sobrecargaagudas e crónicas
Rute Andreia Martins dos Santos
Orientador: Professor Doutor Paulo Alexandre Silva Armada da Silva Tese elaborada com vista à obtenção do grau de Doutor em Motricidade Humana na especialidade de Biomecânica
Júri:
Presidente
Doutor Francisco José Bessone Ferreira Alves
Professor Catedrático e Presidente do Conselho Científico da Faculdade de Motricidade Humana da Universidade de Lisboa
Vogais
Doutor António Prieto Veloso
Professor Catedrático da Faculdade de Motricidade Humana da Universidade de Lisboa Doutora Filipa Manuel Machado de Sousa
Professora Auxiliar da Faculdade de Desporto da Universidade do Porto Doutor Paulo Alexandre Silva Armada da Silva
Professor Auxiliar da Faculdade de Motricidade Humana da Universidade de Lisboa Doutora Filipa Oliveira da Silva João
Professora Auxiliar da Faculdade de Motricidade Humana da Universidade de Lisboa Doutora Sandra Moreira Rua Ventura
Professora Adjunta da Escola Superior de Saúde do Porto do Instituto Politécnico do Porto Doutor Sérgio Saraiva Alves
Faculdade de Motricidade Humana
Morphological ultrasound evaluation in
acute and chronic muscle overloading
Avaliação ecográfica da morfologia muscular perante situações de sobrecargaagudas e crónicas
Rute Andreia Martins dos Santos
Orientador: Professor Doutor Paulo Alexandre Silva Armada da Silva Tese elaborada com vista à obtenção do Grau de Doutor em Motricidade Humana na Especialidade de Biomecânica.
Tese por compilação de artigos, realizada ao abrigo da alínea a) do no2 do art.º 31o do Decreto-Lei no 230/2009
Júri: Presidente
Doutor Francisco José Bessone Ferreira Alves
Professor Catedrático e Presidente do Conselho Científico da Faculdade de Motricidade Humana da Universidade de Lisboa
Vogais
Doutor António Prieto Veloso
Professor Catedrático da Faculdade de Motricidade Humana da Universidade de Lisboa Doutora Filipa Manuel Machado de Sousa
Professora Auxiliar da Faculdade de Desporto da Universidade do Porto Doutor Paulo Alexandre Silva Armada da Silva
Professor Auxiliar da Faculdade de Motricidade Humana da Universidade de Lisboa Doutora Filipa Oliveira da Silva João
Professora Auxiliar da Faculdade de Motricidade Humana da Universidade de Lisboa Doutora Sandra Moreira Rua Ventura
Professora Adjunta da Escola Superior de Saúde do Porto do Instituto Politécnico do Porto Doutor Sérgio Saraiva Alves
Nome: Rute Andreia Martins dos Santos
Endereço eletrónico: [email protected]
Número do Cartão de Cidadão: 12662253
Título: Morphological ultrasound evaluation in acute and chronic muscular
overload
Orientador:
Professor Doutor Paulo Alexandre Silva Armada da Silva
Ano de conclusão: 2017
Designação do ramo de conhecimento do Doutoramento:
Motricidade Humana na Especialidade de Biomecânica
____________________________________________________
É AUTORIZADA A REPRODUÇÃO INTEGRAL DESTA
TESE/TRABALHO APENAS PARA EFEITOS DE INVESTIGAÇÃO,
MEDIANTE DECLARAÇÃO ESCRITA DO INTERESSADO, QUE A TAL SE
COMPROMETE.
____________________________________________________
Faculdade de Motricidade Humana – Universidade de Lisboa Cruz Quebrada, ___ de Outubro de 2017
______________________________________________
Dedicated to:
Acknowledgments
The accomplishment of this work would not have been possible without the support of several person to whom I am very grateful.
I would like to express my gratitude to my academic supervisor Doctor Paulo Armada da Silva, for all the expertise indications and scientific ideas, for the support to publish articles, and for all advises and patience.
This thesis followed different path from the beginning established research project and Doctor Paulo Armada da Silva supported the progress of this work.
I am grateful for the funding provided by my institution, Coimbra Health School of Polytechnic Institute of Coimbra, Portugal. And I would like to thanks to the President Doctor Jorge Conde for all approvals for equipment use and for the encouragement during the completion of this thesis.
I would like to thank Faculdade de Motricidade Humana from Universidade de Lisboa and Laboratório de Biomecânica e Morfologia Funcional, for all support. I am also grateful to head of the laboratory Doctor António Veloso, and his important collaborators Doctor Filipa João, Doctor Vera Moniz-Pereira and Doctor Sandro Freitas for all the availability and support. To Doctor Pedro Mil-Homens, thank you for all the concern and encouragement.
My sincere thanks to all participants who contributed in some way to the work described in this thesis.
To my best and “problematic” friends that stay, talk, laugh and cry or not with me in the right moments, and to those that for some moments in the last years were important to me, but the life let me apart from them, thank you. Cristina Farinha, Catarina Coelho, Marisa Henriques, Sofia Leite and Tânia Valente a special thanks to you. I am grateful, also, to Filipa Borlinhas and Rui Oliveira with all their encouragement. I am especially thankful to Luís Carrão, Maria João Valamatos, Sílvia Cabral, who greatly supported and encouraged my work and with whom I spend good research moments.
I would like to acknowledge friends and family who supported me during this study. First I would like to thank to my lovely sister for all the support and help, to my parents, my brother and my brothers-in-law for all the motivation and encouragement. To Hélder Almeida for the patience and support in these years of my professional
dedication. And thank for my all friends that directly or indirectly help me in this journey.
To my department colleagues, specially to Adelino Santos, Mário Monteiro, and my other friends and colleges Nádia Osório, Lucia Simões, Paulo Caseiro and Cristina Girão for all the friendship and for encourage and by keeping me harmonious. I am grateful to Graciano Paulo for his support and friendship.
I would like to make a special thanks to my friend and colleague Joana Santos for encouragement, and for her complementary input and for all the interest in my work. This thesis was a long journey that would not have been possible if I was not surrounded by good friends and a very supportive family that have always been there for me.
Publications and conference presentations
Full papers:
Santos, R., Armada-da-Silva, P. Reproducibility of ultrasound-derived muscle thickness and echo-intensity for the entire quadriceps femoris muscle, Radiography 23 (2017) e51ee61 doi: 10.1016/j.radi.2017.03.011
Oral communications:
Santos, R., Armada-da-Silva, P. Reproducibility of ultrasound parameters (echo-intensity and thickness) of quadriceps muscle. European Congress of Radiology, European Society of Radiology, Vienna, Austria, 6th-10th March 6-10, 2015.
Santos, R., Valamatos, M.J., Mil-Homens, P., Armada-da-Silva, P.A.S. Elasticity characterisation of vastus lateralis muscle by ultrasound quasi-static elastography. European Congress of Radiology, European Society of Radiology, Vienna, Austria, March 1-5, 2017.
Poster communications:
Santos, R., Armada-da-Silva P. Reproducibility of ultrasound parameters (echo-intensity and thickness) of quadriceps muscle. Electronic Presentation Online System EPOS, European Congress of Radiology, European Society of Radiology, Vienna, Austria, March 6-10, 2015.
Santos, R., Valamatos, M.J., Mil-Homens, P., Armada-da-Silva, P. Elasticity characterisation of vastus lateralis muscle by ultrasound quasi-static elastography. Electronic Presentation Online System EPOS, European Congress of Radiology, European Society of Radiology, Vienna.
Armada-da-Silva, P., Santos, R., Valamatos, M.J., Mil-Homens, P. Increased vastus lateralis’ hardness after 15 weeks of resistance training: an ultrasound strain elastography study. 22nd Congress of the European College of Sports Science, Essen,
Abstract
Introduction: Ultrasound (US) has an important role in musculoskeletal (MSK) evaluation, allowing the study of muscle morphology and function. Muscle thickness (MT) and muscle echo-intensity (EI) are two important parameters that may quantify muscle structural adaptations to a variety of stimuli. US elastography can also offer semi-quantitative and/or quantitative assessment of tissue stiffness providing relevant information about adaptations of muscle mechanical properties.
Purpose: The general aim of the studies presented in this thesis is to explore the potential of quantitative US imaging for assessing the adaptations and responses of the muscle tissue to increased contractile activity using B-mode US and US elastography. The studies were centred on the quadriceps femoris muscle and addressed the study of the effect of strength training and of acute muscle contractile activity on MT, EI and muscle stiffness.
Materials and methods: Three different studies were conducted and reported along this thesis. A total of 64 young adults of both genders participated in the studies. The first study (N = 20) evaluated the intra- and inter-session (one week apart) reproducibility of MT and EI parameters and the role of plane of view (transverse vs. longitudinal) and ROI dimension on measurements’ accuracy using the intraclass correlation coefficient
[ICC(3,1)], the standard error of measurement (SEM), and the smallest detectable change
(SDC). Bland-Altman analysis was used to study the level of agreement between plane views and ROI sizes. The second study (N = 28) investigated the effect of a 15-week strength program on MT and EI in several regions of the heads of the quadriceps femoris. This study included a control group and two training groups performing concentric or eccentric strength training. During this study, changes in vastus lateralis’ (VL) stiffness in response to strength training were evaluated using quasi-static elastography (QSE). In the final study (N = 16), acute changes in VL’s stiffness associated with passive stretching, performance of short but intense contractile activity, and muscle isometric contractions were investigated by means of supersonic shear wave imaging (SSI).
Results: Moderate to very high reliability was found for MT (intra-session, ICCs: 0.82-0.99; inter-session, ICCs: 0.70-0.98) and EI (intra-session, ICCs: 0.74-0.97; inter-session, ICCs: 0.48-0.94). In general, reliability for MT and EI measures was higher in the transverse plane and when using a larger ROI, respectively. Measurements of EI taken with a small versus a large ROI are associated with a small bias and larger limits of
agreement (LoA). In study 2, 15 weeks of strength training increased MT in the majority but not in all of the scanned regions. Strength training failed in changing EI in most of the quadriceps femoris, excepting in the VI and some regions of the VL. Strength training significantly increased VL’s stiffness. No differences were observed in our quantitative US parameters between concentric and eccentric training. The final study demonstrated an acute increase of around 10% in VL’s shear modulus as a result of performing maximal isometric, concentric, and eccentric contractions. The shear modulus of the VL also increased when the knee moved from 10º to 50º and then to 90º flexion. Finally, a linear relationship between the shear modulus and the level of isometric muscle contraction was observed.
Conclusions: Ultrasound measures of MT and EI show moderate to very high reliability. The reliability and agreement of MT and EI measurements are improved in transverse scans and with larger ROIs. QSE could demonstrate an increase in muscle stiffness as a result of strength training. SSI proved to be a good method to investigate muscle mechanical properties changes associated with muscle function. These results emphasise the value of an objective and quantifiable muscle US evaluation for studying muscle adaptation to exercise training and muscle function, in general.
Key-words: quantitative ultrasound; ultrasound elastography; strength training, muscle adaptation.
Resumo
Introdução: A ultrassonografia tem um papel importante na avaliação músculo-esquelética, permitindo o estudo da morfologia e função muscular. A espessura muscular e a eco-intensidade muscular são dois parâmetros importantes que podem quantificar as adaptações estruturais musculares, quando o musculo é submetido a determinados estímulos. A elastografia por ultrassonografia pode, também, oferecer uma avaliação semi-quantitativa e/ou quantitativa da rigidez do tecido, fornecendo informações relevantes sobre as adaptações das propriedades mecânicas musculares. Objetivo: O objetivo geral, dos estudos apresentados nesta tese, é explorar o potencial da imagem quantitativa ultrassonográfica, de forma a avaliar as adaptações e as respostas do tecido muscular ao aumento da atividade contrátil, usando a elastografia e a ultrassonografia em modo-B. Os estudos foram centrados no músculo do quadricípite femoral e abordaram o estudo do efeito do treino de força e da atividade contrátil muscular na espessura muscular, eco-intensidade e rigidez muscular.
Materiais e métodos: Três diferentes estudos foram realizados e descritos ao longo desta tese. Um total de 64 jovens adultos de ambos os géneros participaram dos estudos. No primeiro estudo (N = 20), foi analisada a reprodutibilidade da espessura muscular e da eco-intensidade dos quatro músculos que compõem o quadricípite femoral. Para isso foram adquiridas três imagens em modo B, nos planos longitudinal e transversal, em dois momentos distintos. A eco-intensidade foi medida usando dois tamanhos diferentes de região de interesse, um representado por uma forma retangular, medindo 70 mm2 e um outro representando o máximo do músculo
apresentado na imagem ultrassonográfica, evitando as fáscias superficial e profundas do mesmo. A precisão das medidas foi, então, analisada usando o Coeficiente de correlação intra-classe [ICC (3,1)], o erro padrão de medição (SEM) e a menor alteração
detectável (SDC). A análise de Bland-Altman foi utilizada para estudar o nível de concordância entre os planos de imagem ultrassonográficos e os diferentes tamanhos da região de interesse. No segundo estudo (N = 28), analisou-se o efeito de um programa de treino de força, com duração de 15 semanas, sobre espessura muscular e eco-intensidade em três diferentes regiões de cada um dos quatro músculos que representam o quadricípite femoral: reto femoral, vasto intermédio, vasto medial e vasto lateral. Este estudo incluiu um grupo de controlo e dois grupos de treino, em que um realizou um protocolo de treino concêntrico e o outro de treino excêntrico. Durante este estudo, as alterações na rigidez do vasto lateral, em resposta ao treino de força
foram avaliadas usando a elastografia quasi-statica, semi-quantitativa. No último estudo (N = 16), foram analisadas as alterações agudas na rigidez de vasto lateral associadas ao alongamento passivo, ao desempenho de atividade contrátil de curta duração, mas intensa e às contrações isométricas musculares usando a elastografia de onda supersónica por cisalhamento.
Resultados: Foi encontrada uma alta ou muito alta reprodutibilidade para espessura muscular (intra-sessão, ICCs: 0,82-0,99; inter-sessão, ICCs: 0,70-0,98) e eco-intensidade (intra-sessão, ICCs: 0,74-0,97; inter-sessão, ICCs: 0,48-0,94). Em geral, a reprodutibilidade para os valores da espessura muscular foi maior no plano transversal e no que diz respeito aos valores da eco-intensidade verificou-se uma melhor reprodutibilidade quando foi utilizada uma região de interesse de maiores dimensões. Um pequeno viés e menores valores de concordância caracterizam as medidas de eco-intensidade obtidas com uma região de interesse maior ou menor. No estudo 2, os participantes submetidos a 15 semanas de treino de força revelaram o aumento da sua espessura na maioria das regiões musculares avaliadas, mas não em todas. Não foram encontradas alterações significavas dos valores da eco-intensidade com a realização do treino de força na maioria dos músculos do quadricípite femoral, excepto para o vasto intermédio e para algumas regiões do vasto lateral. Por outro lado, o treino de força aumentou significativamente a rigidez do vasto lateral. Não foram observadas diferenças significativas nos parâmetros quantitativos ultrassonográficos entre o treino concêntrico e excêntrico. O último estudo demonstrou um aumento agudo de cerca de 10% nos valores da rigidez do vasto lateral como resultado da realização de contrações máximas isométricas, concêntricas e excêntricas. Os valores da rigidez do vasto lateral também aumentaram durante a flexão do joelho de 10º para 50º e posteriormente para 90º. Finalmente, observou-se uma relação linear entre os valores de rigidez do vasto lateral e o nível de contração muscular isométrica do quadricípite femoral.
Conclusões: As medidas ultrassonográficas da espessura muscular e eco-intensidade mostram uma reprodutibilidade moderada a muito alta. A reprodutibilidade e a concordância das medidas de espessura muscular e eco-intensidade são maiores no plano transversal e quando é utilizada uma região de interesse de maior dimensão. A elastografia semi-quantitativa mostrou existir um aumento significativo na rigidez muscular como resultado do treino de força. A elastografia por onda de cisalhamento supersónica é um bom método para investigar as alterações das propriedades mecânicas musculares associadas à função muscular. Estes resultados enfatizam a importância de uma avaliação objetiva e quantificável dos músculos por ultrassonografia, para estudar
Palavras-chave: ultrassonografia quantitativa; elastografia; treino de força; adaptação muscular.
Table of contents
DECLARAÇÃO DE REPRODUÇÃO DA TESE ... III ACKNOWLEDGMENTS ... VII PUBLICATIONS AND CONFERENCE PRESENTATIONS ... IX ABSTRACT ... XI RESUMO ... XIII INDEX OF TABLES ... XIX INDEX OF FIGURES ... XXI INDEX OF ABBREVIATIONS AND SYMBOLS ... XXIII
INTRODUCTION ... 1
THESIS OUTLINE ... 4
CHAPTER 1: BACKGROUND ... 5
1.1 MSK ULTRASOUND EXAMINATION ... 7
1.1.1 Advantages and disadvantages of diagnostic US in MSK ... 8
1.1.2 Parameters of B mode ultrasound evaluation ... 9
1.2 MSK ULTRASOUND BY ELASTOGRAPHY ... 12
1.2.1 Physical principles of elastography ... 14
1.2.2 Methods of elastogram interpretation and analysis ... 15
1.2.3 Methods for force application ... 16
1.3 MUSCULAR CHANGES DETECTED BY ULTRASOUND ... 18
1.4 ULTRASOUND IMAGE QUALITY ANALYSIS ... 21
1.4.1 Optimisation of ultrasound image acquisition ... 21
1.4.2 Ultrasound image quantitative parameters ... 23
1.5 MUSCLE CONTRACTION EXERCISE ... 25
1.6 ANATOMICAL FEATURES OF THE QUADRICEPS FEMORIS ... 28
1.7 SUMMARY ... 32
1.8 REFERENCES ... 34
CHAPTER 2 : MUSCLE CHARACTERISATION BY ULTRASOUND IN B MODE ... 41
2.1 REPRODUCIBILITY OF ULTRASOUND-DERIVED MUSCLE THICKNESS AND ECHO-INTENSITY MEASURES FOR THE ENTIRE QUADRICEPS FEMORIS MUSCLE ... 43
2.1.2 Materials and Methods ... 45
2.1.2 Results ... 47
2.1.3 Discussion ... 54
2.1.4 Limitations ... 56
2.1.5 Summary ... 57
2.1.6 References ... 58
CHAPTER 3: EVALUATION OF MUSCLE ADAPTATIONS TO STRENGTH TRAINING BY ULTRASOUND IMAGING ... 61
3.1 MUSCLE THICKNESS AND ECHO-INTENSITY CHANGES OF THE QUADRICEPS FEMORIS MUSCLE DURING
3.1.1 Materials and Methods ... 64 3.1.2 Results ... 69 3.1.3 Discussion ... 75 3.1.4 Limitations ... 77 3.1.5 Summary ... 77 3.1.6 References ... 79
3.2 THE EFFECT OF STRENGTH TRAINING ON VASTUS LATERALIS’ STIFFNESS: AN ULTRASOUND QUASI -STATIC ELASTOGRAPHY STUDY ... 81
3.2.1 Materials and Methods ... 82
3.2.2 Results ... 85
3.2.3 Discussion ... 88
3.2.4 Limitations ... 91
3.2.5 Summary ... 92
3.2.6 References ... 93
CHAPTER 4: VASTUS LATERALIS STIFFNESS ASSESSED WITH SUPERSONIC SHEAR WAVE ELASTOGRAPHY ... 97
4.1 EFFECT OF KNEE ANGLE, CONTRACTILE ACTIVITY AND INTENSITY OF FORCE PRODUCTION ON VASTUS LATERALIS’ STIFNESS: A SUPERSONIC SHEAR WAVE ELASTOGRAPHY STUDY ... 99
4.1.1 Materials and Methods ... 101
4.1.2 Results ... 103
4.1.3 Discussion ... 106
4.1.4 Limitations ... 108
4.1.5 Summary ... 108
4.1.6 References ... 110
CHAPTER 5: GENERAL DISCUSSION ... 113
5.1 DISCUSSION OF THE MAIN FINDINGS ... 113
5.1.1 The reproducibility of MT and EI measurements of the quadriceps femoris 113 5.1.2 The effect of strength training on quadriceps femoris’ MT, EI, and stiffness ... 115
5.1.3 The use of ultrasound elastography for measuring vastus lateralis’ stiffness ... 117
5.2 METHODOLOGICAL ISSUES AND LIMITATIONS ... 117
5.2.1 Participants’ characteristics ... 117
5.2.2 Confounding variables ... 118
5.2.3 Equipment and validation ... 118
5.2.4 Implications for future research ... 118
5.3 REFERENCES ... 120
ATTACHEMENTS I – ETHICAL APPROVAL ... 123
ATTACHEMENTS II – ETHICAL APPROVAL II ... 124
Index of tables
Table 1: Comparison of specific imaging techniques ... 5
Table 2: Advantages and disadvantages of applying US in MSK imaging. ... 9
Table 3: Data of muscle thickness for the four heads of the left and right quadriceps femoris. ... 47
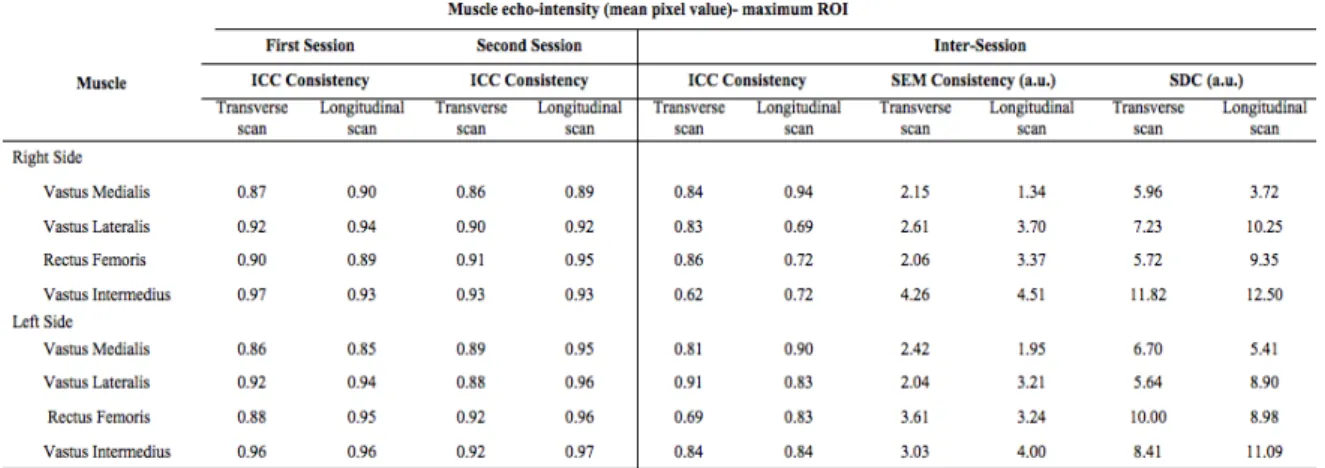
Table 4: Data of muscle echo-intensity for the four heads of the left and right quadriceps femoris using maximum and rectangular ROIs. ... 48
Table 5: Reliability of muscle thickness measures: ICC, SEM, and SDC values. ... 49
Table 6: Reliability of muscle echo-intensity measures for maximum ROI: ICC, SEM, and SDC values. ... 49
Table 7: Reliability of muscle echo-intensity measures for rectangular ROI: ICC, SEM, SDC. ... 49
Table 8: Summary of differences (first session only) between transverse and longitudinal scans (MT and EI) and between maximum ROI and rectangular ROI (EI only). ... 50
Table 9: Data for maximal isometric torque produced by the knee extensors before and after strength training for right and left limbs. ... 69
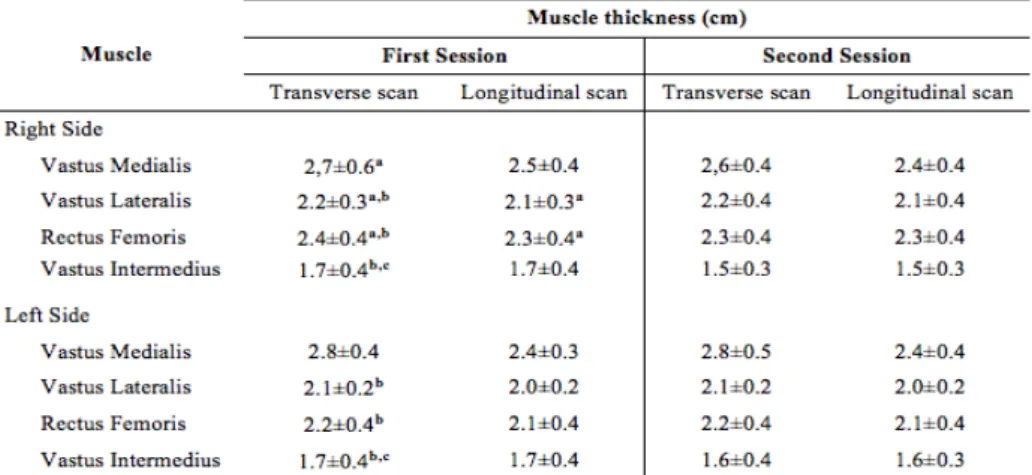
Table 10: Data of muscle thickness for each of the four heads of the quadriceps femoris. ... 70
Table 11: Mixed two-way ANOVA results for muscle thickness data ... 70
Table 12: Data of echo-intensity for each four heads of quadriceps. ... 72
Table 13: Mixed two-way ANOVA results for muscle echo-intensity data ... 72
Table 14: Data for maximal isometric torque produced by the knee extensors before and after strength training for right and left limbs. ... 85
Table 15: Data for colour pixels in vastus lateralis’ elastograms. ... 86
Table 16: Data of colour mapping for vastus lateralis and intra-class correlation coefficient. ... 87
Table 17: Data of colour mapping for vastus lateralis and inter-class correlation coefficient. ... 87
Index of figures
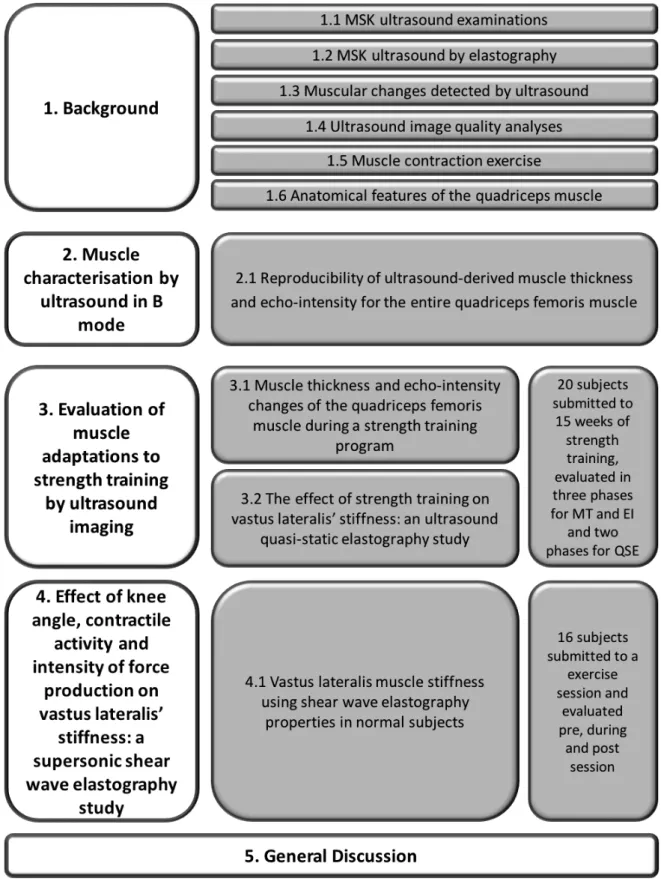
Figure 1: Thesis flowchart. ... 3
Figure 2: B mode ultrasound image of the vastus lateralis and of its thickness measured by Image J software. ... 10
Figure 3: Echo-intensity measurement.. ... 12
Figure 4: Elastography by ultrasound imaging. (A) Quasi-static elastography; (B) shear wave elastography. ... 13
Figure 5: Scheme of ultrasound elastography methods ... 17
Figure 6: Example of ultrasound image parameters that can be manipulated to image optimisation ... 21
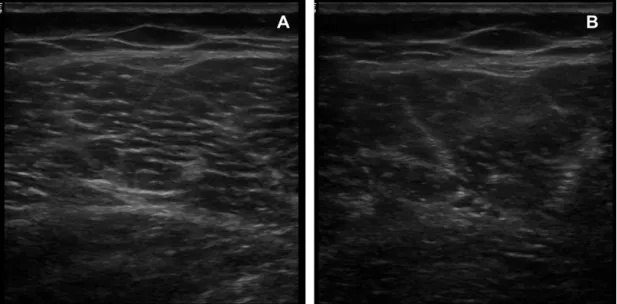
Figure 7: B mode ultrasound imaging of the vastus lateralis muscle. (A) Without artefact; (B) with anisotropy artefact. ... 22
Figure 8: Diagram showing the anatomy of the quadriceps femoris in axial plane ... 28
Figure 9: Anatomy of the quadriceps femoris in a superficial plane ... 29
Figure 10: Anatomy of the quadriceps muscle in a deep plane.. ... 30
Figure 11: Quadriceps patellar force diagram. ... 32
Figure 12: Ultrasound images of two different ROIs used to measure muscle echo-intensity. ... 46
Figure 13: Bland-Altman plots for muscle thickness measures (transverse and longitudinal scans) obtained from two different ultrasound images acquired in the first session and for each side. ... 51
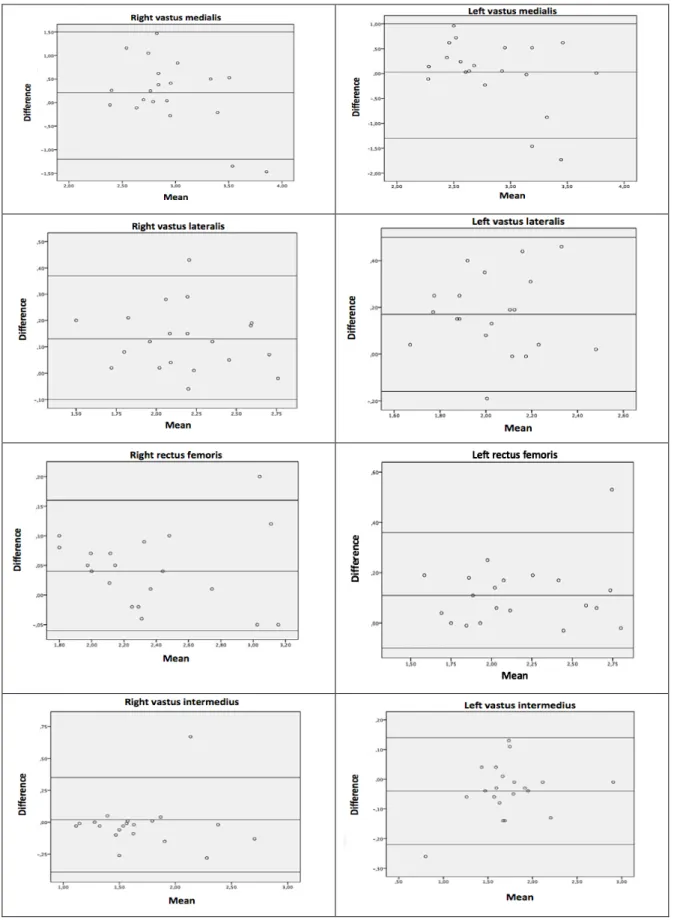
Figure 14: Bland-Altman plots for muscle echo-intensity measured in transverse and longitudinal scans obtained from two different ultrasound images acquired in the first session and for each side. ... 52
Figure 15: Bland-Altman plots for muscle echo-intensity measured by two different ROIs (maximum ROI and rectangular ROI) in the first session and for each side. ... 53
Figure 16: Training unit, with two isokinetic dynamometers – Biodex system. ... 65
Figure 18: Ultrasound scanning regions for the four heads of the quadriceps femoris according to the Blazevich et al. (2006) protocol. ... 67
Figure 19: Example of a ROI for determination of EI in a longitudinal scan of the VL. .. 68
Figure 20: Scatterplots between MT and EI data. ... 73
Figure 21: Data for muscle thickness for each evaluated muscle and site at the beginning and end of the study. Values are from the two strength-training groups pooled together. ... 74
Figure 22: Data for muscle echo-intensity for each evaluated muscle and site at the beginning and end of the study. Values are from the two strength-training groups pooled together. ... 75
Figure 23: Diagram showing the location for ultrasound scanning (left). Picture of one participant sat on the dynamometer during ultrasound scanning (right). ... 83
Figure 24: Strain elastography maps and red, green, and blue pixels counting ... 84
Figure 25: Schematic representation of the ultrasound equipment with supersonic shear wave elastography capability. ... 103
Figure 26: Typical shear wave elastograms during ramp isometric contractions of increasing intensity. ... 104
Figure 27: Individual linear regressions between isometric extension torque and shear modulus. ... 106
Index of abbreviations and symbols
Con: Control group Conc: Concentric
CT: Computed tomography Ecc: Eccentric
EI: Echo-intensity
GCon: Concentric training group GEcc: Eccentric training group
ICC: Intra-class correlation coefficient LoA: Limits of agreement
MVC: Maximal voluntary contraction MRI: Magnetic resonance imaging MSK: Musculoskeletal
MT: Muscle thickness
QSE: Quasi-static elastography RF: Rectus femoris
RGB: Red-green-blue
RCR: Royal College of Radiologists ROI: Region of interest
ROM: Range of motion SD: Standard deviation
SDC: Smallest detectable change SEM: Standard error of measurement SSI: Supersonic shear wave imaging US: Ultrasound
VI: Vastus intermedius VL: Vastus latelaris
VLL: Vastus lateralis longus VLO: Vastus lateralis obliquus VM: Vastus medialis
VML: Vastus medialis longus VMO: Vastus medialis obliquus
Introduction
In the last years, the use of ultrasound (US) imaging for the study of muscle skeletal function has grown considerably. The reasons for such growth include the ability to study muscle morphology and muscle tissue mechanical properties at relatively low cost and accessibility (Wang et al., 2017). The continuous improvement of US imaging equipment, including the use of multifrequency probes, higher frequency of image acquisition, and the development of new US techniques, such as elastography have contribute to make US imaging an important method in muscle function research (Paluch et al., 2016; Walker et al., 2004).
Ultrasound imaging is a major diagnostic imaging technique, including for the clinical assessment of muscle alterations associated with neuromuscular diseases or injury (Pillen et al., 2008). Numerous studies have proven the feasibility of US imaging for studying muscle function in non-pathological conditions (Jansen et al., 2012). The assessment of parameters such as muscle thickness (MT) and texture allows studying muscle morphological responses to a variety of stimulus, in particular to muscle disuse and resistance training (Teixeira, 2013).
MT, defined as the distance between the superficial and deep fasciae of muscles, and echo-intensity (EI) are the two most important parameters of quantitative US for studying muscle adaptation due to neuromuscular diseases or demographic factors, such as age, gender, practice of sports, and sedentary lifestyle (Jansen et al., 2012; Trip et al., 2009). Exercise training can induce specific muscle adaptations depending on variables such as the type of training, and its intensity and duration (Nishihara et al., 2014; Tilp et al., 2012; Zaidman, et al., 2008). However, the results can be quite controversial, in most of the cases due to the different methodologies used. Assuring the consistency of quantitative US, in particular its reproducibility, is necessary for using US imaging and ultrasound-derived parameters in the study of muscle adaptation to physical exercise. While a number of associations have been established between MT, EI and models of muscle use and disuse (e.g., bed rest or aging), it is not clear how strength training affects those parameters in complex muscles, such as the quadriceps femoris (Strasser et al., 2013). In the case of EI, there is no consensus about how this parameter changes in response to strength training in young and healthy subjects. A recent application of quantitative US is the evaluation of tissue stiffness. This evaluation is decisive in the early diagnosis and follow-up of a variety of diseases, including neuromuscular diseases (Pillen et al., 2008), but it is also important for the
non-invasive and dynamic assessment of muscle mechanical properties (Brandenburg et al., 2014; Yanagisawa et al., 2015). Elastography is an imaging technique that maps soft tissues’ stiffness using a colour grade from which a semi-quantitative or quantitative measure of stiffness can be derived (Toledo, 2016). Using US elastography, the mechanical behaviour of muscles can be studied non-invasively and in dynamic conditions and, unlike other techniques, it can measure stiffness in localized muscle regions and in specific muscles within muscle groups (Bouillard et al., 2014; Bouillard et al., 2011; Lacourpaille et al, 2012; Nordez, et al., 2006; Toledo, 2016). Despite the fast growing number of studies employing US elastography to investigate muscle function, the effect of strength training on local muscle stiffness has not been fully explored. Also, the effect of passive stretching and muscle contraction on the amount of stiffness in complex muscles such as the Vastus Lateralis (VL) is not fully described.
Thesis aims
The overall aim of this thesis is to investigate the feasibility of ultrasound imaging for studying skeletal muscle function and adaptation to different types of contractile activity.
The specific aims of this thesis are as follow:
- To study the reproducibility of ultrasound-derived measures of muscle thickness and muscle echo-intensity for each head of the quadriceps femoris.
- To study changes in quadriceps femoris muscle thickness, muscle echo-intensity after different kinds of strength training (i.e., concentric or eccentric strength training) and different movement amplitudes.
- To study the feasibility of quasi-static ultrasound elastography for studying changes in vastus lateralis stiffness after different kinds of strength training (i.e., concentric or eccentric strength training).
- To study acute changes in vastus lateralis stiffness in response to contractile activity, passive stretching and level of isometric contraction using supersonic shear wave imaging.
Thesis outline
This thesis is divided in five Chapters. Chapter 1 presents a literature review describing the state of the art regarding musculoskeletal (MSK) evaluation by medical imaging with a special focus on US. The major applications of US imaging and the parameters that can be quantified using this technique will be presented and discussed. A brief description of the gross anatomy of the quadriceps femoris will also be presented. Chapter 2 reports the experimental study designed to study the intra- and inter-session reproducibility of US measures of MT and EI for each of the four heads of the quadriceps femoris in a group of healthy young adults.
Chapter 3 is divided in two sections each one describing selected parts of an interventional study of 15 weeks of strength training. The first section addresses the effect of the 15-week strength training program on MT and EI in several regions of the heads of the quadriceps femoris. In the second section, the effect of the same strength training program on VL’s elasticity, measured by means of quasi-static elastography (QSE) is reported.
Chapter 4 reports the last experimental study of this thesis. In this preliminary study, SSI was used to investigate acute changes in VL’s stiffness caused by passive stretching, intense contractile activity, and isometric contraction.
Chapter 5 presents a general discussion addressing the main findings in the thesis, major limitations, and recommendations for future research.
Chapter 1: Background
Medical imaging plays nowadays a central role in the diagnosis and follow-up of MSK diseases. Ultrasound imaging, together with magnetic resonance imaging (MRI), have increasing importance in this area due to their evolving ability for soft tissue evaluation. On the other hand, general radiography shows many limitations for evaluating soft tissues and exposes the patients to ionizing radiation (Tan et al., 2003).
The latest edition of iRefer guidelines of the Royal College of Radiologists (RCR) (2012) has a chapter fully dedicated to MSK pathology and identifies 27 MSK clinical problems to support clinicians in making appropriate referral decisions (RCR, 2012). A recent RCR member stated that new European referral guidelines for radiological imaging must be promoted to support the good practice in medical imaging prescription (Remedios et al., 2014). For the majority of these clinical situations, US imaging is indicated for a medical assessment taking into account its accuracy and non-exposure to ionising radiation (RCR, 2012).
Advantages and disadvantages of medical imaging examinations for MSK studies can be compared in Table1.
Table 1: Comparison of specific imaging techniques (adapted from: Boykin et al. 2010)
Modality Pro Contra Risk Cost Radiography Good evaluation of bone. evaluate soft Unable to
tissue.
Low radiation
exposure. cost. Low
US Good visualization of soft tissues; Dynamic testing possible; Low costs; Availability. Unable to evaluate deep joint structures (e.g. shoulder); Highly dependent on examiner skills. No identifiable risk. Low to medium cost. MRI Good visualization of soft tissues; Good visualization of concomitant injuries such as labrial tears;
Good operative planning possible. Possible false positive results; Availability. Potential risk of nephrogenic systemic fibrosis in renal insufficiency. High cost. MR-arthrography Superior to conventional MRI and
US in respect of sensitivity and
specificity of detection of soft
tissue tears (also see MRI).
Invasiveness;
Computed tomography (CT) Good evaluation of bony defects. No good visualization of soft tissue; Availability. Moderate radiation exposure. Medium cost. CT-arthrography Good evaluation of bones combined with
reasonable evaluation of soft tissues. Invasiveness Availability. Moderate radiation exposure. Medium cost.
Ultrasound diagnostic for injuries, inflammation or chronic problems is reliable and increasingly common. Some specific structures are more affected, but pathological changes are similar in the tendons, ligaments, and muscles regardless their location (Salh, 2015). The evaluation of tendon diseases or injuries is probably the most common clinical indication for US evaluation. This method has a high sensitivity (100%) for full thickness tears but, similar to MRI, has a much lower sensitivity for partial thickness tears (Lento & Primack, 2008).
Compared to US, general radiology and MRI are useful for evaluating intra-articular and peri-articular alterations, however US can add some information like detecting small joint effusions, and helping on its location as a guide for aspiration (Lento & Primack, 2008).
Ultrasound examination includes the ability to perform dynamic imaging, as well with sono-palpation or motion. With US, tendon subluxation or dislocation can be visualized with dynamic manoeuvres. The same cannot be performed with MRI. Abnormalities like tendon clicks and snaps or impingement syndromes are easily evaluated by US (Lento & Primack, 2008; McNally, 2011).
MSK ultrasound is a good method to clearly define the extent of an injury and to detect the cause of the underlying effusion. With Doppler US, the synovium of inflammatory or infectious arthritis can be evaluated. Ultrasound evaluation was introduced on the peripheral nervous system for the diagnostic of carpal tunnel syndrome (Lento & Primack, 2008).
Due to its portability, user friendly, and superior spatial resolution US is considered an excellent imaging modality for detecting and classifying a large number of MSK injuries. This method can also identify non-traumatic or primary muscle pathologies such as myositis and it can diagnose more rapidly muscle sports injuries (Lento & Primack, 2008). Ultrasound allows the distinction between different grades of muscle strain (Lee & Healy, 2004).
Ultrasound has become a well-established method in the evaluation of sports-related injuries of both the upper and lower extremities. Its accuracy has been confirmed for many types of diseases (Blankenbaker & De Smet, 2006; Lento & Primack, 2008).
Around 10-55% of all sport injuries are muscle injuries and it is estimated that over 90% of sports related injuries are strains or contusions. Muscle strain injuries can result from a faulty contraction or from excessive stretching (Alqahtani, 2010).
1.1 MSK ultrasound examination
Ultrasound image has improved over the past few decades, increasing its clinical application (Lee & Healy, 2004). In the last years the use of MSK ultrasound had significantly increased with a 3-fold increase in the number of studies performed between 2000 and 2009 (Petscavage-Thomas, 2014). Salh (2005) argues that MSK ultrasound should be the first examination for most pathological conditions and it should be done for every patient complaining of swelling, pain and trauma before doing general radiology or MRI (Salh, 2015). Ultrasound is an excellent imaging modality for most MSK problems, allowing the evaluation of various structures including tendon, muscle, joints, even nerve and some osseous pathology with excellent resolution (Lento & Primack, 2008).
Comparing with fluoroscopy and CT methods, US offers advantages when used for interventional procedures. Although fluoroscopy or CT scan can be helpful in the localization of the structure to be targeted, both require ionizing radiation. In addition, fluoroscopy does not allow soft tissue visualization, relying on bony landmarks and often use contrasting agents in its procedures (Lento & Primack, 2008).
One important advantage of US imaging for MSK evaluation is that it allows patients to move during examinations and therefore is capable of supporting the diagnosis of several pathological conditions that are elicited only through patient movement (Lee & Healy, 2004). Ultrasound has also some advantages over MRI, which includes accessibility, lower cost, and more patient friendly. It allows a more direct imaging correlation with patient symptoms, which provides important information (Blankenbaker & De Smet, 2006; Lento & Primack, 2008). However, MRI allows a larger area to be examined but this is not always an advantage since several ‘‘abnormalities’’ may be detected that may be clinically unrelated to the patient’s complaints. On the other hand, US with the application of extended field of view imaging can also examine large areas while preserving the interaction with the patient. Ultrasound permits a real time imaging, observing pathologic movement in tendon, bursa, muscles, or joints, while in
MRI movement distorts image quality and introduces artefacts (Lento & Primack, 2008; McNally, 2011).
The US transducers are used according to the type of structures to be visualized (Fulton, 2014; Lento & Primack, 2008). The choice of the transducer should be made based on the type of examination, the organ evaluated, and the patient's biotype. There are at least five types of transducer, however only the linear transducer will be mentioned because it is used most of the times to visualise MSK structures. The linear transducer performs a linear scan (it has the shape of a rectangle) and the frequency ranges from 7 to 18 MHz. It is used in examinations of superficial structures, such as breast, thyroid, MSK system and peripheral vascular exams. The field of view is directly proportional to the width of the transducer. The use of the appropriate transducer frequency for the structure to be evaluated is extremely important (Fulton, 2014). The higher the frequency of the transducer, the higher is the resolution of the image and the lower is the depth reached (Hammond et al., 2014).
1.1.1 Advantages and disadvantages of diagnostic US in MSK
Ultrasound imaging does not use ionizing radiation and contrasts, when used, do not cause known adverse reactions. It is used as a guide for interventional procedures, as aspirations or drainages (Lento & Primack, 2008). Portability allows examination not only in the workplace but also in the training room and playing field (Lento & Primack, 2008). The real-time capability US allows dynamic evaluation of muscle and tendon injuries (Lee & Healy, 2004). High-frequency transducers yield images with excellent spatial resolution and this is particularly useful for MSK imaging (Lento & Primack, 2008). Recent advances in tissue harmonics have improved visualization and resolution of deeper structures even in obese patients (Lento & Primack, 2008).
One limitation of US imaging is its dependence on body habitus. Ultrasound wave penetrance into tissue is inversely proportional to the wave frequency. The anisotropy artefact can be another disadvantage, affecting US diagnosis ability because it can mimic real pathology (Lento & Primack, 2008). Another limitation of US diagnosis includes operator dependence, that can be overcome with training and experience (Blankenbaker & De Smet, 2006). MSK ultrasound should be done by skilled examiners with knowledge about anatomy, physiology and pathology and they should be very familiar with US equipment in order to produce images of high quality (Whittaker & Stokes, 2011). Despite these disadvantages, US imaging has been the method of choice for the diagnosis of muscle injuries (Lee & Healy, 2004; Lento & Primack, 2008). The advantages and disadvantages of US in imaging muscles are presented in Table 2.
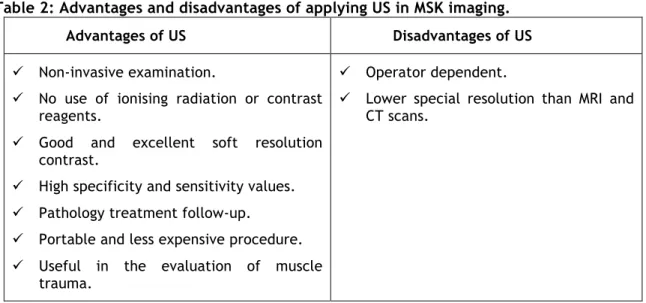
Table 2: Advantages and disadvantages of applying US in MSK imaging.
Advantages of US Disadvantages of US
ü Non-invasive examination.
ü No use of ionising radiation or contrast reagents.
ü Good and excellent soft resolution contrast.
ü High specificity and sensitivity values. ü Pathology treatment follow-up.
ü Portable and less expensive procedure. ü Useful in the evaluation of muscle
trauma.
ü Operator dependent.
ü Lower special resolution than MRI and CT scans.
1.1.2 Parameters of B mode ultrasound evaluation
Several parameters are taken into account when structures are assessed by US, being the following the most used: echo-intensity, echo-structure, contour and dimensions (namely thickness). Ultrasonography is used to measure morphological muscle-tendon alterations, including changes in thickness and EI. As such, these parameters are being increasingly analysed and associated with muscle function and muscle mechanics. Muscle thickness (Figure 2) is defined as the distance between the most superficial aponeurosis and the deepest aponeurosis of the muscle (Delaney et al., 2010; Teixeira, 2013; Verhulst et al., 2011). It is a quantitative parameter obtained in both transversal and longitudinal images to assess muscle chronic adaptations to different strength training protocols and it is associated with muscle strength capacity (Radaelli et al., 2011). Studies reveal that the accuracy of MT as a predictor of muscle strength is relatively low comparatively with measurements of muscles’ cross-sectional area (Muraki et al., 2013). Yet, some authors support the use of MT as a predictor of the muscles’ cross-sectional area (Muraki et al., 2013).
Figure 2: B mode ultrasound image of the vastus lateralis and of its thickness measured by Image J software. Muscle thickness was determined as the distance between superficial fascia of the muscle and the deep fascia of the same muscle.
Echo-intensity, assessed by ultrasonography, is the capacity of a tissue to reflect the US waves and produce echo, and it may contain information about the muscle tissue status. The fact that US beams penetrate easily through the majority of structures leads to structures appearing as hypoechoic (this happens with liquids and with low density tissue). When the contrary occurs, i.e., when the US beams have more difficulty in passing through the structures, there is higher reflection of the US and the tissues appear as hyperechoic (connective tissue and fat)(Wilhelm et al., 2014).
Echo-intensity thus allows to assess alterations in the quantity of the non-contractile intramuscular components (Nielsen et al., 2006; Wilhelm et al., 2014), caused by muscle pathology or simply by degenerative alterations associated with ageing (Pillen et al., 2009).
In the past, and still today during clinical practice, EI is assessed in a qualitative manner, depending on a visual analysis done by the operator, who relies on his experience to reach a conclusion or a clinical decision. For this reason, this method is subjective and insensitive to small alterations. Currently, however, most studies evaluate EI quantitatively based on a grayscale analysis (Fukumoto et al., 2012; Pillen, 2010; Pillen et al., 2009). This technique consists in assessing the distribution of gray levels in the image and its variation, i.e., it is based on the assessment of the intensity of gray levels across the image (Alqahtani, 2010). This quantitative EI analysis is more reliable and it is less subjective, providing information that goes beyond the mere visual interpretation of the image’s EI pattern (Fukumoto et al., 2012; Ríos-Díaz et al., 2010).
This quantitative method requires simple software for image edition but it is sensitive to differences in hardware and software between US machines (Pillen et al., 2009). All system configuration parameters cannot be changed during image collection and depth must be set taking into account the visualisation of the structure under study and the overall gains and dynamic range value. The time gain compensation must be kept uniform and the angle of the transducer must be perpendicular to the assessed tissue (Alqahtani, 2010).
A healthy muscle is visualised in an US image as hypoechoic, i.e., with a low EI value, due to the small amount of non-contractile tissues (Pillen et al., 2009; Teixeira, 2013). In general, a diseased muscle, a muscle suffering from inactivity or a muscle from an aged person displays higher EI levels, i.e., it becomes more hyperechoic and more diffuse compared with the muscles of healthy young subjects (Pillen et al., 2009). In contrast to the muscle belly, tendons are hyperechoic and become hypoechoic with ageing (Nielsen et al., 2006).
The B-mode US image is a combination of pixels displaying a specific intensity of gray (Ríos-Díaz et al., 2010). Upon editing the image, the researcher should select the area of interest in the muscle, and the software calculates the different levels of gray existing in that selected region of interest (ROI) (Pillen et al., 2009). The ROI, which is visually selected and should include as much of the target muscle as possible, avoiding the surrounding bone or fascia, may include the cross sectional area of the muscle (Caresio et al., 2015). Being aware of the typical pattern that is characteristic of the studied muscle is important, as the hyperechoic pattern of the image, such as the presence of internal aponeurosis (e.g., the RF muscle) or the heterogeneous distribution of the EI may skew the distribution of gray level values obtained for the entire muscle cross-section (Caresio et al., 2015).
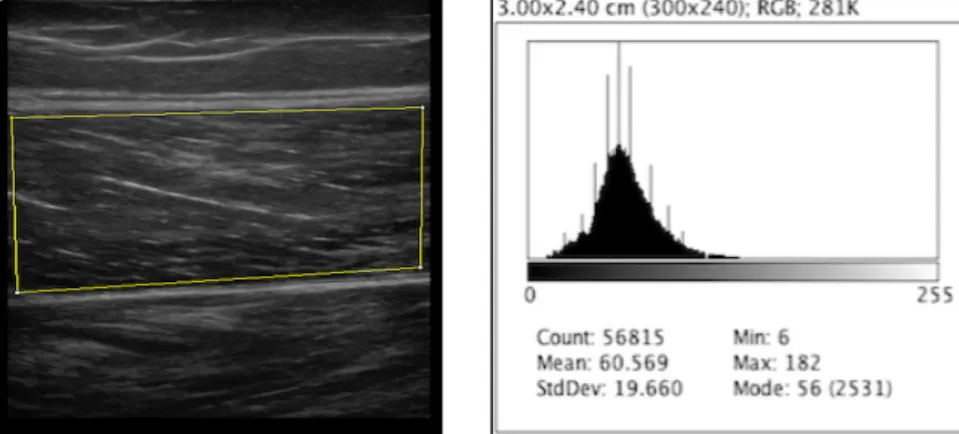
Quantitative measurements of EI is a relatively recent method of ultrasonography imaging which has raised the interest of several authors, namely for MSK studies. This method has been associated with the assessment of tendinous and muscle morphological alterations caused by pathologies or lesions, often being associated with adipose infiltration of connective tissue and/or interstitial oedema (Alqahtani, 2010; Radaelli et al., 2012; Ríos-Díaz et al., 2010). These tissue alterations increase the US beam reflection and result in an increase of the EI, which may display a specific spatial distribution within the muscle (Caresio et al., 2015; Pillen et al., 2008). The quantification of EI (Figure 3) may also be used in the characterisation and differentiation of muscle structures among athletes and sedentary individuals, as well
as in the analysis of alterations caused by muscle tiredness and fatigue (Alqahtani, 2010; Caresio et al., 2015).
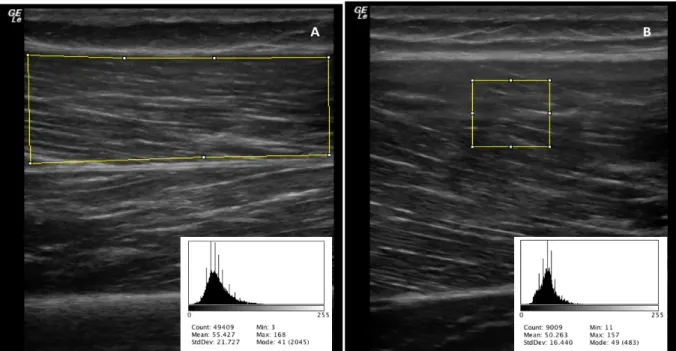
Figure 3: Echo-intensity measurement. (A) B mode ultrasound of the vastus lateralis with a maximum ROI selected; (B) Histogram of the pixel graylevel values distribution and statistics obtained using Image J software.
1.2 MSK ultrasound by elastography
Elastography is a non-invasive technique that allows the characterisation of the mechanical properties of the tissues, aiming to determine the respective Young’ modulus or the amount of deformation that the tissue suffers when a load is applied (Vega, 2011). This technique has been evolving rapidly, demonstrating great potential not only in the diagnosis of diseases characterised by alterations of tissues’ stiffness, but also for the physiological and morphological study of different structures/tissues (Cosgrove et al., 2013).
Elastography started off by being a qualitative and/or semi-quantitative technique, but evolved towards a quantitative by offering elasticity maps with the use of conventional ultrasonography equipment in real time, by means of software developments (Gheorghe et al., 2009; Zordo et al., 2009). Ultrasound elastography was described for the first time by Ophir et al. in 1991 (Konofagou et al., 2003; Ophir, 2005) and, later on, it evolved into an imaging tool in real time (Ophir et al., 1997). It may be defined as a dynamic technique developed to offer an estimated value of the elasticity/rigidity of the tissue, measuring the degree of its distortion when subjected to an external force (Pedersen et al., 2012). Ultrasound elastography is a complementary technique to the B-mode US, offering high diagnosis sensitiveness regarding the detection and assessment of the nature and structure of pathologic alterations in the body (Castaneda et al.,
2010; Smajlovic et al., 2011). Several studies show that it is a reliable technique for the diagnosis of hematoma, oedema, fibrosis, benign and malignant solid lesions, allowing the early detection of neoplasms (Abella & Zordo, 2008; Castaneda et al., 2010; D’Onofrio et al., 2014; Fierbinteanu-Braticevici et al., 2012; Goddi et al., 2011; Iglesias-Garcia et al., 2009; Lee, 2009). Due to its advantages and indications, US elastography tends to be part of every ultrasonography exam (Castaneda et al., 2010; Smajlovic et al., 2011).
This first studies employing US elastography were carried out for the diagnosis of breast, thyroid and prostate neoplasms (Rizzatto, 2008). Later on, advances in this method made possible to study deeper structures, such as the liver and pancreas (D’Onofrio et al., 2014; Kudo et al., 2013; Pedersen et al., 2012).
Ultrasound elastography has also great potential for the diagnosis of MSK diseases (Abella & Zordo, 2008; Monetti & Minafra, 2007). Because the mechanical properties of tissues are usually altered after injury or disease (e.g., inflammation, ageing and malignancy), by using US elastography tissue abnormalities may easily be identified (Pedersen et al., 2012).
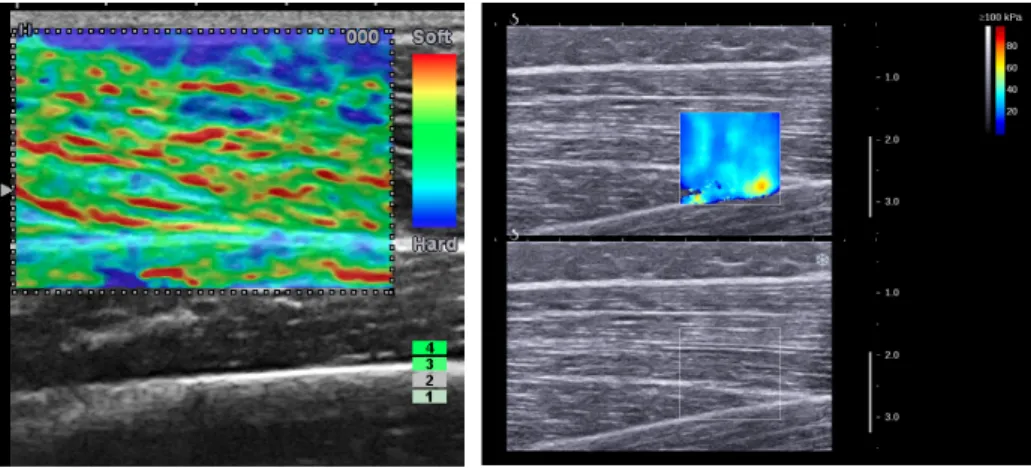
Elastography, including US elastography, started being used in MSK biomechanics research soon after its development. Both tension and shear wave elastography may be used in the study of muscle-tendon structures (Figure 4). Although most authors use tension elastography, more and more studies appear using shear wave elastography.
Figure 4: Elastography by ultrasound imaging. (A) Quasi-static elastography; (B) shear wave elastography.
The type of elastography depends on the method of stress application and their objectives. It includes compression elastography, shear-wave elastography, and
transient elastography. Each one has advantages, artefacts, limitations and specific clinical applications (Klauser et al., 2014).
However, all types of elastography operate following three steps: stress or distortion to the ROI; the tissue response (strain) and processing the distortion (Toledo, 2016). The differences between different elastography methods also reside on how the distortion is applied to the tissue and on the type of force that is applied.
1.2.1 Physical principles of elastography
Assuming that tissues are elastic (i.e., they return to their initial shape after undergoing deformation), isotropic (their elastic modulus does not depend on the orientation of the tissue), incompressible (no volumetric variations when deformed), and homogeneous, there exists four fundamental modulus that can be associated with each other: modulus of elasticity or Young's modulus, shear modulus, volumetric modulus and Poisson's ratio (Cavalcanti, 2012; Vega, 2011).
The elastic modulus or Young's modulus is a mechanical parameter proportional to the rigidity of a solid structure when subjected to an external tension or compression (Cavalcanti, 2012; Gennisson et al., 2013; Rizzatto, 2008). The shear modulus is based on the sliding of planes parallel to each other when forces are applied in parallel (Cavalcanti, 2012; Gennisson et al., 2013). The volumetric module measures the tendency of a tissue to deform in all directions when applying a multidirectional force (Gennisson et al., 2013; Smajlovic et al., 2011; Vega, 2011). Poisson ratio measures transverse deformation of a tissue when a longitudinal force is applied (Cavalcanti, 2012; Gennisson et al., 2013).
The basic principle of elastography is that stress applied to tissue causes changes within it, which depends on its elastic properties. Elastography then evaluates tissues’ elasticity by taking into account their deformation when a force is applied (Cosgrove et al., 2013; Drakonaki et al., 2012; Smajlovic et al., 2011).
Since its emergence, different generations of elastography have been developed, depending on the type of stress application and the method used to detect tissue displacement and obtain the image. However, all types of elastography use force and measure the deformation produced by this force on the tissue (Cosgrove et al., 2013; Drakonaki et al., 2012; Smajlovic et al., 2011).
1.2.2 Methods of elastogram interpretation and analysis
The methods of elastography can be divided into three broad groups: qualitative, semi-quantitative, and quantitative (Cosgrove et al., 2013; Franchi-Abella et al., 2013; Toledo, 2016). All these elastography methods produce a colour map, which is known as an elastogram (Toledo, 2016). These elastograms are available in most equipment, regardless of the type of elastography used (Franchi-Abella et al., 2013). The elastogram is generated by software and is usually depicted as a semi-transparent overlay of the grayscale US image (Toledo, 2016). They can be used as grayscale or colour scale depending of the US manufacturer (Franchi-Abella et al., 2013). When a colour-coded elastogram is used, usually the blue colour is chosen for hard tissue, red for soft tissue and green for intermediate stiffness (Barr et al., 2015; Toledo, 2016). The qualitative evaluation is obtained from visual inspection of the elastogram (Franchi-Abella et al., 2013). The big disadvantage of this type of elastography is its reliance on the operator and poor reliability (Pochini et al., 2015; Toledo, 2016).
Regarding semi-quantitative elastography, two methods are available: strain-ratio, and histogram of pixel distribution. The first one gives a strain index or elasticity ratio between two regions of interest (Franchi-Abella et al., 2013). The second method, is based on measuring the number of pixels of a given colour within a ROI (Toledo, 2016). This analysis can only be done after the acquisition of the image and by using another software, like Image J, Matlab, or any other comparable software (Toledo, 2016). This type of analysis is less operator dependent, has a higher reliability and provides an indirect stiffness value (Toledo, 2016).
Quantitative US elastography is available from shear wave propagation velocity measurement techniques. In this case, elastography uses measurements of the wave speed travelling through the tissues. The elastogram now gives a quantitative measurement of tissue’s stiffness in the form of the modulus of elasticity, expressed in kilopascal (kPa) (Franchi-Abella et al., 2013; Toledo, 2016). Therefore, shear wave elastography provides a direct measure of tissues’ stiffness (Toledo, 2016).
Elastography artefacts
Despite the great improvements in elastography, there are some important artefacts associated with this technique (Cosgrove et al., 2013; Franchi-Abella et al., 2013). For example, force-strain relationship is non-linear and time dependent, the elasticity varies spatially and with direction, the contours and the structure of the tissues can alter the relationship between the shear wave velocity and the shear modulus, and
tissues can be discontinued mechanically by anatomical features, such as tumours or scars (Cosgrove et al., 2013). It is important to be familiar with the pitfalls and artefacts of US elastography for a correct interpretation of the elastograms.
1.2.3 Methods for force application
Two types of elastography can be considered regarding the method used to apply force: quasi-static and dynamic.
Quasi-static elastography
In quasi-static elastography (QSE), stress is applied upon the tissue by an external vibration applied with the transducer (Cosgrove et al., 2013; Gennisson et al., 2013; Toledo, 2016). The obtained images are semi-quantitative and do not directly describe the elasticity of the tissue since the amount of tension produced within the tissue is unknown. However, ROIs can be drawn in the area under study and in a reference region in order to calculate the ratio and obtain a semi-quantitative analysis (Cosgrove et al., 2013; Toledo, 2016).
Together with absence of true quantification, a major limitation of QSE is still the lack of control over the applied force. Moreover, the use of operator-imposed pressure limits the study to surface structures (Gennisson et al., 2013).
Dynamic elastography
In dynamic elastography, the force or source of stress is generated by the US probe (Toledo, 2016). The force applied can be a time-varying force, a short transient mechanical force, or an oscillatory force with a fixed frequency (Gennisson et al., 2013). This method of US elastography has the advantage of being quantitative and also of not depending on the operator or on an external actuator to produce the stress (Cosgrove et al., 2013).
1.2.4 Elastography techniques
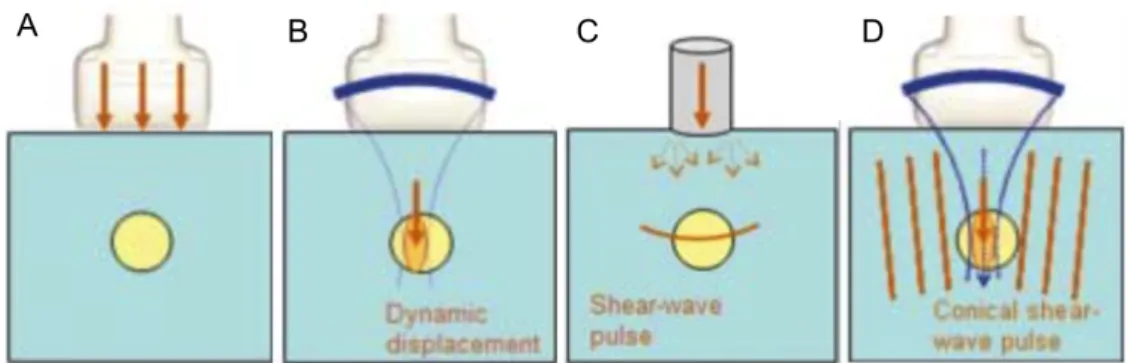
The main elastography techniques used are strain elastography, acoustic radiation force impulse elastography, transient elastography, and shear wave elastography (Figure 5).
Figure 5: Scheme of ultrasound elastography methods. (A) Strain elastography; (B) acoustic radiation force impulse elastography; (C) transient elastography; (D) shear wave elastography. (Adapted from Bamber et al., 2013).
Strain or compression elastography
Strain elastography, also described as compression elastography, is based on the quasi-static method and is a qualitative or semi-quantitative analysis (Gennisson et al., 2013; Klauser et al., 2014). The quantified parameter is strain, which is produced by repeated manual pressure of the tissue under investigation (Kim et al, 2015; Klauser et al., 2014). The difference in the echo produced by the pressure/strain is calculated (Modulus of elasticity=stress/strain), measuring the relative strain of one area compared to that of another and the results are represented by a colour-coded strain distribution map (elastogram), which is often superimposed over the conventional B-mode image or displayed next to it (Kim et al., 2015; Klauser et al., 2014). The elastogram is adjustable by the user and this technique can draw the calculation area as a relatively free shape (Kim et al., 2015; Klauser et al., 2014). Most compression elastography equipment provide visual information about the applied pressure on the screen (Kim et al., 2015).
Acoustic radiation force impulse elastography
In this type of elastography, the tissues are deformed by US pulses that are produced by a focused radiation force. The tissues’ displacement can be measured using several short-time pulse echoes and then comparing the results with the reference image (Barr et al., 2015; Klauser et al., 2014). This technique is based on qualitative analysis and the results are represented by a colour-coded or grayscale elastogram. This technique can evaluate deeper tissues (Cosgrove et al., 2013).
Transient elastography
Transient elastography, also designed by pulsed elastography, uses a controlled external tone burst of vibration to generate shear waves (Barr et al., 2015; Klauser et al., 2014). This technique can provide quantitative evaluation, measuring the average shear wave
velocity within a ROI converted to Young’s modulus, expressed in kPa (Barr et al., 2015; Drakonaki et al., 2012; Klauser et al., 2014). Transient elastography provides only regional elasticity measurement with limited depth and is mainly used for liver studies (Drakonaki et al., 2012; Klauser et al., 2014).
Shear-wave elastography
Shear-wave elastography is a dynamic method and it is based on measuring the propagation velocity distribution of the directional shear wave, produced by an US pulse (Drakonaki et al., 2012; Klauser et al., 2014). The velocity of the shear waves can be measured and used to evaluate tissue elasticity by the Young’s modulus (E) calculated by the formula E = 3rV2 (E = Young’s modulus; V = shear wave velocity; r = material
density) (Klauser et al., 2014). This technique provides both qualitative elastograms and quantitative measurements, which are presented in quantitative maps with units in kPa (stiffness) or in centimetres per second (shear wave velocity) (Drakonaki et al., 2012; Klauser et al., 2014). Shear wave elastography has a depth limitation and only limited ROI shapes are available for the quantitative measurement of elasticity (Klauser et al., 2014).
1.3 Muscular changes detected by ultrasound
In an US image, the muscle tissue features different characteristics and it can be easily distinguished from the surrounding structures, such as adipose and subcutaneous tissue, bone, nerves and blood vessels (Alqahtani, 2010; Pillen, 2010).
The healthy muscle presents low echo density (i.e. it is hypoechoic) (Pillen, 2010). The few echoes generated are due to the existence of minimal interfaces available for US reflection, caused by the muscle cells which are composed by an internal, highly organised cytoplasm structure, and by connections of identical structural proteins (Alqahtani, 2010; Walker et al., 2004).
In the transversal plane, perpendicular to the muscle longitudinal axis, the muscle has a poor echogenic appearance, although somewhat heterogeneous, due to the presence of countless hyperechoic, curvilinear and dotted reflections of the perimysial connective tissue involving the muscle fascicles and also of adipose tissue (Alqahtani, 2010; Pillen, 2010; Vlychou & Teh, 2008; Walker et al., 2004).
In the longitudinal plane (along the muscle fascicles’ axis) the fascicular architecture of the muscle becomes visible. The reflections of the perimysial connective tissue are now visible as linear echogenic structures similar to septa (Lee & Healy, 2004; Pillen, 2010;