Abstract: Precision agriculture (PA) technology has been on the market for almost 15 years. Global
Positioning Systems (GPS), Geographic Information Systems (GIS), yield monitors, variable rate technologies (VRT) and other spatial management technologies are being used by farmers worldwide, but questions remain about the profitability of the technology and its future. This paper summarizes: 1) data on worldwide adoption of PA technology,2) review of PA economics studies and 3) implications for Brazil. Worldwide adoption estimates are based on reports by an international network of collaborators. The PA profitability summary goes beyond previous reviews by including a large number of publications from the last three years, a more detailed breakdown of results by technology type and new technologies. For Brazil, low land prices, low wage rates, focus on commodity crops, and the high cost of imported technology would tend to discourage PA adoption, especially for the classic PA technologies like VRT. The large scale of many Brazilian farms may favor adoption of GPS guidance and use of PA to automate record keeping, employee supervision and quality control. PA adoption may grow rapidly in areas with higher value crops, such as citrus and sugar cane, states with higher land values and regions with a strong agricultural research base. Strong public sector agricultural research organizations will help Brazil develop site-specific PA uses, but the shortage of farm and field level economics in those public sector research organizations may inhibit PA adoption decisions.
Key-words: precision agriculture, adoption, profitability,
Worldwide adoption
and profitability of
precision agriculture
Implications for Brazil
T.W. Griffin1
J. Lowenberg-DeBoer1
1 Dept. of Agricultural Economics, Purdue University
West Lafayette, Indiana, 47907 [email protected] [email protected]
Introduction
The adoption and profitability of precision agriculture (PA) technologies has been site specific. In some areas of the world variable fertilizer application is highly profitable, while in other areas it rarely covers costs. Some farmers and agribusinesses focus on analysis and use of combine yield monitor data, others find guidance systems to be the most profitable aspect of PA. As
a globally competitive agricultural producer, Brazilian agriculture needs to identify which PA technologies fit its economic, social and ecological conditions. The objectives of this article are to summarize the worldwide picture of PA adoption and profitability, and outline implications of the worldwide patterns for Brazilian agriculture. Precision agriculture (PA) is an application of spatial information technologies to crop
production. PA technologies such as Global Positioning Systems (GPS), Geographic Information Systems (GIS), yield monitors, variable rate technology (VRT) and other spatial management technologies have been on the market for about 15 years and are used by farmers worldwide, but questions remain about the profitability of these technologies and their future. This paper summarizes: a) data on worldwide PA technology adoption; b) a literature review covering more than 200 studies reviewing PA profitability; and c) implications for Brazilian agriculture. These overlapping themes can be thought of as what we have learned, what we are doing, and where we go from here.
Adoption estimates are based on reports from an international network of collaborators, and publicly available literature, such as refereed journal articles, technical magazines, and conference proceedings. United States PA adoption numbers draw on USDA Agricultural Resource Management Survey (ARMS) data. The PA profitability summary extends the review of 108 documents by Lambert and Lowenberg-DeBoer (2000) with an additional 126 studies and a breakdown of technology profitability by type and new technologies. Following the adoption and PA economics sections, the paper applies the lessons learned in PA adoption and economics worldwide to Brazil.
Current adoption trends
Several studies have examined PA adoption since its debut in the late 1980s (DABERKOV et al., 2002; DABERKOV; McBRIDE, 1998; FOUNTAS et al., 2003; GRIFFIN et al., 2000; POPP;GRIFFIN, 2000; ENGLISH et al., 2000; GRIFFIN et al., 2002; GRIFFIN et al., 2004; KHANNA, 2001). PA has slowed in recent years compared to the mid- and late 1990's (DABERKOW et al., 2002; POPP et al., 2002; WHIPKER; AKRIDGE, 2005). Still others present possible constraints impeding PA adoption (FOUNTAS et al., 2003; GRIFFIN et al., 2004; KITCHEN et al., 2002; POPP et al., 2002; WIEBOLD et al., 1998).
The USDA ARMS survey provides the most detailed information with respect to PA adoption in the U.S. The survey is a collaborative effort by the Economic Research Service (ERS) and the National Agricultural Statistics Service (NASS). Since 1996, the ARMS Survey has provided information on production practices and resource use of America's farmers through face-to-face interviews. The 2002 ARMS survey targeted soybean (Glycine max, L. Merr.) production and the 2003 targeted cotton (Gossypium hirsutum, L). This section reports results of the updated 1996 through 2003 ARMS.
Yield monitor adoption
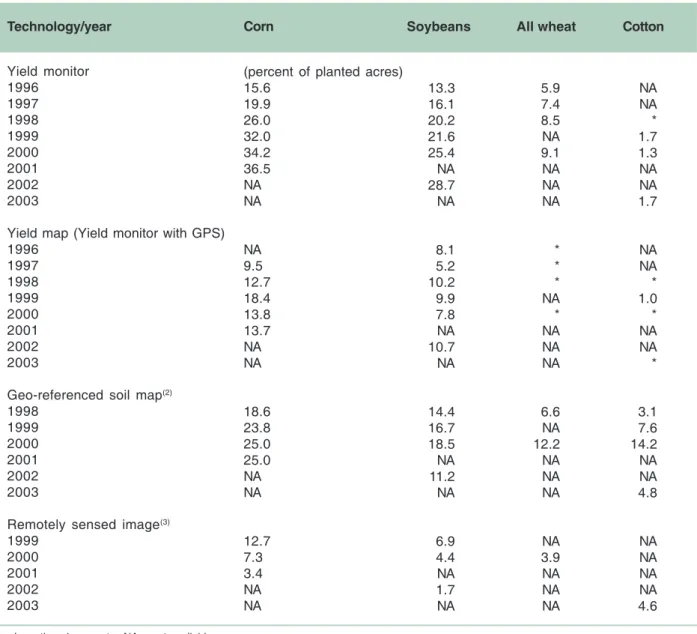
Yield monitor adoption is often the yardstick by which PA is measured. Around the world yield monitors are the single most common PA technology ( LOWENBERG-DeBOER, 2003a). About 90% of the world's yield monitors are in the United States. Corn (Zea mays, L.) and soybean yield monitor adoption rates have steadily increased since the introduction. Corn and soybean yield monitors were used on 15.6% and 13.3% of planted area in 1996 (Table 1). Yield monitor use exceeded 35% of planted corn acreage in 2001. However, the soybean acreage harvested with a combine yield monitor was still less than 30% by the end of 2002. Wheat (Triticum aestivum, L.) and cotton have not experienced the same level of adoption as corn and soybean. Approximately 9% and 2% percent of planted wheat in 2000 and cotton in 2003, respectively, were harvested with machines equipped with yield monitors.
One might expect high value crops like cotton to have higher adoption rates. One reason for the lag in yield monitor adoption in cotton is the uniqueness of the crop's harvesting machine. The cotton picker is used only for cotton, as opposed to the grain combine, which is used for corn, soybean, wheat, and other grain and oilseed crops. While a combine harvests multiple crops and can have costs spread over many hectares, the cotton picker has its costs spread over cotton only. The cotton yield monitor became
commercially available in 1998, at a time when over 20% of corn and soybean hectares were harvested with yield monitors.
Cross-country technology comparisons are important for tracking global trends in competitive advantage and in understanding the underlying economics of the technology. Assessing which
Table 1. Share of U.S. corn, soybean, all wheat, and cotton acres on which precision agriculture technologies
were used, 1996-2003(1). Yield monitor 1996 1997 1998 1999 2000 2001 2002 2003
Yield map (Yield monitor with GPS) 1996 1997 1998 1999 2000 2001 2002 2003
Geo-referenced soil map(2)
1998 1999 2000 2001 2002 2003
Remotely sensed image(3)
1999 2000 2001 2002 2003 Technology/year
* = Less than 1 percent. NA = not available
(1) These estimates are revised from previously published estimates based on updated weights from the ARMS.
(2)Prior to 2002, respondents were asked if the soil characteristics of this field had ever been geo-referenced. Beginning in 2002, respondents were
asked about geo-referencing in the current and previous year.
(3) The question was reworded in 2002 to better define the term "remotely sensed".
Source: USDA/ERS (2005a). For more information, go to http://www.ers.usda.gov/Briefing/ARMS/.
(percent of planted acres) 15.6 19.9 26.0 32.0 34.2 36.5 NA NA NA 9.5 12.7 18.4 13.8 13.7 NA NA 18.6 23.8 25.0 25.0 NA NA 12.7 7.3 3.4 NA NA Corn 13.3 16.1 20.2 21.6 25.4 NA 28.7 NA 8.1 5.2 10.2 9.9 7.8 NA 10.7 NA 14.4 16.7 18.5 NA 11.2 NA 6.9 4.4 NA 1.7 NA Soybeans 5.9 7.4 8.5 NA 9.1 NA NA NA * * * NA * NA NA NA 6.6 NA 12.2 NA NA NA NA 3.9 NA NA NA All wheat NA NA * 1.7 1.3 NA NA 1.7 NA NA * 1.0 * NA NA * 3.1 7.6 14.2 NA NA 4.8 NA NA NA NA 4.6 Cotton
technologies do well in different economic environments gives indication about the perceived benefits and costs. To make this comparison it is essential to count yield monitors the same way in each country. Some observers report only yield monitors used with GPS because it is only with GPS that full use can be made of the data, but to be consistent with the USDA ARMS data we have
tried to count all yield monitors and report separately on the percentage used with GPS. It is also important to understand yield monitor numbers relative to the total crop are.
In 2000, the U.S. had about 335 yield monitors per million hectares of grain or oilseeds (Table 2) with about 37% associated with GPS. Anecdotal information suggests that the situation is similar in Canada. The only country that may have had a higher level of yield monitor use is Germany, with over 523 yield monitors per million hectares of grain and oilseeds. Denmark had approximately 247 yield monitors per million hectares, while the U.K. and Sweden had only 107 and 119 yield monitors per million hectares, respectively. Outside U.S., Canada and Western Europe the highest density of yield monitor use is in Argentina and Australia, with an estimated 64 and 42 yield monitors per million hectares, respectively. It should be noted that because of differences in farm size and combine ownership (more custom cutters in Argentina), a combine in that country may annually cover as much as five times as a similar machine in the U.S. Thus, the use of yield monitors in Argentina probably surpasses that of most Western European countries and approaches that of the U.S. in the late 1990s. In addition about 87% of yield monitors in Argentina are used with GPS, compared to only about one third in the U.S. Without GPS growers can not make yield maps and can not use yield monitor data in most management information decisions.
Yield monitors are being used on some larger farm operations in Brazil and Mexico (NORTON; SWINTON, 2001). Although there are only four yield monitors per million hectares reported in Brazil, all are said to be used with GPS. Informal reports indicate that about 800 yield monitors were used in Australia for the 2000 harvest. Some fifteen farmers used yield monitoring in South Africa for the 1999-2000 crop season.
Variable rate technology use by farmers
The second most common yardstick to measure PA adoption is variable rate technology
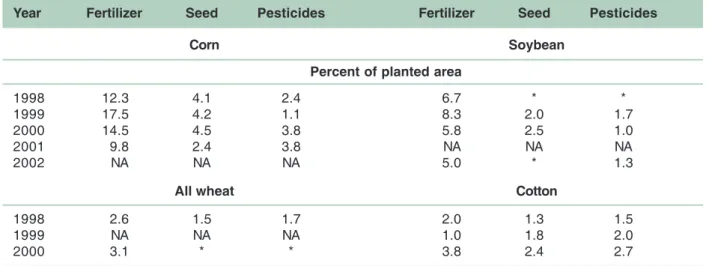
(VRT). In the later part of the 1990's, VRT was used to manage soil fertility (mainly nitrogen, phosphorous, potassium, and lime) on nearly 18% of planted corn area (Table 3). However, ARMS data indicate that this rate was less than 10% of corn planted in 2001. Soybeans showed a similar trend, albeit a lesser magnitude. Soybean area fertilized with VRT peaked at 8% in 1999, but fell to 5% in 2002. Part of the difference is that soybeans require no applied nitrogen, the nutrient that is most widely applied using VRT in corn (LAMBERT; LOWENBERG-DeBOER, 2000). These fluctuations are in part explained by soil mapping adoption rates in those years since VRT applications are coincident with soil mapping. Corn acres with VRT seeding declined steadily, while soybean VRT seeding fell to below 1% of planted area in 2002. Some studies have concluded that VRT seeding is not profitable in corn (LOWENBERG-DeBOER, 2003 b; BULLOCK et al., 1998). However, other studies suggest that VRT seeding for cotton shows some profit potential (LARSON et al., 2004). VRT for pesticides seems to be increasing for corn, soybean, wheat and cotton, even though overall rates are still low at 1% to 3% in the most recent ARMS data.
Variable rate technology services offered by agricultural industry
The Precision Agricultural Services Dealership Survey Results has been published annually by Whipker and Akridge since 1996. In 2005, 388 useable respondents from 41 states were included in the survey. Of the service providers who offered custom applications, 67% expected to offer VRT services by the end of 2004 (WHIPKER; AKRIDGE, 2005). In 2005 and 2004, 43% and 41% of dealers offered controller-driven single product application, down from 45% and 50% in 2003 and 2002, respectively. Controller-driven multi-product application was offered by 22% of service providers in 2005, approximately the same levels as in 2002, 2003, and 2004 when 20%, 26%, and 23% of service providers, respectively, offered the service (WHIPKER; AKRIDGE, 2005). Only 30% of providers expect
Table 2. Number of yield monitors by country. Americas United States Argentina Brazil Chile Uruguay Europe U.K. Denmark France Germany Netherlands Sweden Belgium Spain Portugal Other Australia South Africa Country
1Bongiovanni, R. INTA Manfredi, Córdoba, Argentina, Personal communication, 2005. 2Bragachini, M. INTA Manfredi, Córdoba, Argentina, Unpublished manuscript, 2001.
3Conceicao, Luis Aleino. Personal communication. Escola Superior Agrária, De Elvas, Portugal, 2003.
4Molin, José Paulo. Personal communication, University of São Paulo, College of Agriculture (ESALQ), Piracicaba, SP, Brazil, 2003.
5Nell, Wilhem. Personal communication, Centre for Agricultural Management, University of the Free State, Bloemfontein, South Africa, 2000, 2004. 6STAFFORD, J. Personal communication. 5th International Conference on Precision Agriculture, 2000.
7WAGNER, P. Personal communication. Martin-Luther-Universitaet Halle-Wittenberg Professur fuer Landwirtschaftliche Betriebslehre, 2004.
30.000 1.500 130 12 4 400 400 50 4.250 6 150 6 5 4 800 15 Estimated number 2000 2005 2004 2000 2000 2000 2000 2000 2003 2000 2000 2000 2003 2003 2000 2000 Year of estimate Daberkow et al. (2002) Bongiovanni (2005)1 Molin (2003)4 Bragachini (2001)2 Bragachini (2001)2 Stafford (2000)6 Stafford (2000)6 Stafford (2000)6 Wagner (2004)7 Stafford (2000)6 Stafford (2000)6 Stafford (2000)6 ECPA participants (2003)4 Conceicao (2003)3 Lowenberg-DeBoer (2003a) Nell (2000)5 Source of estimate 335 64 4 19 7 107 247 5 523 27 119 17 1 6 42 3 Yield monitors per million hectares
Table 3. Share of U.S. corn, soybean, all wheat, and cotton planted area on which VRT was used by input,
1998-2002. 1998 1999 2000 2001 2002 Year 12.3 17.5 14.5 9.8 NA Fertilizer 4.1 4.2 4.5 2.4 NA Seed 2.4 1.1 3.8 3.8 NA Pesticides Corn
Percent of planted area
6.7 8.3 5.8 NA 5.0 Fertilizer * 2.0 2.5 NA * Seed * 1.7 1.0 NA 1.3 Pesticides Soybean 1998 1999 2000 2.6 NA 3.1 1.5 NA * 1.7 NA * All wheat 2.0 1.0 3.8 1.3 1.8 2.4 1.5 2.0 2.7 Cotton
* = Less than 1 percent. NA = not available. Source: Griffin et al. (2004), based on ARMS.
to offer multi-product applications by 2007 (WHIPKER; AKRIDGE, 2005). Although single nutrient application is the most common use of VRT, the %-increase in VRT multi-nutrient application offered was greater than for single nutrient. Whipker and Akridge found that the agricultural industry is not as interested in VRT seeding as in other PA services, with less than 10% of dealerships offering the service.
Commercial applicators are increasingly using PA technology to deliver conventional services. Pierce et al. (1999) segregate PA technologies into one of two groups. One group deals with yield monitors, soil mapping, and other sensors that provide spatial information and the second group deals with using PA technologies such as GPS to control or improve conventional applications. Sixty-four percent of applicator services use GPS guidance with manual control or light bar navigation, however only 6% use GPS auto-guidance (WHIPKER; AKRIDGE, 2005). GPS guidance has become standard practice on aerial applicators.
Yield mapping adoption (Yield monitor plus a GPS)
Most crop management uses of yield monitor data are only possible if the sensor is linked to GPS to provide location information. The yield maps which have become the icon of PA are only possible with GPS. However, yield-mapping adoption seems to be occurring at a much slower pace than yield monitoring. Although the percentage of acres of corn and soybeans harvested with a yield monitor-equipped combine gradually increased since 1996, corn and soybean area harvested with a combine yield monitor attached to a GPS did not follow the same trend as yield monitor adoption. In the U.S., corn area yield mapped peaked in 1999 at 18.4% and decreased to 13.7% in 2000. Since 1998, mapped soybean area dipped to 9.9% and 7.8% in 1999 and 2000, respectively. Soybean area yield mapped had the highest reported rate in 2002 at 10.7%, breaking the previous high of 10.2% set in 1998.
There may be several reasons why yield mapping adoption rates lag behind yield monitor adoption rates. Many combine manufacturers offer yield monitors as standard equipment on their larger machines, but GPS is often not included (GRIFFIN, 1999; LOWENBERG-DeBOER, 2003a). Thus, some combine owners acquire yield monitors whether they want the sensors or not. In some of those cases, the yield monitor is not even switched on. In other cases, it is used uncalibrated to provide rough yield differences. Some combine owners who do not wish to use the yield monitor themselves will buy it in a new combine because it is perceived that combine trade-in values are higher with a yield monitor. Logistical reasons for having a yield monitor without a GPS is that yield monitors can be used for the associated moisture measurements. Some growers use the yield monitor moisture readings to decide whether grain can be sold directly from the field or needs to be dried before sale. Case studies by Urcola (2003; LOWENBERG-DeBOER; URCOLA, 2003) showed that some farmers use the combine yield monitor as a replacement for weigh wagons by recording "loads" of field, block or strip averages rather than within-field variability.
The most often cited reason provided by farmers for not yield mapping are problems associated with data analysis. Yield data analysis requires substantial time and skill of the farm operator, crop consultant, or other analyst. Rather than farmers learning to conduct analysis, Griffin and Lambert (2005) suggest analysts teach farmers how to interpret results and make appropriate decisions. In spite of the recently released step-by-step instructions on use of spatial statistics in analysis of yield maps (GRIFFIN et al., 2005a), interpretation of yield maps is still as much an art as a science. Uncertainty about the reliability of yield maps for crop management reduces their perceived value. Thus, the cost of yield map analysis in terms of management time is perceived to be high, while the benefit is uncertain.
Some countries appear to have higher rates of yield mapping than the U.S. Some 87% of combines with yield monitors in Argentina use GPS compared to only about one-third in the U.S. For
northern Europe, some evidence suggests that the number of combines with yield monitors, but no GPS, is similar to that of the U.S. (LOWENBERG-DeBOER, 2003a). Part of the difference is due to farm structure. United States and northern European farms are often run by owner-operators who do much of their own fieldwork. In contrast, many Argentine farms are run by managers who have less direct experience with field conditions because they hire custom operators to do fieldwork. Therefore, yield data may provide more new information for Argentine managers than it does for U.S. or European owner operators. Because of high unemployment in Argentina and downward pressure on wages, management time may be less expensive than in the U.S.
Soil mapping adoption
Leading up to 2000, a positive general trend for soil mapping was observed for corn and soybean with approximately 2% increase in area each year for soybean (DABERKOW et al., 2002). One-fourth of U.S. corn area had soils that were geo-referenced. This trend appears to be leveling off for the time being. The proportion of area planted to wheat has values comparable to corn, cotton, and soybeans at 12.2% in 2000. Cotton area soil mapped has doubled each year between 1998 and 2000, starting at 3.1% and rising to 14.2%. Similar to the problems associated with yield map interpretation, understanding the spatial and temporal dynamics between soil test variables and yield is difficult, and maybe more of an art than science.
Coupled with the expenses associated with grid sampling, this uncertainty with respect to data processing and application may be another constraint with respect to soil mapping adoption. A related problem is that of resolution. How fine of a grid is needed before solid recommendations can be made? Mallarino and Wittry (2004) and Peone (2004) have recently tackled some of these questions with respect to soil test resolution. Unfortunately, like site-specific management in general, optimal soil sample resolution tends to be field-specific. On-the-go technologies such as
the Veris Technologies Mobile Sensor Platform (MSP) automate high-resolution electrical conductivity and pH sampling at relatively low costs (LOWENBEG-DeBOER, 2003c). These technologies collect data on almost a continuous basis rather than on discrete grids.
Remote sensing
Anecdotal accounts indicate that remotely sensed (RS) images are being widely used for management of fruits and vegetables. For grains and oilseeds, RS images were the least adopted technology among the group reviewed in the ARMS data set (Table 1). In 2002, only 1.7% of soybeans in the U.S. had RS images or photographs made during the growing cycle. This was the lowest reported use of RS images for any crop in any year since data collection began in 1999. The trend for both corn and soybeans was the same; fewer RS images were used over time. One reason for the decrease in the use of RS maps is the lack of perceived usefulness of mapping growing crops. A second reason is that maps of bare soils do not change over time and are only needed once. A third reason for low RS adoption rates is that there are relatively few reliable RS analysis or consulting firms.
The way in which RS images have been marketed may also discourage adoption by grain and oilseed growers. In the past, RS providers have tried to market subscriptions with an image every week or ten days. This may be good for orchards, vegetables and cotton, but not for corn and soybean for which most decisions are made around planting time. Although the ARMS survey did not examine RS in cotton during the same years as corn and soybean, evidence suggests that RS image use for cotton exceeds that of corn and soybean substantially and is expected to remain at higher levels.
In spite of the long history of research on RS imagery use in agriculture, the economics of this technology are not well researched. Tenkorang and Lowenberg-DeBoer (2004) reviewed 10 articles reporting RS economic benefits (Table 4).
Seven of the ten report positive returns. Many studies did not report the budgeting details. Very high returns appear to be gross value, with no deductions for RS image cost and analysis, or implementation of VRT management plans based on the image. Tenkorang and Lowenberg-DeBoer (2004) argue that to make progress in understanding the economics of RS for agriculture, researchers need to report yield and budget details. In addition, they advocate repeated testing of multiple locations of the same management approach to RS use. The ten RS economics studies seem to be one-of-a-kind trials or case studies that are hard to compare.
Auto-guidance
Automated guidance systems, or auto-guidance, have become commercially available in the last three years. However, benefits from this technology are not yet established. Auto-guidance makes use of GPS information automatically controlling steering of farm equipment, effectively reducing human error. This technology works in various adverse conditions including dust and
nighttime dark. Accuracy differs between systems and so do costs (WATSON; LOWENBERG-DeBOER, 2003). As with most new technologies, initial costs are relatively high, but will become less expensive over time. Benefits include allowing the operator to safely work more hours in a day, increasing ground speed, and reducing overlap. In some cases, auto-guidance allows more acres to be farmed with the same equipment set (GRIFFIN et al., 2005b). Some studies estimate that auto-guidance could increase net revenues above variable and technology costs by $69 USD to $74 USD per acre (WATSON, 2003) and allowing a 1,214 hectare farm to expand to 1,350 hectares and remain as timely (GRIFFIN et al., 2005b).
Because auto-guidance technology is new, there are at present no reliable adoption numbers available. The USDA ARMS data indicates that in 2001 and 2002 about 7% of U.S. corn and soybean farmers used some type of GPS guidance, including lightbars. Anecdotal information indicates that the use of guidance technology has grown rapidly in the last few years in the U.S., Australia, Brazil, Argentina, South Africa and other
Table 4. Studies citing returns to use of remote sensing in agriculture.
Carr et al. (1991) OSU (2002) Larson et al. (2004) Seelan et al. (2003) Authors Aerial and Satellite Aerial Aerial Satellite Type of imagery Wheat Barley Cotton Cotton Wheat, sugar beet Crop
Zone Determination using Images from Previous Seasons:
P&K fertilizer Fertilizer, insecticide, growth regulator Fertilizer, insecticide, growth regulator Nitrogen Input managed $2.15 $148.26 - $370.66(1) -$5.71 to -$36.97 $244.09(1) Average return $USD/hectare
(1) No details given on how benefit was estimated. Appears to be gross benefits without subtracting costs of images, analysis and VRA implementation.
Source: Tenkorang and Lowenberg-DeBoer (2004).
Copenhaver et al. (2002) Long (2002)
Reynolds et al. (2002) Watermeier et al. (2003) White et al. (2002) White and Gress (2002)
Aerial Aerial Aerial Aerial Aerial Aerial Soybeans Wheat Cotton, corn Corn Wheat Corn In-season management Herbicide Herbicide Herbicide Nitrogen Nitrogen Nitrogen $4.15 $2.27 $67.88 to $184.46(1) $32.12 -$2.99 -$2.62
countries. Griffin et al. (2005b) indicate that the worldwide implications for auto-guidance adoption depend on cost and availability of capital and labor, as well as potential for farm expansion. For instance, in countries such as the U.S. and European Union (E.U.), labor costs are very high relative to capital costs so labor effects of auto-guidance are valuable. In South Africa, experienced tractor operators have been lost to the AIDS epidemic and being replaced by auto-guidance. Conversely, in Brazil and Argentina where labor is relatively cheap and readily available compared to capital, the increased efficiency from reducing overlap and increasing ground speed dominate economics.
On-the-go technologies
From a logistical and economic perspective on-the-go sensing linked to application equipment has many advantages (LOWENBERG-DeBOER, 2004). In particular, on-the-go technologies reduce the management time and associated cost in implementation of VRT. The most commercially viable on-the-go technologies for crop production focus on changing nitrogen fertilizer application within fields. Both Greenseeker and Yara N-Sensor technology were originally developed for on-the-go changes in nitrogen application rates in wheat and other small grains. In addition, active normalized difference vegetative index (NDVI) readings from Greenseeker have been found to be useful in determining management zones in cotton (SHARP et al., 2004).
There are other sensor technologies that automate the collection of soils data and greatly increase the resolution of that information, but are not yet linked directly to applicators. Measurements of resistance of electrical flow through soil are being made by electrical conductivity (Veris) and electromagnetic induction (Geonics EM38) giving information about soil chemical levels and physical properties on a nearly continuous level. The Veris Technologies Mobile Sensor Platform (MSP) automates pH sampling in addition to its electrical conductivity readings. Veris MSP's were sold in at least five U.S. states since being offered in the fall of 2003 (LOWENBERG-DeBOER, 2003c) taking measurements from more than 20,000 hectares (ERICKSON, 2004).
Profitability studies
This section summarizes publicly available studies of the profitability of PA. It is an update of the PA profitability review by Lambert and Lowenberg-DeBoer (2000). Studies since 2000 are summarized by Peone et al. (2004). The information sources are refereed articles from scientific journals or proceedings, and non-technical or non-refereed magazines and monographs specializing in agribusiness services. Of the 210 of the 234 reviews reporting losses or benefits, 68% reported benefits from some sort of PA technology. Approximately half (52%) of those studies reporting benefits were written or co-authored by economists.
Profitability by technology – Of the
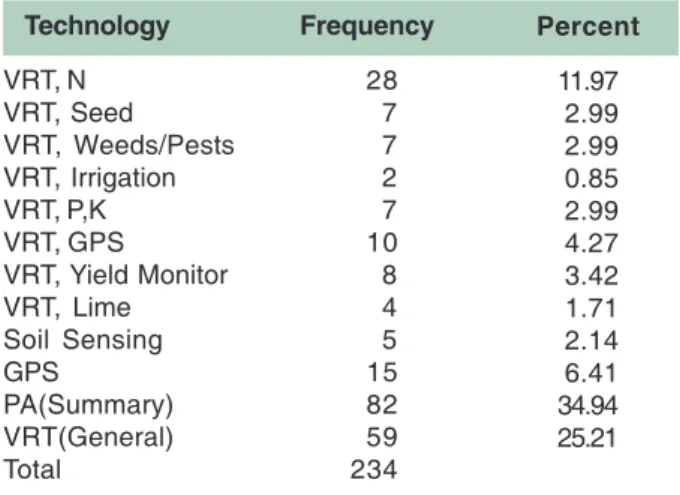
technologies specifically mentioned in the articles, PA summaries were most frequent, appearing in one-third of the literature (34%) (Table 5). GPS was mentioned in 6.4% of the articles. This does not include articles mentioning the combined use of GPS and other technologies, like yield mapping and VRT. VRT was mentioned with GPS in 4% with VRT/Yield Monitor and VRT/Seed mentioned in roughly 3% of the articles each.
Crops – Thirty-seven percent of the articles
reviewed discussed economic returns from PA experiments with corn alone, and 73% of those reporting some benefit from using PA (Table 6). The second most common crop mentioned was wheat at nearly 11% of the articles, with half of those
Table 5. Frequency (%) of PA technologies reviewed
in articles. VRT, N VRT, Seed VRT, Weeds/Pests VRT, Irrigation VRT, P,K VRT, GPS VRT, Yield Monitor VRT, Lime Soil Sensing GPS PA(Summary) VRT(General) Total Technology 28 7 7 2 7 10 8 4 5 15 82 59 234 Frequency 11.97 2.99 2.99 0.85 2.99 4.27 3.42 1.71 2.14 6.41 34.94 25.21 Percent
reporting PA benefits. Other crops mentioned were corn and soybean studies accounting for 9%, however three-fourths of those reported PA benefits. All soybean, barley and oats studies reported benefits. Corn and cotton combination studies reported no benefits to PA.
Time scale and discount rate – Factors
relating to time scale include the period of test validity (soil tests, yield maps), whether costs were spread out over an area per time period, and the net revenue period. When these details were mentioned in articles, they were noted. Twenty-nine percent of the articles reviewed included one or more of these factors.
Input and VRT/PA costs – Input costs
considered in this review were fertilizer costs, seed costs, application costs, and any variable and fixed costs mentioned in the article. Variable rate technology and PA costs were considered separately for comparative purposes to verify whether benefits espoused by the authors(s) included PA technology costs, other farm input costs, and crop yield. Seventy-one percent of the articles included farm inputs in the budget analyses while 62% included PA technology costs. One-fourth mentioned equipment costs. Forty percent mentioned yield monitors. One-third of the articles reported environmental costs and benefits associated with PA.
Human capital and information costs
-Conventional economic feasibility studies of PA technology have often failed to include human capital and information costs in budget analyses. In all, nearly 21% of the articles reviewed mentioned human capital costs. Although this may be a difficult cost to compute, it should always be addressed in economic analyses since PA is generally human-capital intensive.
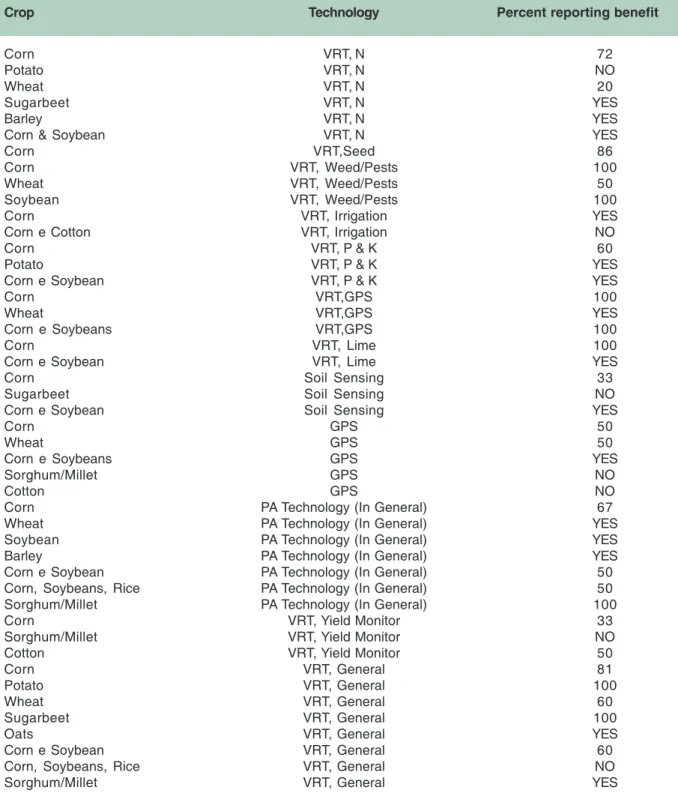
Information costs are associated with grid soil sampling, lab testing, GPS services, or any PA activity that generates data conducive to becoming useful information. Information costs were mentioned in 34% of the articles reviewed. In Table 7, benefits to specific crops from different PA technologies are presented. This table summarizes results from articles where a mention of a specific crop(s) was explicitly managed by a specific PA technology. It omits reports that reported benefits to PA but were not explicit which technology corresponded to a particular crop (for example, whole-farm PA benefits), or reports that were not specific about which crops directly benefited from a PA technology in the article.
Discussion - future directions:
where do we go from here?
It is crucial to identify key constraints before anticipating the future of new technologies. Fernandez-Cornejo et al. (2001) contrasted adoption patterns of biotechnology and PA. The question that remains with PA users and those considering PA is whether 'information-intensive' management is profitable, or whether we continue with the 'embodied knowledge' approach. 'Information-intensive' management refers to strategies that depend on farm and field level data to make decisions about input application and cropping practices. That data may be collected manually or electronically. VRT soil fertility management and integrated pest management are examples of information intensive approaches. In embodied knowledge technologies, information is purchased in the form of an input. The manager requires minimal additional data. An example of 'embodied knowledge' is hybrid corn. When it was
Table 6. Percent of studies reporting PA benefits for
specific crops. Corn Potato Wheat Soybean Sugarbeet Barley Oats Corn e Cotton Corn e Soybean Soybean, Corn & Rice Mixed Sorghum/Millet Cotton NA Crop 37.0 2.1 10.9 2.1 2.6 1.0 0.5 0.5 8.9 1.6 9.4 2.6 1.6 19.3 Percent 73 75 52 100 80 100 100 0 76 33 62 60 33 Percent reporting benefits from PA
Table 7. Crop and Technology-Specific Benefits from PA Technology(1). Corn Potato Wheat Sugarbeet Barley
Corn & Soybean Corn Corn Wheat Soybean Corn Corn e Cotton Corn Potato Corn e Soybean Corn Wheat Corn e Soybeans Corn Corn e Soybean Corn Sugarbeet Corn e Soybean Corn Wheat Corn e Soybeans Sorghum/Millet Cotton Corn Wheat Soybean Barley Corn e Soybean Corn, Soybeans, Rice Sorghum/Millet Corn Sorghum/Millet Cotton Corn Potato Wheat Sugarbeet Oats Corn e Soybean Corn, Soybeans, Rice Sorghum/Millet Crop VRT, N VRT, N VRT, N VRT, N VRT, N VRT, N VRT,Seed VRT, Weed/Pests VRT, Weed/Pests VRT, Weed/Pests VRT, Irrigation VRT, Irrigation VRT, P & K VRT, P & K VRT, P & K VRT,GPS VRT,GPS VRT,GPS VRT, Lime VRT, Lime Soil Sensing Soil Sensing Soil Sensing GPS GPS GPS GPS GPS
PA Technology (In General) PA Technology (In General) PA Technology (In General) PA Technology (In General) PA Technology (In General) PA Technology (In General) PA Technology (In General)
VRT, Yield Monitor VRT, Yield Monitor VRT, Yield Monitor VRT, General VRT, General VRT, General VRT, General VRT, General VRT, General VRT, General VRT, General Technology 72 NO 20 YES YES YES 86 100 50 100 YES NO 60 YES YES 100 YES 100 100 YES 33 NO YES 50 50 YES NO NO 67 YES YES YES 50 50 100 33 NO 50 81 100 60 100 YES 60 NO YES
Percent reporting benefit
introduced in the U.S. in the 1920s, hybrid corn was a new technology, but the knowledge needed to implement the technical package was already well-established. Two other good agricultural
examples of 'embodied knowledge' are Bt Corn and Round-up Ready soybeans. The skill needed to successfully apply these new technologies is relatively small in that the technological packages
are 'self-contained', requiring no new equipment purchases, or additional cultivating skills. An example in PA would be GPS automated guidance.
The 'information-intensive' technologies that characterize many PA technologies not only require time-costs, but they are scale-sensitive as well. For a producer willing to spend $150,000 USD to $200,000 USD on a combine, the extra $3,000 USD for GPS equipment is negligible. However, the size in area of the farm to spread the costs makes a difference. Spreading capital over area is probably less important than being able to spread human capital over the same area. For example, someone who learns how to interpret yield maps for a 2,000-hectare farm can probably interpret yield monitor data for a 20,000-hectare farm. Fountas et al. (2003) note that a key constraint to 'spreading of human costs' over farm acres is that of learning new software and other analysis skills. The opportunity cost of time may often be sufficiently high to discourage producers from learning how to accumulate, store, process, and interpret electronically generated data in the field or office computers.
Although the human cost of information intensive processes limit use, crop producers seem to be skeptical of 'closed-looped' approaches that automate decision-making. An example of a closed loop process in agriculture is the use of automated chicken feeders which adjust feed rations by average bird weight. In this instance, the producer spends less time worrying about matching feed requirements with bird growth: rations are adjusted automatically over the course of bird growth. Crop farmers argue that a 'human touch' is still needed in cropping because crop management is still more of an art than a science. The environment of a chicken house is very controlled compared to field conditions for rain fed crops. Some farmers might feel they are giving up production control by handing over their human-made decisions to the 'black-box' decision-making processes.
Earlier mentioned studies outline reasons for non-adoption, but few give alternative
encouragement for PA adoption. Overall, information technology software and hardware costs are continually declining at the same time its capacity is increasing. In a broader view, societies in developed nations are readily incorporating technology in everyday life such as personal computers, GPS in cars, and cellular telephones. People are becoming more comfortable with technology. USDA Farm Service Agency (FSA) and Natural Resources and Conservation Service (NRCS) have moved to a GIS based system to replace photocopied aerial imagery, potentially increasing producer awareness of PA benefits. Identity tracking (IT) and identify preservation (IP) of agricultural commodities from seed production through farmer fields site-specifically, all the way through the marketing, processing, and distribution chains can either offer premiums for specialty crops or segregation of transgenic varieties. Another motivation for PA adoption may be through environmental regulations for monitoring input use that could potentially affect water quality and wetlands. PA could assist in pesticide recordkeeping in much the same way as with grain with IT and IP. In addition, cost sharing of PA technologies may entice farmers to adopt. This may occur by way of studies documenting environmental benefits from PA use.
When understanding adoption trends, cultural and socio-economic factors certainly come into play. For example, anecdotal evidence suggests that auto-guidance will be adopted by grain producers in South Africa for very different reasons than those in Brazil or the U.S. In South Africa, farm workers specialized in combine and tractor operations have been lost to the AIDS epidemic. In response, some owner-operators are considering purchasing auto-guidance to replace years lost in driver skill. In contrast, in Brazil where farm labor is comparatively abundant and wages relatively low, the time and chemical savings might be the driving motivation for use of GPS guidance for sprayers. Additional examples of PA technologies being adopted in different parts of the world because of differing environmental, economic, and social conditions include:
• Auto-guidance is popular in Australia for controlled traffic because their soils are particularly susceptible to compaction and they do not have freezing and thawing to counteract that compaction.
• Outside of North America most farmers apply their own fertilizer and pesticide, so there has not been the growth of PA services experienced in the U.S. and Canada.
• In South Africa and Argentina most phosphorus and potassium is applied with the planter. For farmers using air seeders it is relatively easy to modify their equipment for VRT.
• Grid soil sampling is used commercially mainly in the U.S. and Canada, in part because soil analysis is relatively cheap.
• Agronomic skills are relatively inexpensive in Latin America, so knowledge-intensive management may catch on in countries such as Brazil before the U.S.
• Much of the VRT in Europe has focused on nitrogen because of the environmental rules regulating nitrogen application.
Implications for Brazil
While Brazil is being touted by some analysts as a good market for U.S. PA technology (CS UNITED STATES OF AMERICA, 2004), this is largely based on general arguments and informal observation. The economics of PA in Brazil have not been intensively studied, so this section will attempt to apply the lessons of PA adoption from other parts of the world. Brazil is a large country and agriculture differs from one region to another. This analysis will focus on the rapidly growing agriculture in the Center-West "Cerrados" region with some comments on how PA adoption in other parts of the country may differ from the situation in the Center-West.
Some key characteristics of Brazilian agriculture as they affect PA adoption include:
• Low cost land – The original PA concepts (e.g. variable rate input, yield monitoring) focused
on fine tuning production systems to make the most of high cost farmland in Europe and North America. When land is relatively inexpensive it may be more profitable to farm additional land with uniform rate, embodied knowledge technology, than it is to invest in the technology for information intensive variable rate input application, yield monitoring and other fine tuning. The classic PA concepts may fit better in Rio Grande do Sul and other parts of Southern Brazil where farms are smaller and land prices higher.
• Large scale – PA is essentially automation of certain management tasks. Variable rate application and yield monitoring automate agronomic management. GPS guidance automates part of equipment operations. One of the main benefits of GPS guidance is farming more land with the same equipment by reducing skip and overlap, as well as lengthening the workday (WATSON; LOWENBERG-DeBOER, 2003; GRIFFIN et al., 2005b). In the Cerrados where land is available for farm expansion, farming more land with a given set of equipment will be a substantial economic advantage.
In addition, PA tools may be useful in record keeping, supervising employees and quality control for the work of custom operators. As-applied maps and other sensor data can automatically record input application, cutting the time required for record keeping and also reducing human error in data entry. Many trucking companies in the U.S. and Europe use GPS and telemetry to track and supervise drivers. Similar software is being adapted for use by ag retailers. The next step would be adaptation for large farming operations giving the manager information in the farm office on location, speed, quality of work (e.g. combine grain loss) and other parameters. In Argentina one of the key uses of yield maps is quality control for the work of custom operators (LOWENBERG-DeBOER, 1999; BONGIOVANNI; LOWENBERG-DeBOER, 2001). PA technology may also facilitate recordkeeping for traceability and identify preservation. Automation of recordkeeping, supervision of employees and quality control is of greatest benefit on large scale farming operations such as those in the Cerrados.
• High cost of DGPS – One of the reasons cited for slow growth of GPS use in Brazil is the lack of low cost differential correction. In the 1990s, the only differential correction option was by satellite at around $2,000 USD per year per unit. This was substantially higher than the roughly $600 USD annual per GPS unit for FM sideband differential correction in Argentina at the time. In the U.S., Coast Guard and Wide Area Augmentation Service (WAAS) is available without charge. In cooperation with the Brazilian government, the U.S. Federal Aviation Agency (FAA) plans to extend WAAS to Brazil (STIGLER, 2003). Free WAAS availability should reduce this constraint to GPS use.
• Protectionist Policies & No Frills Preferences – Precision agriculture innovation in Brazil is hampered by the high cost of imported equipment and the market's preference for "no frills" machinery (McMAHON, 2005). Imported equipment can be twice the cost of Brazilian equipment because of import taxes and financing restrictions. This has motivated multinational companies to invest in manufacturing capacity in Brazil, but it has not necessarily caused them to sell their most innovative products in the country. The "no frills" preference makes economic sense for farms on the frontier far from service and parts. Service for specialized equipment might take days and require hundreds of kilometers of travel. The "no frills" preference also reflects the fact that in Brazil farm equipment is often operated by employees, not by the farm operator and his family as is often the case in the U.S. and Canada. In Brazil, farm labor is in good supply, so farmers usually do not need to invest in comfort and convenience to attract and retain employees.
The combination of a market dominated by "no frills" equipment and the high cost of imported machinery means that Brazilian innovators may find it difficult to find and to afford precision agriculture technology.
• Low cost labor – Some precision agriculture technology is labor saving (e.g. GPS guidance). When labor costs are lower, the value of saving labor is reduced.
• Commodity crops – The main crops in the Cerrados are relatively low per unit price commodity grains and oilseeds. Economic research indicates that precision agriculture is more likely to be profitable with higher value crops (SWINTON; LOWENBEG-DeBOER, 1998). The original PA concepts of variable rate application of inputs and yield monitoring may be more valuable in citrus groves and on sugar plantations, than in the Cerrados.
• Input costs – One situation in which precision agriculture has profit potential is when input costs are high and large quantities of inputs are used. Cerrados soils are generally low fertility and acidic. Large applications of fertilizer and lime are required to make them productive. While overall production costs for grains and oilseeds are lower in Brazil than they are in the U.S., Cerrados fertilizer cost per hectare is often 2 or 3 times the cost in the U.S. Corn Belt (HUERTA; MARSHALL, 2002). Variable rate application of fertilizer could help reduce fertilizer costs in Brazil. In addition, some PA technologies have the potential to reduce energy costs. Using GPS guidance to reduce overlap, cuts energy use because less land is unnecessarily covered twice. Controlled traffic farming with GPS auto-guidance can reduce fuel use because equipment is always traveling on a firm path, rather than making its way through soft soil.
• Soil variability – Variable rate fertilizer application is only profitable if there is substantial soil variability. In the U.S., natural soil variability has been increased by management-induced variability due to former feedlots, lanes and fence lines, as well as by fertilizer spreading patterns. Much of the farmland in the Cerrados is newly cleared and does not suffer from this long history of management-induced soil variability. In this sense, the Brazilian situation is similar to that of Argentina (LOWENBERG-DeBOER, 1999; BONGIOVANNI; LOWEBERG, 2001). Management-induced soil variability may be much more common in long-term farmed eastern and southern parts of Brazil than it is in the Cerrados.
• On-farm computer use – Evidence suggests that computer use in farm offices is lower in Brazil than it is in the U.S. or in Argentina. A survey in Sao Paulo state found that in 2001, about 13% of farms had a computer (FRANCISCO; PINO, 2002). The CS Market Research study estimates that in 2004 about 14% of commercial farms in Brazil have computers. In the U.S., about 50% of farms owned or leased a computer in 2001, and about 55% in 2005 (USDA, 2005b). Computer use is higher than the national average in the Corn Belt states that have been the center of PA adoption. A 2001 survey in Argentina showed that 47% of farm managers used a computer at that time (SEIFERT, 2001). The relatively low computer use on Brazilian farms can be linked to protectionist policies in computers markets in the 1970s and 80s (BUCKLEY, 2000). Will precision agriculture in Brazil suffer a similar fate because of barriers to technology imports?
Farmers can use PA technology without directly using a computer, but farm office computer use is an index of the level of comfort with electronic technology and farmers that are comfortable with computers are more likely to use PA. For classic PA technologies, such as VRT, farmers can hire a crop consultant or agronomist to analyze the data for them. They do not need to analyze the data themselves. Computers are embedded in GPS guidance and sensor technologies; users do not need to directly use or understand computers.
• Site-specific research – Classic precision farming technologies, like variable rate input application and analysis of yield maps require site-specific research. Some Latin American countries, such as Argentina, have cut back funding for agricultural research in favor of a strategy that relies on borrowing technology from abroad. For conventional uniform rate technology this was a successful strategy because it is usually much less expensive to borrow or buy technology than to develop it. Classic precision farming technologies are difficult to borrow because they rely on site-specific research.
Brazil has the advantage over many of its neighboring countries because it has an effective
and relatively well financed public agricultural research system that could do much of this site-specific research. One weakness of the Brazilian public agricultural research system is that there is relatively little farm and field-level economic work providing growers and agribusinesses guidance on which technologies are likely to prove profitable in their conditions. The publicly available Brazilian PA economics research (BRUSCO et al., 2005a, 2005b; MATTOSO, 2003) has often focused on use of PA tools in decision making (e.g. profit maps), instead of the "head-to-head" comparisons of profitability that have characterized much of the U.S. PA economics literature (SWINTON; LOWENBERG-DeBOER, 1998; LAMBERT; LOWENBERG-DeBOER, 2000; GRIFFIN et al., 2004). In the U.S., research on the economics of PA has been widely reported in the press and that has helped guide farm and agribusiness PA adoption choices.
Conclusions
Worldwide the adoption of PA technology has been slower and more localized than many analysts in the 1990s expected. The characteristics of Brazilian agriculture suggest that that pattern maybe repeated there. Relatively low land prices, modest labor costs, low management induced soil variability, relatively low on-farm computer use, production of relatively low price commodities and the relatively high cost of imported high tech equipment suggest that Brazilian growers as a whole may lag in PA adoption, particularly the classic PA concepts of yield monitor data analysis for fine tuning crop management and variable rate application.
The conditions of large scale farming operations, particularly in the Cerrados, would tend to favor adoption of GPS guidance technologies, especially as the cost of technology and GPS differential correction declines. PA technology automation of recordkeeping, employee supervision and quality control would also have its greatest advantage in large scale operations.
These overall adoption trends may differ widely in specific areas of Brazil. For example, the classic PA technology may be rapidly adopted for higher value crops (e.g. citrus) and in areas with higher farmland values (e.g. Sao Paulo, Parana and Rio Grand du Sul). If fertilizer and energy prices continue to rise rapidly, growers in the Cerrados may find it worth their while to do variable rate application. Some areas or groups of farms may benefit from targeted public or private research that adapts the general PA concepts to their particular problems.
References
BONGIOVANNI, R.; LOWENBERG-DeBOER, J. Precision agriculture in Argentina - 2001. 2001. 15 p. Available at: <http:/ /www.agriculturadeprecision.org/articulos/analecon.htm>. Accessed on: 19 Jan. 2006.
BRUSCO, J.; SOUZA, E. G. de; RODRIGUES JUNIOR, F. A.; JOHANN, J. A.; PEREIRA, J. O. Performance of corn profit maps in relation to productivity. p. 6-9. Work presented at III International Symposium on Precision Agriculture, Sete Lagoas, MG, Brazil, August, 2005a.
BRUSCO, J.; SOUZA, E. G. de; RODRIGUES JUNIOR, F. A.; JOHANN, J. A.; PEREIRA, J. O. Profit maps for soybeans in precision agriculture and conventional systems. p. 1-5. Work presented atIII International Symposium on Precision Agriculture, Sete Lagoas, MG, Brazil, August, 2005b. BULLOCK, D. G.; BULLOCK, D. S.; NAFZIGER, E. D.; DOERGE, T. A.; PASZKIEWICZ, S. R.; CARTER, P. R.; PETERSON, T. A. Does variable rate seeding of corn pay? Agronomy Journal, Madison, v. 90, n. 6, p. 830-836, 1998. BUCKLEY, S. Brazil battles over beans; farmers at odds over genetically modified crops" Washington Post, June 27, 2000. Available at: <http://www.biotech-info.net/
Brazil_battles_beans.html>. Accessed on: 19 Jan. 2006. CARR, P. P.; CARLSON, G. R.; JACOBSEN, J. S.; NIELSEN, G. A.; SKOGLEY, E. O. Farming soils, not fields: a strategy for increasing fertilizer profitability. Journal of Production Agriculture, Madison, v. 4, n. 1, p. 57-61, 1991.
COPENHAVER, K.; GRESS, T.; SPRAGUE, C.; ALDERKS, D. Variable rate application of post-emergence herbicide to soybeans using remotely sensed imagery. In: INTERNATIONAL CONFERENCE ON PRECISION AGRICULTURE, 6., 2002, Madison. Proceedings... Madison, Wisconsin: ASA-CSSA-SSSA, 2002. Edited by P. C. Robert et al.
DABERKOW, S.; McBRIDE, W. D. Socioeconomic profiles of early adopters of precision agriculture technologies. Journal of Agribusiness, Athens, v. 16, p. 151-168, 1998.
DABERKOW, S.; FERNANDEZ-CORNEJO, J.; PADGITT, M. Precision agriculture technology diffusion: current status and future prospects. In: INTERNATIONAL CONFERENCE ON PRECISION AGRICULTURE AND OTHER PRECISION
RESOURCES MANAGEMENT, 6., 2002, Madison, WI. Proceedings... Madison, WI: ASA/SSA/CSSA, 2002. Edited by P. C. Robert et al.
ENGLISH, B. C.; ROBERTS, R. K.; SLEIGH, D. E. Spatial distribution of precision farming technologies in Tennessee. Knoxville: Department of Agricultural Economics and Rural Sociology: The Tennessee Agricultural Experiment Station: The University of Tennessee, 2000. (Report, 00-08).
ERICKSON, B. Field experience validates on-the-go soil pH sensor. SSMC Newsletter, West Lafayette, Dec. 2004. Available at: <http://www.purdue.edu/ssmc>. Accessed on: 23 Jan. 2006. FRANCISCO, V. L. F. dos S.; PINO, F. A. Farm computer usage in São Paulo State, Brazil. Revista Brasileira de
Agroinformática, São Paulo, v.4, n.2, p.81-89, 2002. FERNANDEZ-CORNEJO, J.; DABERKOW, S.; McBRIDE, W. Decomposing the size effect on the adoption of innovations: agrobiotechnology and precision agriculture. AgBioForum, Columbia, v. 4, n. 2, p. 124-136, 2001. Available at: <http:// www.agbioforum.org/>. Accessed on: 23 Jan. 2006.
FOUNTAS, S.; ESS, D. R.; SORENSEN, C. G.; HAWKINS, S. E.; PEDERSEN, H. H.; BLACKMORE, B. S.; LOWENBERG-DEBOER, J. Information sources in precision agriculture in Denmark and the USA. In: EUROPEAN CONFERENCE ON PRECISION AGRICULTURE 4., 2003, Berlin. Precision agriculture: proceedings... Berlin: Wageningen Academic Pub., 2003. p. 211-216. Edited by A. Werner and A. Jarfe.
GRIFFIN, T. W. In search of precision: the assessment of Arkansas's early adopters of precision farming and an economic analysis of the profitability of variable rate technology in a simulated rice and soybean rotation on Arkansas silt loam and clay soils. 1999. Thesis (Master)-Department of Agricultural Economics and Agribusiness, University of Arkansas, Fayetteville, Arkansas, 1999.
GRIFFIN, T.; LAMBERT, D. Teaching interpretation of yield monitor data analysis: lessons learned from Purdue's 37th Top Farmer Crop Workshop. Journal of Extension [on line], v. 23, n. 3, Jun. 2005. Available at: <http://www.joe.org/joe/2005june/ iw5.shtml>. Accessed on: 23 Jan. 2006.
GRIFFIN, T. W.; BROWN, J.; LOWENBERG-DeBOER, J. Yield monitor data analysis: data acquisition, management and analysis protocol. West Lafayette: Purdue University: SSMC, 2005a. 27 p. Available at: <http://www.purdue.edu/ssmc>. Accessed on: 24 Jan. 2006.
GRIFFIN, T. W.; LAMBERT, D. M.; LOWENBERG-DeBOER, J. Economics of lightbar and auto-guidance GPS navigation technologies. In: EUROPEAN CONFERENCE ON PRECISION AGRICULTURE, 5., 2005, Uppsala, Sweden. Precision agriculture 05, Uppsala, Wageningen Academic Pub., 2005b. p. 581-587. Edited by John Stafford.
GRIFFIN, T.W.; LAMBERT, D. M.; LOWENBERG-DeBOER, J. Testing for appropriate on-farm trial designs and statistical methods for precision farming: a simulation approach. In: INTERNATIONAL CONFERENCE ON PRECISION AGRICULTURE AND OTHER PRECISION RESOURCES MANAGEMENT, 7., 2004, Madison. Proceedings... Madison: ASA/SSSA/CSSA, 2004.
GRIFFIN, T. W.; POPP, J. S.; BULAND, D. V. Economics of variable rate application of phosphorous on a rice and soybean rotation in Arkansas. In: INTERNATIONAL CONFERENCE ON PRECISION AGRICULTURE, 5., 2001, Madison, Wisconsin. Proceedings... Madison, Wisconsin: ASA/SSSA/CSSA, 2001. Edited by P. C. Robert, R. H. Rust and W. E. Larson.
GRIFFIN, T. W.; LOWENBERG-DEBOER, J.; LAMBERT, D. M.; PEONE, J.; PAYNE, T.; DABERKOW, S. G. Adoption, profitability and making better use of precision farming data. West
Lafayette, IN, USA: Department of Agricultural Economics, Purdue University, 2004. 20 p. (Staff paper, 04-06).
GRIFFIN, T. W.; ROSKAMP, G. K.; TERRY, D.; BAKER, W. H.; BRINKLEY, L. E.; ANTUNIASSI, U. R.; JACCOUD-FILHO, D. S.; MUSSELMAN, A. L.; SHARP, T. C. International
advancement & achievement in global precision agriculture in the United States and Brazil. In: INTERNATIONAL
CONFERENCE ON PRECISION AGRICULTURE, 6., 2002, Madison, Wisconsin. Proceedings... Madison, Wisconsin: ASA-CSSA-SSSA, 2002. Edited by P. C. Robert et al.
HUERTA, A.; MARTIN, M. Soybean production: competitive positions of United States, Brazil and Argentina. Purdue Agricultural Economics Report, West Lafayette, p. 5-10, Nov. 2002. Available at: <http://www.agecon.purdue.edu/extension/ pubs/paer1102.pdf>. Accessed on: Jan. 2006.
KHANNA, M. Sequential adoption of site-specific technologies and its implications for nitrogen productivity: a double selectivity model. American Journal of Agricultural Economics, Ames, v. 83, n. 1, p. 35-51, Feb. 2001.
KITCHEN, N. R.; SNYDER, C. J.; FRANZEN, D. W.; WIEBOLD, W. J. Educational needs of precision agriculture. Precision Agriculture, New York, v. 3, n. 4, p. 341-351, Dec. 2002. LAMBERT, D.; LOWENBERG-DeBOER, J. Precision agriculture profitability review West Lafayette: Site-Specific Management Center, Purdue University, 2000. Available at: <http:// www.purdue.edu/SSMC/>. Accessed on: Jan. 2006.
LARSON, J.A.; ROBERTS, R. K.; ENGLISH, B. C.; COCHRANE, R. L.; SHARP, T. A case study analysis of a precision farming system for cotton. Paper presented at the Beltwide Cotton Conference, San Antonio, TX, 2004.
LONG, D. Large-scale aerial remote sensing to improve management of agricultural chemicals: report prepared for the Chouteau County Conservation District, July, 2002. Available at: <http://www.ag.montana.edu/narc/PDF%20Doc/
Final%20Report.pdf>. Accessed on: Jan. 2006.
LOWENBERG-DeBOER, J. Economics of variable rate planting for corn. 2003b. Available at: <http://
www.agriculturadeprecision.org/enscamp/
VariableRatePlantingLDB.htm>. Accessed on: Jan. 2006. LOWENBERG-DeBOER, J. The management time economics of on-the-go sensing for nitrogen application. SSMC Newsletter, West Lafayette, May, 2004. Available at: http://
www.purdue.edu/ssmc>. Accessed on: Jan. 2006.
LOWENBERG-DeBOER, J. Precision agriculture in Argentina. Modern Agriculture. 1999. Available at: <http://
www.eomonline.com/modernagsite/department/>. Accessed on: Jan. 2006.
LOWENBERG-DeBOER, J. Precision farming or convenience agriculture. In:AUSTRALIAN AGRONOMY CONFERENCE, 11., 2003, Geelong, Victoria. Solutions for a better environment: proceedings... Geelong, Victoria: Australian Society of Agronomy, 2003. Available at: <http://www.regional.org.au/au/ asa/2003/i/6/lowenberg.htm>. Accessed on: Jan. 2006. LOWENBERG-DeBOER, J. Soil pH sensor commercialized. SSMC Newsletter, West Lafayette, Dec.2003. Available at <http://www.purdue.edu/ssmc>. Accessed on: Jan. 2006.
LOWENBERG-DeBOER, J.; URCOLA, H. How should yield monitor data be combine with other information sources in choosing hybrids and varieties? SSMC Newsletter, West Lafayette, Jan. 2003. Available at: <http://www.purdue.edu/ ssmc>. Accessed on: Jan. 2006.
LOWENBERG-DEBOER, J.; LAMBERT, D. M.;
BONGIOVANNI, R. Appropriate on-farm trial designs for precision agriculture. In: EUROPEAN CONFERENCE ON PRECISION AGRICULTURE, 4., 2003, Wageningen.
Proceedings... Wageningen: Academic Publishers, 2003. Edited by J. Stafford & A. Werner.
MALLARINO, A. P.; WITTRY, D. J. Efficacy of grid and zone soil sampling approaches for site-specific assessment of phosphorus, potassium, pH, and organic matter. Precision Agriculture, New York, v. 5, n. 2, 2004.
MATTOSO, M. J. Viabilidade econômica da agricultura de precisão. Presentation at the 1st International Precision Agriculture Workshop for the Southern Cone, Oct., 2003. McMAHON, K. Buying in Brazil. Farm Industry News, Minneapolis, July, 2005. Available at: <http://
farmindustrynews.com/mag/farming_buying_brazil/>. Accessed on: Jan. 2006.
NORTON, G.W.; SWINTON, S. M. Precision agriculture: global prospects and environmental implications". In: INTERNATIONAL CONFERENCE OF AGRICULTURAL ECONOMISTS, 24., 2000, London. Tomorrow's agriculture: incentives, institutions, infrastructure and innovations: proceedings. London: Ashgate, 2000. p. 269-286. Edited by G.H. Peters and P. Pingali.
OKLAHOMA STATE UNIVERSITY. Reducing cotton production costs using remote sensing and spatially variable insecticide/ defoliation (SVI/SVD) technologies. 2002. Available at: http:// www.cotton.org/cf/projects/general-prof-precision-ag.cfm. Accessed on: Jan. 2006.
PEONE, J. Management strategy for corn-soybean fields with isolated low phosphorus and potassium soil test areas. 2004. Thesis (Master)-Department of Agriculture Economics, Purdue University, West Lafayette, IN, 2004.
PEONE, J.; LOWENBERG-DeBOER, J.; LAMBERT, D. M.; GRIFFIN, T. W. Precision agriculture profitability review - part 2. West Lafayette: Site-Specific Management Center; Purdue University, 2004.
PIERCE, F.; NOWAK, P.; ROBERTS, P. C. Aspects of precision agriculture. San Diego: Academic Press, 1999. p. 1-85. (Advances in Agronomy, 67).
POPP, J.; GRIFFIN, T. Adoption, profitability and potential trends of precision farming in Arkansas. Selected paper for the Southern Agricultural Economics Association Annual Meeting Lexington, KY, January 29-Fevruary 2, 2000.
POPP, J.; GRIFFIN, T.; PENDERGRASS, E. How cooperation may lead to consensus assessing the realities and perceptions of precision farming in your state. Journal of the American Association of Farm Managers and Rural Appraisers, Denver, p. 26-31, 2002.
REYNOLDS, D. B.; SHAW, D. R.; COX, M. S.; BRUCE, L. M. Detection and site-specific control of weeds through remote sensing. 1999. 2 p. Available at: http://www.rstc.msstate.edu/ publications/ 99-01/rstcofr01-010.pdf>. Accessed on: Jan. 2006.
SEELAN, S.; LAGUETTE, S.; CASADY, G.; SEIELSTAD, G. Remote sensing applications for precision agriculture: a learning community approach. Remote Sensing &
Environment, New York, v. 88, n. 1-2, p. 157-169, Nov. 2003. SEIFERT, R. Más cerca del mundo. La Nación, Buenos Aires, Nov. 2001. (Agricultural supplement el campo). Disponible at: <http://www.lanacion.com.ar/>. Accessed on: Jan. 2006. SHARP, T.C.; EVANS, G.; SALVADOR, A. Weekly NDVI relationships to height, nodes and productivity index for low, medium, and high cotton productivity zones. Paper presented at the Beltwide Cotton Conference, San Antonio, TX, 2004. SIGLER, E. WAAS international expansion. SatNav News, Washington, n. 20, p. 2-3, June 2003. Available at: <http:// gps.faa.gov/Library/Data/SatNav/satnavJune-2003.htm#2>. Accesed on: Jan. 2006.
SWINTON, S. M.; LOWENBERG-DEBOER, J. Evaluating the profitability of site specific farming. Journal of Production Agriculture, Madison, v. 11, n. 4, p. 439-446, Oct./Dec. 1998. TENKORANG, F.; LOWENBERG-DeBOER, J. Observations on the economics of remote sensing in agriculture. SSMC Newsletter, West Lafayette, 2004. Available at: <http:// www.purdue.edu/ssmc>. Accessed on: Jan. 2006.
UNITED STATES OF AMERICA . Department of Agriculture, Economic Research Service. Agricultural chemicals and production technology: questions and answers. Washington, 2005.Available at: <http://www.ers.usda.gov/Briefing/ AgChemicals/Table1.htm>. Accessed on: Jan. 2006. UNITED STATES OF AMERICA . Department of Agriculture, National Agriculture Statistics Service. Farm computer usage and ownership. Washington, 2005. Available at: <http:// usda.mannlib.cornell.edu/reports/nassr/other/computer/ fmpc0705.pdf>. Accessed on: Jan. 2006.
UNITED STATES OF AMERICA. Department of Commerce. Commercial Service. Market research: Brasil. Precision agricultural equipment: August 2004. 6p. Available at: <http:// www.buyusainfo.net/docs/x_1228091.pdf>. Accessed on: 20 Jan. 2006.
URCOLA, H. Economic value added by yield monitor data from the producer's own farm in choosing hybrids and varieties.
2003. Thesis (Master)-Department of Agricultural Economics, Purdue University, West Lafayette, IN, 2003.
WATERMEIER, N.; WHITE, S.; RZEWNICKI, P. In-season variable rate application of nitrogen in corn-based on remotely sensed imagery. In: OHIO GEOSPATIAL TECHNOLOGIES CONFERENCE AGRICULTURE AND NATURAL RESOURCES 2003, Columbus, Ohio. Proceedings... Columbus: Ohio State University, 2003. 1 v. Edited by Lawrence Spencer. Available at: <http://geospatial.osu.edu/conference/proceedings/ index.html#link5>. Accessed on: Jan. 2006.
WATSON, M. Economic feasibility of auto guidance in the midwest. 2003. Thesis (Master)-Department of Agriculture, Economics, Purdue University, West Lafayette, IN, 2003. WATSON, M.; LOWENBERG-DeBOER, J. Who will benefit from GPS auto guidance in the corn belt? SSMC Newsletter, West Lafayette, 2003. Available at: <http://www.purdue.edu/ ssmc>. Accessed on: Jan. 2006.
WHIPKER, L. D.; AKRIDGE, J. T. Clear reception. Croplife, June 2005. Available at: <http://www.croplife.com/>. Accessed on: Jan. 2006.
WHITE, S. E.; GRESS, T. The use of remotely sensed imagery to make in-season nitrogen recommendations for corn. In: INTERNATIONAL CONFERENCE ON PRECISION AGRICULTURE AND OTHER PRECISION RESOURCES MANAGEMENT, 6., Madison, 2002. Proceedings... Madison: ASA/SSA/CSSA, 2002. Edited by P. C. Robert et al.
WHITE, S. E.; BETHEL, M.; GRESS, T. The use of remotely sensed imagery to make nitrogen recommendations on winter wheat in Western Kentucky. In: INTERNATIONAL
CONFERENCE ON PRECISION AGRICULTURE AND OTHER PRECISION RESOURCES MANAGEMENT, 6., Madison, 2002. Proceedings... Madison: ASA/SSA/CSSA, 2002. Edited by P. C. Robert et al.
WIEBOLD, W. J.; SUDDUTH, K. A.; DAVIS, J. G.; SHANNON, D. K.; KITCHEN, N. R. Determining barriers to adoption and research needs of precision agriculture. Report to the North Central Soybean Research Program, 1998. Available at: <http:// www.fse.missouri.edu/MPAC/pubs/parpt.pdf>. Accessed on: Jan. 2006.