HESSD
7, 5805–5849, 2010Rain event properties and dimensionless
rain event hyetographs
A. T. Haile et al.
Title Page
Abstract Introduction
Conclusions References
Tables Figures
◭ ◮
◭ ◮
Back Close
Full Screen / Esc
Printer-friendly Version Interactive Discussion
Discussion
P
a
per
|
Dis
cussion
P
a
per
|
Discussion
P
a
per
|
Discussio
n
P
a
per
|
Hydrol. Earth Syst. Sci. Discuss., 7, 5805–5849, 2010 www.hydrol-earth-syst-sci-discuss.net/7/5805/2010/ doi:10.5194/hessd-7-5805-2010
© Author(s) 2010. CC Attribution 3.0 License.
Hydrology and Earth System Sciences Discussions
This discussion paper is/has been under review for the journal Hydrology and Earth System Sciences (HESS). Please refer to the corresponding final paper in HESS if available.
Rain event properties and dimensionless
rain event hyetographs at the source of
the Blue Nile River
A. T. Haile1,2, T. Rientjes1, E. Habib2, and V. Jetten1 1
Department of Water Resources, ITC, P.O. Box 6, 7500AA, Enschede, The Netherlands
2
Department of Civil Engineering, University of Louisiana at Lafayette, Lafayette, LA 70504, USA
Received: 31 July 2010 – Accepted: 2 August 2010 – Published: 17 August 2010
Correspondence to: A. T. Haile ([email protected])
HESSD
7, 5805–5849, 2010Rain event properties and dimensionless
rain event hyetographs
A. T. Haile et al.
Title Page
Abstract Introduction
Conclusions References
Tables Figures
◭ ◮
◭ ◮
Back Close
Full Screen / Esc
Printer-friendly Version Interactive Discussion
Discussion
P
a
per
|
Dis
cussion
P
a
per
|
Discussion
P
a
per
|
Discussio
n
P
a
per
|
Abstract
In the present study, the spatial and temporal patterns of the rain event properties are analysed. The event properties are rain event depth, event duration, mean event in-tensity, peak intensity and the time span between two consecutive rain events which is referred to as inter-event time (IET). Dimensionless event hyetographs are
estab-5
lished by relating fractions of event intensities to the corresponding fractions of event durations. The spatial variation of the characteristics of the hyetographs is also evalu-ated. A model in the form of the beta distribution function is applied to reproduce the dimensionless hyetographs. Rainfall data is obtained from a field campaign in two wet seasons of June–August (JJA) of 2007 and 2008 in the Gilgel Abbay watershed that is
10
situated at the source basin of the upper Blue Nile River in Ethiopia. The rainfall data was recorded at eight stations. The results reveal that rain event depth is more related to peak intensity than to event duration. At the start and towards the end of the wet season, the rain events have larger depth with longer duration and longer IET than the rain events in the mid-season. Mean event intensity and IET are strongly related to
15
terrain elevation. Sekela which is on a mountain area has the shortest IET while Bahir Dar which is at the south shore of the lake has the longest IET.
1 Introduction
An understanding of rain event properties at specific spatio-temporal scales is of great importance for both hydrology as well as for climate studies. According to Brown et
20
al. (1985), rain events are a convenient way of summarizing a time series of rainfall amounts into entities that are defined so that they are meaningful in terms of a particu-lar application. Such applications include studies of runoffgeneration (e.g. Kusumastuti et al., 2007; Milly and Eagelson, 1987), soil erosion (e.g. Angel et al., 2005), intercep-tion losses (e.g. Zeng et al., 2000) and rainfall modeling (e.g. Wooliser and Osborn,
25
HESSD
7, 5805–5849, 2010Rain event properties and dimensionless
rain event hyetographs
A. T. Haile et al.
Title Page
Abstract Introduction
Conclusions References
Tables Figures
◭ ◮
◭ ◮
Back Close
Full Screen / Esc
Printer-friendly Version Interactive Discussion
Discussion
P
a
per
|
Dis
cussion
P
a
per
|
Discussion
P
a
per
|
Discussio
n
P
a
per
|
Properties of single rain events often vary at scales much smaller than a watershed scale and event properties consequently affect runoffgeneration. For a synthetic wa-tershed, Kusumastuti et al. (2007) showed that variability within a rain event which is referred to as intra-event variability can largely affect quick runoff generation mech-anisms and consequently affects flood generation. Robinson and Sivapalan (1997);
5
Menabde and Sivapalan (2001) showed that the runoffdischarge is proportional to the watershed area for relatively small watersheds with a response time less than the mean duration of rain events.
Rain event properties also serve as main inputs to soil erosion studies, e.g. Diodato and Bellocchi (2007). However, lack of long-term rainfall records at the required spatial
10
and temporal resolution often restricts the applicability of erosion models in many re-gions. van Dijk et al. (2005) state that this problem has been overcome in two ways: (i) by using synthetic time series of rain events, or (ii) by using empirical relations between hydrological model variables and more readily available rainfall characteristics, see Re-nard and Freimund (1994); Diodato and Bellocchi (2007). The use of synthesized or
15
empirical relations to derive rain event properties can benefit from an understanding of these properties through measurement of rainfall at least on a short term base. The calibration of disaggregation models requires availability of short-term sub-daily records at one or more rain gauge stations, e.g. Arnaud et al. (2007); Koutsoyiannis and Onof (2001).
20
Huff (1967) established a relation between the fraction of rain event depth and the corresponding fraction of rain event duration through dimensionless hyetographs. These hyetographs are also called “Huffcurves”, see Tsubo et al. (2005). Huff(1967) showed that the dimensionless hyetograph for an area in Illinois was only affected little by event depth and event duration. Woolhiser and Osborn (1985) observed that the
di-25
HESSD
7, 5805–5849, 2010Rain event properties and dimensionless
rain event hyetographs
A. T. Haile et al.
Title Page
Abstract Introduction
Conclusions References
Tables Figures
◭ ◮
◭ ◮
Back Close
Full Screen / Esc
Printer-friendly Version Interactive Discussion
Discussion
P
a
per
|
Dis
cussion
P
a
per
|
Discussion
P
a
per
|
Discussio
n
P
a
per
|
years to obtain sufficient data for statistical analysis.
Rainfall models that are based on dimensionless hyetographs are presented in Wool-hiser and Osborn (1985); Garcia-Guzman and Aranda-Oliver (1993). Other examples are Bras (1979) who applied the dimensionless hyetograph concept to study the sam-pling of the rainfall-runoffprocess and Tsubo et al. (2005) who developed
dimension-5
less hyetographs for the Highveld of South Africa. Similar studies, however, are notice-ably absent for the Upper Blue Nile Basin in Ethiopia.
The use of only one or two rain gauge stations may not be adequate to evaluate the spatial pattern of rain event properties (see Brown et al., 1985; Tsubo et al., 2005). To analyze the effect of terrain attributes such as elevation on rain event properties,
10
(see Loukas and Quick, 1996; Palecki et al., 2005), records from spatially distributed rain gauge stations are required. These type of data are not commonly available and studies that report on the spatial and temporal patterns of rain event properties are absent for many geographic locations which also applies for the Upper Blue Nile basin. As part of the present study, a network of 10 recording rain gauges was setup in May
15
2007 at the source basin of the Upper Blue Nile River. From the network, eight stations recorded the rainfall data of the full wet season of the year 2007, i.e. June–August (JJA) while only 2 rain gauges recorded the full wet season rainfall of 2008. The remaining gauges did not record the full season rainfall probably due to human interference.
In Haile et al. (2009), the orientation of the rain gauges is presented and the spatial
20
pattern of the diurnal cycle of the basin rainfall is analyzed which showed that both orography and the presence of Lake Tana affect the spatial pattern of the diurnal cycle. Using the same rain gauge network as in the present study, Haile et al. (2010) showed that runoff simulations in the basin are largely sensitive to rainfall representation and reported runoff volume errors as large as 15–40% when the model input is only from
25
HESSD
7, 5805–5849, 2010Rain event properties and dimensionless
rain event hyetographs
A. T. Haile et al.
Title Page
Abstract Introduction
Conclusions References
Tables Figures
◭ ◮
◭ ◮
Back Close
Full Screen / Esc
Printer-friendly Version Interactive Discussion
Discussion
P
a
per
|
Dis
cussion
P
a
per
|
Discussion
P
a
per
|
Discussio
n
P
a
per
|
We analyzed the temporal patterns of rain event properties using rainfall records of Jema station which recorded the rainfall data for the wet season of the years 2007 and 2008. This station is situated at an intermediate location between the mountains of the Gilgel Abbay watershed and Lake Tana. Haile et al. (2010) suggested that Jema station should be part of any rain gauge network that is applied to estimate rainfall input
5
to a runoffmodel.
In this study the spatial patterns of rain event properties are evaluated using data from eight stations that recorded the JJA 2007 raifall. Rain event properties that are of general interest to the study of hydrological processes are rain event depth, intensity, duration and inter-event time (IET). We developed dimensionless event hyetographs for
10
selected stations while the spatial variation of the characteristics of the hyetographs is evaluated. Finally, a beta distribution type model is fitted to the observed dimensionless hyetographs.
2 Study area
The Upper Gilgel Abbay watershed is located between 10◦56′to 11◦22′N latitude and
15
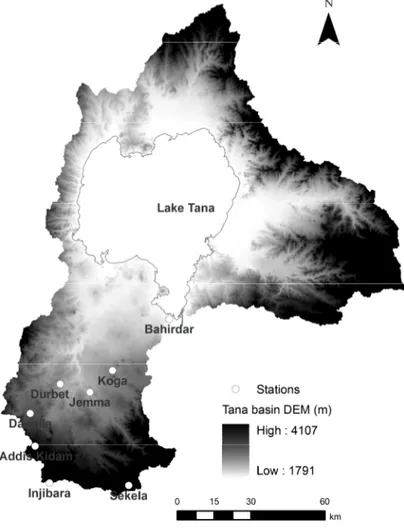
36◦44′to 37◦03′E longitudes. The main wet season of the area is June to September while the main dry season is October to May. The characteristics of the catchment are presented in Fig. 1. The figure shows the Digital Elevation Model (DEM) of the watershed and the locations of the rain gauges that provided the rainfall records for this study. The topographic characteristics of these stations is presented in Haile et
20
HESSD
7, 5805–5849, 2010Rain event properties and dimensionless
rain event hyetographs
A. T. Haile et al.
Title Page
Abstract Introduction
Conclusions References
Tables Figures
◭ ◮
◭ ◮
Back Close
Full Screen / Esc
Printer-friendly Version Interactive Discussion
Discussion
P
a
per
|
Dis
cussion
P
a
per
|
Discussion
P
a
per
|
Discussio
n
P
a
per
|
3 Methods
3.1 Properties of rain events
Criteria to identify rain events often rely on threshold values for selected properties of rain events. For instance, the duration and intensity of rain events may serve to identify events (see Dunkerley, 2008b). Commonly, thresholds for the minimum inter-event
5
time (MIT) and/or the minimum event depth serve to identify rain events or to classify a series of rain observations as a single event. Dunkerley (2008a, b) reviewed a large number of criteria and reported that the applied MIT varies from 3 min to 24 h while the minimum event depth varies from the measurable amount that is the detection threshold of the rain gauge to 13.0 mm. A consequence of a change in criterion for
10
instance could be that the mean event intensity may decrease as the MIT increases since the events may include several rainless periods.
By absence of a commonly applied criterion in literature, a set of criteria has been chosen to identify rain events, i.e. to mark the start and end time of the events. The applied criteria are a minimum event depth of 1.0 mm and a minimum inter-event time
15
(MIT) of 30 min. According to Brown et al. (1985), rain events identified by such crite-ria can be termed “primitive” events and are based on the simplest and most logical approach without the use of additional information regarding the synoptic weather con-dition such as cloudiness.
The rain event properties that are analyzed in the present study include event depth,
20
event duration, mean event intensity, peak intensity of an event and inter-event time (IET) which is defined as the length of the dry period between two consecutive events. These event properties are selected since they are considered to be relevant to hydro-logic studies. The reader is referred to Dunkerley (2008a,b) for further discussion on the importance of these event properties in hydrologic studies.
HESSD
7, 5805–5849, 2010Rain event properties and dimensionless
rain event hyetographs
A. T. Haile et al.
Title Page
Abstract Introduction
Conclusions References
Tables Figures
◭ ◮
◭ ◮
Back Close
Full Screen / Esc
Printer-friendly Version Interactive Discussion
Discussion
P
a
per
|
Dis
cussion
P
a
per
|
Discussion
P
a
per
|
Discussio
n
P
a
per
|
The event depth (de) is defined as:
de=
Ed
X
i=1
Ii (1)
whereEd is the event duration while Ii is the one-minute rainfall depth at the minute since the start time of the rain event.
The mean event intensity (Re) is:
5
Re=de
Ed (2)
wheredeandEdare the depth and the duration of the rain event, respectively. The peak intensity (Imax) is:
Imax= max
1≤i≤Ed(60Ii) (3)
where max indicates the maximum while the constant 60 is applied to convert the
one-10
minute rainfall depth to hourly rainfall intensity. The remaining terms are as defined previously.
Relations between the various event properties are evaluated through the Pearson’s product-moment correlation. The effect of terrain elevation on the event properties is also evaluated.
15
3.2 Dimensionless event hyetographs
A dimensionless hyetograph relates the fractions of rain event depth to the respective fractions of rain event duration. Following Garcia-Guzman and Aranda-Oliver (1993); Tsubo et al. (2005), the 10%, 50% and 90% fractions of event depth are selected to develop dimensionless hyetographs since these correspond to small, normal and large
20
HESSD
7, 5805–5849, 2010Rain event properties and dimensionless
rain event hyetographs
A. T. Haile et al.
Title Page
Abstract Introduction
Conclusions References
Tables Figures
◭ ◮
◭ ◮
Back Close
Full Screen / Esc
Printer-friendly Version Interactive Discussion
Discussion
P
a
per
|
Dis
cussion
P
a
per
|
Discussion
P
a
per
|
Discussio
n
P
a
per
|
south shore of Lake Tana, Sekela which is on the mountain area and Jema which is at an intermediate location between Bahir Dar and Sekela. Haile et al. (2009) showed that the diurnal cycle of the rainfall at Bahir Dar is largely different from the other stations in the basin while in Haile et al. (2010) it is shown that the rainfall of Jema and Sekela stations largely affect the accuracy of runoffsimulations in the Gilgel Abbay watershed
5
of Lake Tana basin.
The dimensionless hyetographs at the selected stations are evaluated graphically and statistically. Following Tsubo et al. (2005), the Kolmogorov-Smirnov goodness of fit test is applied to evaluate whether differences between the hyetographs are statistically significant. The absolute value of the difference (D) in the fractional event depths of
10
two dimensionless hyetographs at the incrementj of the fraction of the event duration reads:
Dj=Hj,1−Hj,2
(4)
where:Hj is the fraction of the accumulated rain event depth over the time interval (0,t) wheretis time instant which is expressed as the fraction of the total event duration, for
15
instancet=j
10 for a process with 10 increments wherej =1, 2, 3, . . . , 9, 10. The subscripts 1 and 2 indicate the two dimensionless hyetographs that are compared.
The test statistic (D) for the Kolmogorov-Smirnov test is defined as:
D=max(Dj) (5)
where: max indicates that the maximumDj in Eq. (4) is used as the test statistic. The
20
critical valuesDα,nfor a selected significance levelα and number of incrementsnare presented in text books on statistics such as Zar (1996) that is used in this study. The null hypothesis is that the two hyetographs are from the same statistical distribution and therefore will be rejected ifD in Eq. (5) exceedsDα,n.
A model in the form of a beta distribution function is applied to reproduce the
ob-25
HESSD
7, 5805–5849, 2010Rain event properties and dimensionless
rain event hyetographs
A. T. Haile et al.
Title Page
Abstract Introduction
Conclusions References
Tables Figures
◭ ◮
◭ ◮
Back Close
Full Screen / Esc
Printer-friendly Version Interactive Discussion
Discussion
P
a
per
|
Dis
cussion
P
a
per
|
Discussion
P
a
per
|
Discussio
n
P
a
per
|
for 0< Zj<1 at a fixed time is, see Woolhiser and Osborn (1985); Garcia-Guzman and Aranda-Oliver (1993):
Z1=H1 (6)
Zj=Hj−Hj−1
1−Hj−1 (7)
whereHj is as defined previously andj =2,3,. . . ,9.
5
Following Garcia-Guzman and Aranda-Oliver (1993); Tsubo et al. (2005), a model in the form of the beta distribution function is fitted to the distribution of the increment process. The beta distribution function for the increment processZ is:
f(Z)= Γ(α+β)
Γ(α)Γ(β)·Z
α−1(1−Z)β−1 (8)
where Γ is the gamma function, α>0. Both are shape parameters which are fitted
10
using thechniques of optimization. In this study, the maximum likelihood method is applied. Garcia-Guzman and Aranda-Oliver (1993) described that when α<β, it is more probable to have all observedHjclose to zero than close to one while forα=β>1, the beta density is symmetrical and has a maximum at t=0. For α=β<1, the beta density has a minimum att=0. The data base in the present study is considered too
15
limited to evaluate the sensitivity of the model parameters to factors such as rain event duration.
3.3 Conditional probability of rainfall occurrences
The estimation of the conditional probability of rainfall occurrence at any two stations is important to understand the spatial structure of rainfall intermittence in particular
20
HESSD
7, 5805–5849, 2010Rain event properties and dimensionless
rain event hyetographs
A. T. Haile et al.
Title Page
Abstract Introduction
Conclusions References
Tables Figures
◭ ◮
◭ ◮
Back Close
Full Screen / Esc
Printer-friendly Version Interactive Discussion
Discussion
P
a
per
|
Dis
cussion
P
a
per
|
Discussion
P
a
per
|
Discussio
n
P
a
per
|
the intermittence of daily rainfall for Colorado and North Carolina. Haile et al. (2009) evaluated the temporal structure of the hourly rainfall intermittence in the Gilgel Abbay watershed but ignored the spatial structure of the rainfall intermittence that is evaluated in the present study.
The probability (Pi j) that it is raining at stationj while it is raining at stationi as well
5
can be estimated through the conditional probability that is defined as:
Pi j= rb
rb+ri+rj (9)
whererb is the number of time steps when there was rain at both stations; ri is the number of rainfall occurrences at stationi while it is not raining at station j;rj is the number of rainfall occurrences at station j while it is not raining at station i. Pi j= 0
10
shows that it does not rain at all at station j when it is raining at station i while Pi j shows that it always rains at stationj when it is raining at stationi. Note thatPi j is not necessarily equal to Pj i. The conditional probability of rainfall occurrences has been estimated for an arbitrary chosen time interval of 1 h, 6 h and 1 day to evaluate the change in probability with changing time scales. The use of 6 h and 1 day intervals
15
allows considering effects of event durations longer than 1 h. An arbitrarily chosen rainfall depth of 1 mm is defined to differentiate rainy from non-rainy time periods.
4 Results
4.1 Rain event properties
In this section, the rain event properties at Jema station are analysed. Jema station is
20
HESSD
7, 5805–5849, 2010Rain event properties and dimensionless
rain event hyetographs
A. T. Haile et al.
Title Page
Abstract Introduction
Conclusions References
Tables Figures
◭ ◮
◭ ◮
Back Close
Full Screen / Esc
Printer-friendly Version Interactive Discussion
Discussion
P
a
per
|
Dis
cussion
P
a
per
|
Discussion
P
a
per
|
Discussio
n
P
a
per
|
orography and the presence of the lake. A total of 236 rain events have been observed at Jema with 122 events in JJA 2007 and 114 events in JJA 2008.
Table 1 shows the statistics of the rain events at Jema station. A maximum event depth of 67.6 mm has been recorded in the two seasons. This event depth is 12 times higher than the median of the observed event depths which is only 5.6 mm indicating
5
that the event can be considered an extreme event. In terms of event duration, a single event has lasted up to 344 min, i.e. about 5.7 h However, the median of the duration of the rain events is only about 1 h which is 6 times shorter than the maximum duration.
The maximum peak intensity at Jema is 180 mm h−1which is equivalent to 12 bucket tips per minute. In terms of median, the peak intensity is 36 mm h−1which is equivalent
10
to 3 bucket tips per minute. The median of the peak intensity is 6 times the median of the mean event intensity indicating large differences which is partly explained by the presence of several rainless periods in a single rain event that results in low mean event intensity.
Mean event intensities range between 0.93 mm h−1and 54.67 mm h−1with a median
15
of 6.18 mm h−1. The median of the IET is 27 times the specified MIT which is 30 min. Such shows that changing the MIT value, for instance, to 1 h will not largely change the statistics of the estimated event properties. In terms of median, the IET at Jema is about 13.42 h that is about 13 times the median of the rain event duration indicating longer dry periods than event duration. The median value of the IET also shows that
20
the daily rainfall depths at Jema are mostly caused by one or two rain events. It is noted that the presence of multiple events in a day restricts the applicability of daily rainfall records for event based analysis. As such, the rainfall needs to be recorded at sub-daily time scales for such analysis.
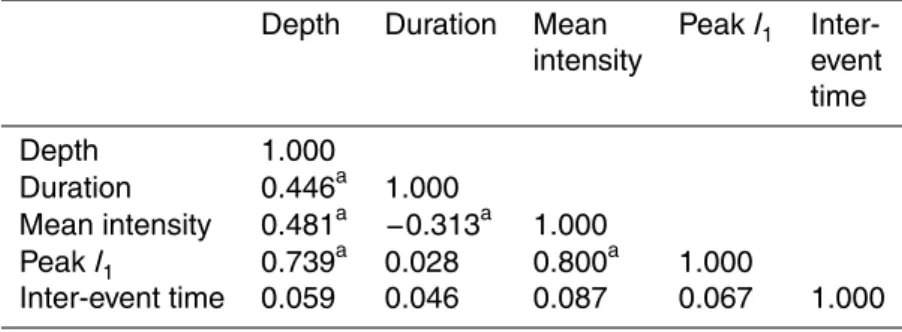
4.2 Relation between rain event properties 25
HESSD
7, 5805–5849, 2010Rain event properties and dimensionless
rain event hyetographs
A. T. Haile et al.
Title Page
Abstract Introduction
Conclusions References
Tables Figures
◭ ◮
◭ ◮
Back Close
Full Screen / Esc
Printer-friendly Version Interactive Discussion
Discussion
P
a
per
|
Dis
cussion
P
a
per
|
Discussion
P
a
per
|
Discussio
n
P
a
per
|
the rain events is positively correlated to all of the remaining event properties. Overall, event depth increases with an increase in event duration or mean event intensity. Event depth has the strongest relation with peak intensity which reveals that event depth at Jema is more related to peak intensity than event duration.
Although the relation is not strong, rain event duration is negatively correlated to
5
mean event intensity and therefore events with short duration have relatively high mean event intensity. Such can be partly caused by high rainfall intermittency that is due to the presence of several rainless periods in a single event as the event duration increases which consequently results in relatively low mean event intensities. The correlation value also shows that events with high peak intensity also have high mean
10
event intensity. Overall, high event intensity at Jema is more related to peak intensity than to event duration. The IET at Jema has shown a weak relation with all of the other rain event properties.
4.3 Temporal variation of rain event properties
To evaluate the intra-season variability of rain event properties, the rain event properties
15
at Jema have been analysed for each of the three months of the wet seasons of 2007 and 2008. Table 3 shows the median of the rain event properties for each of the three months during the wet season. It is noted that June is at the beginning of the wet season while August is towards the end of the wet season. In terms of the median of the rain event depth, there are some differences between the events in June, July and
20
August. June has the highest rain event depth while July has the lowest event depth with a 2 mm difference between the median of the event depth of the two months.
In terms of the median value, the rain events in July have the shortest duration while the events in June have the longest duration with a 10.5 min difference between the median of the event durations in the two months. In terms of peak intensity, the events
25
HESSD
7, 5805–5849, 2010Rain event properties and dimensionless
rain event hyetographs
A. T. Haile et al.
Title Page
Abstract Introduction
Conclusions References
Tables Figures
◭ ◮
◭ ◮
Back Close
Full Screen / Esc
Printer-friendly Version Interactive Discussion
Discussion
P
a
per
|
Dis
cussion
P
a
per
|
Discussion
P
a
per
|
Discussio
n
P
a
per
|
be clustered while the June rain events have the longest IET. There is a 6.3 h difference between the median values of the IETs of the events of June and July.
Overall, the event properties at the start and towards the end of the wet season have somewhat similar characteristics while the events in the mid-season differ in this respect. At the start and towards the end of the wet season, the rain event depth is
5
large with long event duration and long IET as compared to events in the mid-season. The coefficient of variation (CV) in Table 3 indicate that the rain event depth in July is more variable as compared to that of the other months. Also, there is some difference in terms of the variability of the rain event duration in each of the months. The event duration in June is less variable than for the other months of the wet season.
10
Table 3 also shows that the peak intensity of the events in August has the smallest variability while the difference in CV of mean event intensity in the three months is less than 10%. In terms of IET, the largest variability has been observed in August. Overall, the mid-season events have depth, duration and peak intensity that are more variable than for events at the start and end of the wet season.
15
4.4 Spatial variation of rain event properties
In this section, the spatial variation of rain event properties is analysed based on rainfall records from 8 stations. The number of rain events is 122, 100, 140, 112, 177, 122, 105, and 153 for Addis Kidam, Bahir Dar, Dangila, Durbet, Injibara, Jema, Koga and Sekela, respectively. The largest number of events is observed at Sekela station that
20
is located on a mountain area while the smallest number of events is observed at Bahir Dar which is at the south shore of Lake Tana. Haile et al. (2010) showed that considering the rainfall of the Sekela station is largely important for runoffmodelling of the Gilgel Abbay watershed. The result in the present study suggests that one of the reasons for the importance of the station could be due to the relatively large number of
25
HESSD
7, 5805–5849, 2010Rain event properties and dimensionless
rain event hyetographs
A. T. Haile et al.
Title Page
Abstract Introduction
Conclusions References
Tables Figures
◭ ◮
◭ ◮
Back Close
Full Screen / Esc
Printer-friendly Version Interactive Discussion
Discussion
P
a
per
|
Dis
cussion
P
a
per
|
Discussion
P
a
per
|
Discussio
n
P
a
per
|
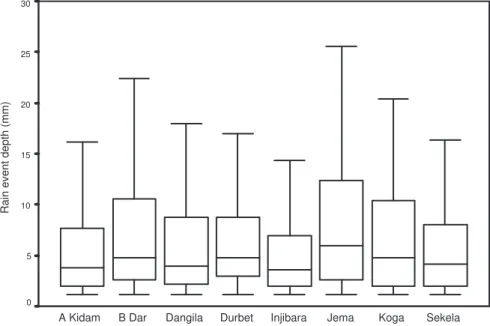
4.4.1 Rain event depth
Statistical properties of the rain event depths of the eight stations are presented in Fig. 2. The top and the bottom horizontal bars represent the 25% quartile minus 1.5IQR and the 75% quartile plus 1.5IQR, respectively. IQR is defined as the interquartile range which is the 75% quartile minus the 25% quartile and is as such defined by the
5
size of the box. The 25% and the 75% quartiles are shown by the bottom edge and the top edge of the box, respectively while the median is shown by the line inside the box.
By the box plot in Fig. 2 some suggestions can be made with respect to the rain event depth in the basin. Overall, the rain event depths have skewed distribution where event depths higher than the median are distributed over a larger range than the event depths
10
that are lower than the median. In terms of median, Addis Kidam, Dangila, Injibara and Sekela stations which are on the mountain areas have events with lowest rainfall depths as compared to the stations on the lowland areas. In terms of median, the lowest event depth is 3.6 mm at Injibara which is located on a mountain area while the highest depth is 6.0 mm at Jema which is situated at an intermediate location between the mountain
15
areas and the lowland areas near Lake Tana. On average, Jema receives an event depth of 1.67 times that of Injibara indicating significant spatial variation of event depth in the study area. Bahir Dar which is on the south shore of the lake has a median value of 4.8 mm event depth.
The stations that are relatively close to the lake which are Bahir Dar, Koga and Jema
20
station have lowest terrain elevation and have a larger IQR that shows these stations have event depths which have larger variability than for the stations near the mountain areas. Such implies that the variability of event depth decreases by the combined effect of an increase in distance from the lake and an increase in terrain elevation.
The box plot also shows that the 75% quartiles of the event depths of the stations
25
HESSD
7, 5805–5849, 2010Rain event properties and dimensionless
rain event hyetographs
A. T. Haile et al.
Title Page
Abstract Introduction
Conclusions References
Tables Figures
◭ ◮
◭ ◮
Back Close
Full Screen / Esc
Printer-friendly Version Interactive Discussion
Discussion
P
a
per
|
Dis
cussion
P
a
per
|
Discussion
P
a
per
|
Discussio
n
P
a
per
|
4.4.2 Rain event duration
Figure 3 shows a box plot of the rain event duration at the eight stations. Similar to the rain event depth, some suggestions can be made regarding the spatial variation of rain event duration. Overall, the distribution of the event duration is skewed since events that have longer durations than the median are distributed over a larger range
5
than event durations that are shorter than the median. However, this skewness is less pronounced compared to the skewed distribution of the rain event depth. As such, the mean event duration is less affected by extreme values as compared to the event depth in the study area.
In terms of median, Addis Kidam, Dangila, Injibara and Sekela stations which are
10
higher in the mountain areas have events with longest duration as compared to events of the remaining stations that are in the lowland. An exception is Jema which has relatively low elevation but on average has event duration which is comparable to that of the events on the mountain areas. Koga and Bahir Dar stations which are relatively close to the lake have events with shortest duration on average.
15
Durbet, Jema and Sekela have a larger IQR of event duration than the remaining stations and thus event duration of these stations is relatively more variable. Although the median of the event duration at Sekela and Injibara are comparable, the IQR does not show that the event duration is equally variable at these stations. The rain event duration at Sekela is more variable as compared to the event duration at Injibara.
20
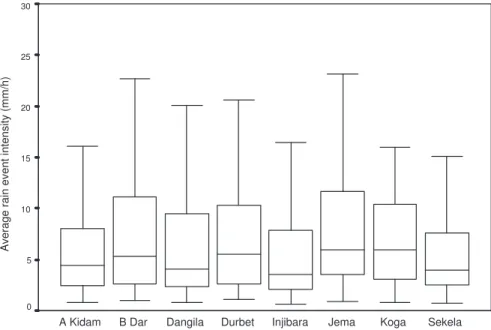
4.4.3 Mean event intensity
A box plot of the mean event intensities at the eight stations is presented in Fig. 4. Similar to the rain event depth, the distribution of the mean event intensity is skewed. In terms of median, Addis Kidam, Dangila, Injibara and Sekela station which are all located on mountain areas have events with lower intensity than the stations that are
25
HESSD
7, 5805–5849, 2010Rain event properties and dimensionless
rain event hyetographs
A. T. Haile et al.
Title Page
Abstract Introduction
Conclusions References
Tables Figures
◭ ◮
◭ ◮
Back Close
Full Screen / Esc
Printer-friendly Version Interactive Discussion
Discussion
P
a
per
|
Dis
cussion
P
a
per
|
Discussion
P
a
per
|
Discussio
n
P
a
per
|
Koga that are relatively close to Bahir Dar which has a median value of 5.5 mm h−1. As such, on average the maximum intensity in the study area (i.e. at Jema) is 1.7 times that of the minimum intensity. Bahir Dar, Koga and Jema which are relatively close to the lake and at low elevation in the basin have a larger IQR than the stations near the mountain areas indicating that the event intensity at the lowland areas is more variable.
5
The 75% quartiles of the rain event intensities at the stations which are near the lake are higher than that of the intensities on the mountain areas. Injibara station which is located on the mountain area has lowest 25% quartile of event intensities from the network. Over all, the event intensities in the study area have similar spatial pattern to that of the rain event depths suggesting some relation between the two event
10
properties.
4.4.4 Inter-event time
Figure 5 shows the cumulative distribution of the inter-event time at three stations. The cumulative distribution shows the 10% quantile inter-event time is 1.4 h, 1.5 h and 1.0 h at Sekela, Jema and Bahir Dar, respectively. The median inter-event time is 9.0 h,
15
13.5 h and 16.5 h at Sekela, Jema and Bahir Dar, respectively. The 90% quantile inter-event time is 29.5 h, 31 h and 42.5 h at Sekela, Jema and Bahir Dar, respectively.
At a selected cumulative probability, Sekela has the shortest IET while Bahir Dar has the longest IET. The cumulative distribution reveals that, on average, the lowland areas have a dry period length of 1.8 times that of the mountain areas. Jema which is
20
situated at an intermediate distance between the mountain areas and the lake has an IET which is shorter than at Bahir Dar but longer than at Sekela.
4.4.5 Relation between elevation and event properties
In the previous sub-sections, it is shown that event properties of the study area have some relation with terrain elevation. Therefore, a regression analysis is performed to
25
HESSD
7, 5805–5849, 2010Rain event properties and dimensionless
rain event hyetographs
A. T. Haile et al.
Title Page
Abstract Introduction
Conclusions References
Tables Figures
◭ ◮
◭ ◮
Back Close
Full Screen / Esc
Printer-friendly Version Interactive Discussion
Discussion
P
a
per
|
Dis
cussion
P
a
per
|
Discussion
P
a
per
|
Discussio
n
P
a
per
|
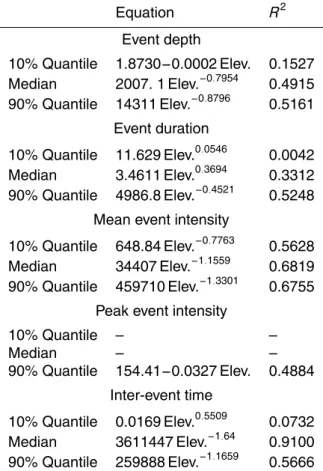
event properties and terrain elevation. In the present study, a non-linear regression is found to be suitable since it showed a small improvement in the coefficient of determi-nation (R2) value as compared to a linear regression.
The regression equations that relate event properties to terrain elevation are pre-sented Table 4. The 10%, 50% and 90% quantiles are selected to consider low,
nor-5
mal and high event properties, respectively. TheR2value in Table 4 shows that terrain elevation weakly explains the variation in the 10% quantile event depth. However, the 50% and the 90% quantiles of event depth are strongly related to terrain elevation. The results suggest that normal and large event depths in the study area are largely affected by orography. In terms of event duration, the 10% quantile is weakly related to
10
terrain elevation while the 90% quantile is more strongly related to terrain elevation as compared to the relation between other quantiles and terrain elevation. The spatial dis-tribution of long event duration is affected by orography but that of short event duration is not affected by orography.
The R2 value indicates that the variations in the three quantiles of mean event
in-15
tensity are largely related to the variation in terrain elevation. The lowland areas in the study area receive rainfall with high intensity as compared to the mountain areas. However, in terms of peak event intensity, a relation could not be established between the 10% and the 50% quantiles with terrain elevation since quantiles of peak intensity are found to be equal at all stations. However, the 90% peak intensity is related to
20
terrain elevation and the slope of the regression equation shows that the events in the lowland areas have high peak intensities. Although the 10% quantile of IET is weakly related to terrain elevation, the 50% and the 90% quantiles of IET have strong relation to terrain elevation. Overall, the high quantiles of event properties are largely affected by orography while low quantiles of event properties except that of event intensity are
25
weakly affected by orography.
HESSD
7, 5805–5849, 2010Rain event properties and dimensionless
rain event hyetographs
A. T. Haile et al.
Title Page
Abstract Introduction
Conclusions References
Tables Figures
◭ ◮
◭ ◮
Back Close
Full Screen / Esc
Printer-friendly Version Interactive Discussion
Discussion
P
a
per
|
Dis
cussion
P
a
per
|
Discussion
P
a
per
|
Discussio
n
P
a
per
|
intensity and IET decrease with an increase in terrain elevation while event duration increases with an increase in terrain elevation. As such, the mountain areas receive rainfall of relatively small depth, low intensity, long duration and short IET. Haile et al. (2009, 2010) showed that the mountain areas of the Lake Tana basin receive rel-atively large seasonal rainfall depth. The result of the present study showed that the
5
large seasonal rainfall of the mountain areas is mainly due to frequent and long dura-tion events. However, the seasonal rainfall of the lowland areas is largely affected by events with high intensity but short duration.
4.5 Dimensionless event hyetographs
The observed dimensionless hyetographs of Bahir Dar at the south shore of Lake Tana
10
and that of Sekela on a mountain area; see Fig. 7. Some differences are observed between the hyetographs of the two stations. In terms of the 10%, 50% and 90% quan-tiles, Bahir Dar has higher fractions of event depths than Sekela for all ranges of frac-tions of event duration. This shows that Bahir Dar receives larger rainfall depth for sin-gle events than Sekela. The largest difference between the dimensionless hyetographs
15
of the two stations is observed for the 10% quantile.
The difference in the dimensionless hyetographs of Bahir Dar, Jema and Sekela is also statistically evaluated using the Kolmogorov-Smirnov test, see Eqs. (4–5). Table 5 shows the observed test statistic (D) which is here defined as the maximum difference in the fractions of event depths of two stations, see Eqs. (4–5). The critical value of the
20
test statistic for the Kolmogorov-Smirnov goodness of fit test for an arbitrary selected significance level of 0.05% and number of incrementsn=10, (i.e. D0.05,10) is 0.4092. The observedDas shown in Table 5 is less than the critical value in all cases indicating there is no statistically significant difference between the dimensionless hyetographs of any of the two selected stations. However, the outcome of the test depends on
25
HESSD
7, 5805–5849, 2010Rain event properties and dimensionless
rain event hyetographs
A. T. Haile et al.
Title Page
Abstract Introduction
Conclusions References
Tables Figures
◭ ◮
◭ ◮
Back Close
Full Screen / Esc
Printer-friendly Version Interactive Discussion
Discussion
P
a
per
|
Dis
cussion
P
a
per
|
Discussion
P
a
per
|
Discussio
n
P
a
per
|
respectively and therefore applyingn=160 is equivalent to using an increment that is much smaller than 0.5 min.
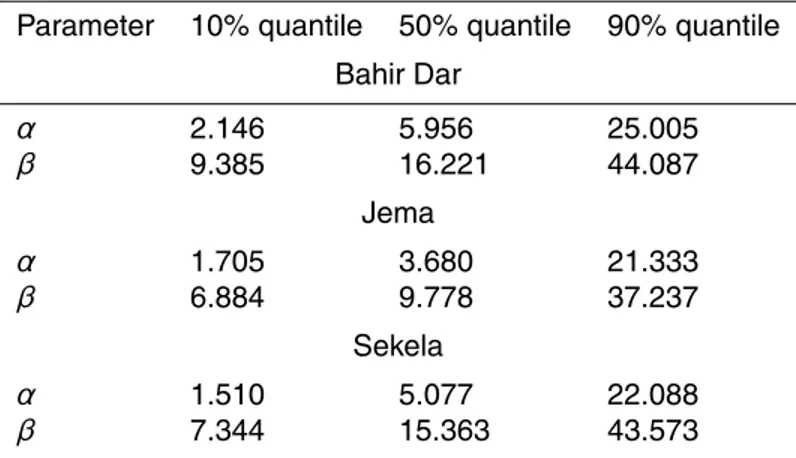
Figures 8–10 show the observed and simulated dimensionless hyetographs of the rain events at Bahir Dar, Jema and Sekela stations, respectively. The hyetographs are simulated based on the beta probability distribution model in Eq. (8). Overall the beta
5
model satisfactorily reproduced the shape of the dimensionless hyetographs; Fig. 8. For the 10% quantile, the model overestimated the fraction of event depth at the middle fractions of event duration but satisfactorily reproduced the depth towards the end of the fractions of event duration. This suggests that the model developed in this study has difficulties to reproduce low rainfall intensities of Bahir Dar.
10
The model satisfactory reproduced the 50% quantile hyetograph over all fractions of event duration showing that normal rainfall intensities could be reproduced using the model. However, the model underestimated the fractions of event depth at all fractions of event duration for the 90% quantile but the difference is too small as compared to that of the 10% quantile.
15
Figure 9 shows that the beta model largely overestimates the fractions of the 10% quantile event depth at Jema but relatively small difference are observed for the 50% and the 90% quantiles. The model reproduced the 10% quantile hyetograph of Sekela better than that of Jema; see Fig. 10. At the start and middle fractions of event depth, the modelled hyetograph of Sekela deviates from the observed hyetograph but the
20
modelled and simulated hyetographs show very good agreement at large fractions of event duration. For low intensities, the dimensionless hyetograph of Sekela follows the beta cumulative distribution more than that of Jema. The simulated and the observed 10% quantile hyetographs show a better agreement at Sekela than that at Jema station. The beta model shows some bias in simulating small and large dimensionless event
25
depths. Small event depths are consistently overestimated while large event depths are underestimated at the selected stations.
HESSD
7, 5805–5849, 2010Rain event properties and dimensionless
rain event hyetographs
A. T. Haile et al.
Title Page
Abstract Introduction
Conclusions References
Tables Figures
◭ ◮
◭ ◮
Back Close
Full Screen / Esc
Printer-friendly Version Interactive Discussion
Discussion
P
a
per
|
Dis
cussion
P
a
per
|
Discussion
P
a
per
|
Discussio
n
P
a
per
|
D which indicates the maximum difference between the simulated and the observed hyetographs is shown in Table 6 and is less than the critical value in all cases. The result shows that there is no statistically significant difference between the modeled and the observed hyetographs of the three stations. The largest deviation between the simulated and the observed hyetographs is observed for the 10% quantile at Jema
5
station.
The parameter values for the beta model are shown in Table 7. Both parameter values increase with an increase in terrain elevation.
4.6 Conditional probability of rainfall occurrences
Figure 11 shows the plot of the conditional probability (Pi j) of rainfall occurrences
10
(Eq. 9) against station distance. The conditional probability at a selected inter-station distance increased when the rainfall aggregation time changed from 1 h to 6 h. MaximumPi j values of 0.35 and 0.55 occurred at the smallest inter-station distance are estimated for the 1 h and the 6 h rainfall, respectively.
It is shown that the conditional probability decreases exponentially with an increase
15
in inter-station distance for both aggregation times. As such an exponential model of the following form is fitted to the data points using least square fitting:
Pi j=a·exp(−b·d) (10)
where Pi j is the conditional probability of rainfall occurrences which indicates that it rains at stationj when it also rains at stationi,aandb are empirical fitting constants
20
and d is the inter-station (separation) distance between two selected stations. The exponential model is fitted with an R2 value of 0.86 and 0.63 for the 1 h and the 6 h rainfall, respectively. The values of the constants for the 1 h rainfall are a=0.4057 andb=0.0231 while the values of the constants for the 6 h rainfall are a=0.5927 and b=0.0103. Although it is not shown in Fig. 11, the conditional probability of daily rainfall
25
HESSD
7, 5805–5849, 2010Rain event properties and dimensionless
rain event hyetographs
A. T. Haile et al.
Title Page
Abstract Introduction
Conclusions References
Tables Figures
◭ ◮
◭ ◮
Back Close
Full Screen / Esc
Printer-friendly Version Interactive Discussion
Discussion
P
a
per
|
Dis
cussion
P
a
per
|
Discussion
P
a
per
|
Discussio
n
P
a
per
|
inter-station distance and daily rainfall occurrence.
5 Discussion and conclusion
Studies show that changes in event properties affect the response of hydrologic models (e.g. Kusumastuti et al., 2007) while a lack of information on event properties restricts the applicability of hydrologic models (e.g. Renard and Freimun, 1994; Diodato and
5
Bellocchi, 2007). For locations without sub-daily rainfall records, generation of syn-thetic rainfall data is required to allow application of hydrologic models at high temporal resolutions. Generation of synthetic rainfall time series requires knowledge on the spa-tial and temporal patterns of rain event properties at least on a short-term base. Few studies address the spatial pattern of rain event properties (e.g. Bidin and Chappel,
10
2006; Dairaku et al., 2004). The objective in the present study is to understand the rain event properties in the source basin of the Upper Blue Nile River and to evaluate the relation between rain event properties and orography of the basin.
The temporal characteristics of rain event properties have been analyzed to evaluate whether event properties change with time. Also, relations between the various rain
15
event properties are evaluated to enhance our understanding of rainfall and provide information that may be useful for generation of synthetic rainfall data. The considered event properties are rain event depth, duration, mean intensity, peak intensity and inter-event time (IET).
The relation between rain event properties is evaluated through correlation analysis
20
which showed that some relation exists between the rain event properties. Overall, rain event depth increases with an increase in event duration, mean event intensity, and peak intensity. In terms of correlation, the rain event depth in the study area is more related to peak intensity than to event duration. As such, large event depth in the study area is caused not only by events of relatively long duration but also by high
25
HESSD
7, 5805–5849, 2010Rain event properties and dimensionless
rain event hyetographs
A. T. Haile et al.
Title Page
Abstract Introduction
Conclusions References
Tables Figures
◭ ◮
◭ ◮
Back Close
Full Screen / Esc
Printer-friendly Version Interactive Discussion
Discussion
P
a
per
|
Dis
cussion
P
a
per
|
Discussion
P
a
per
|
Discussio
n
P
a
per
|
The results also show that at the start and towards the end of the wet season, the rain event depth is relatively large with long event duration and long IET. Such indicates that two consecutive events as observed in the early and the late season are separated by longer dry periods than the events in the mid-season. In terms of median, the June events have event depth that is 2 mm higher and event duration that is 10.5 min longer
5
than the July events. The IET in June is 6.3 h longer than that in July. Also, mid-season events have depth, duration and peak intensity that are more variable as compared to the events at the start and at the end of the wet season. Such differences may affect hydrologic processes. Long IET may result in large evapotranspiration between two consecutive rain events and therefore decreases the effective rainfall which is available
10
for runoff.
Haile et al. (2009) showed that there is a weak relation between seasonal rainfall and terrain elevation or distance to the lake but the diurnal cycle of rainfall in the study area is strongly affected by orography. The results of the present study revealed that terrain elevation of the Lake Tana basin affects rain event properties in particular for
15
higher quantiles. The interquartile range shows that the variability of event depth and mean event intensity decreases with an increase in distance from the lake and with an increase in terrain elevation. As such, the low land areas event depths and intensities with larger variability as compared to events in the mountain areas of the basin.
The coefficient of determination (R2) value indicates that terrain elevation weakly
20
relates to the 10% quantile event depth, event duration, peak intensity, and IET. This suggests that events with small values of properties such as small rainfall depth are not affected by terrain elevation. In terms of the median values, the maximum spatial difference in the watershed is 2.4 mm, 2.5 mm h−1, 15.5 min and 7.85 hour for event depth, mean event intensity, event duration, IET, respectively. Also, the median of the
25
HESSD
7, 5805–5849, 2010Rain event properties and dimensionless
rain event hyetographs
A. T. Haile et al.
Title Page
Abstract Introduction
Conclusions References
Tables Figures
◭ ◮
◭ ◮
Back Close
Full Screen / Esc
Printer-friendly Version Interactive Discussion
Discussion
P
a
per
|
Dis
cussion
P
a
per
|
Discussion
P
a
per
|
Discussio
n
P
a
per
|
Rainfall amount is expected to increase with an increase in terrain elevation due to orographic effects. Although some studies evaluated the effect of orography on annual, seasonal or daily rainfall, there are few studies in literature that evaluate the relation between orography and rainfall at the scale of rain events. In the present study such relation is evaluated for the rain events of the Lake Tana basin. The results
5
revealed that (i) the low land areas have events with relatively larger variable of depth and intensity as compared to events in the mountain areas, (ii) on average, the low land areas receive rain events of larger depth, higher intensity, shorter duration and longer IET than the mountain areas; (iii) relatively high quantiles of event properties, such as large event depth, are affected by terrain elevation; (iv) relatively low quantiles of event
10
properties, such as small event depth, except mean event intensity are weakly related to terrain elevation; (v) both low and high event intensity are strongly related to terrain elevation with low lands.
The results are similar to that by Barros et al. (2000) who, using 4 month data in Nepal, showed that the lower-elevation stations received higher intensity rainfall over
15
short durations. However, the results are somewhat in contrast to that of Dairaku et al. (2004) who showed that relatively low intensity events in the mountains of North-western Thailand are weakly affected by terrain elevation. Such difference can be caused not only by climatic factors but also due to the presence of Lake Tana in the present study area that affect rain event properties.
20
A dimensionless rain event hyetograph serves to generate rainfall intensity for data scarce areas. A dimensionless rain event hyetograph is developed for the Gilgel Abbay watershed which is situated in the study area. The 10%, 50% and 90% quantiles of fractions of rain event depth at the corresponding fractions of event duration are used to develop the dimensionless event hyetographs. For the same event duration, the areas
25
HESSD
7, 5805–5849, 2010Rain event properties and dimensionless
rain event hyetographs
A. T. Haile et al.
Title Page
Abstract Introduction
Conclusions References
Tables Figures
◭ ◮
◭ ◮
Back Close
Full Screen / Esc
Printer-friendly Version Interactive Discussion
Discussion
P
a
per
|
Dis
cussion
P
a
per
|
Discussion
P
a
per
|
Discussio
n
P
a
per
|
The beta probability distribution model is fitted to the observed dimensionless hyetographs. The model consistently underestimated large dimensionless depths while it overestimated small dimensionless depths of selected stations. However, the Kolmogorov-Smirnov test showed that the deviation between the modelled and the observed hyetograph is not significant. This shows that the model satisfactorily
re-5
produced the shape of the observed dimensionless hyetographs in particular normal dimensionless depths of the selected stations. As pointed out by Garcia-Guzman and Aranda-Oliver (1993), the beta model is simple to implement since it requires estima-tion of only two parameters. The model can be used to generate synthetic rainfall data, for instance, for runoffand soil erosion studies in the absence of rainfall observations
10
at the required resolution.
Haile et al. (2009) evaluated the temporal intermittence of the hourly rainfall of the Lake Tana basin using fractal analysis and found that rainfall occurs at least once in 2.7 days and that rainfall of the mountain stations is closely clustered. In the present study, the spatial intermittence of the hourly rainfall is evaluated. The conditional probability
15
of rainfall occurrences at any two stations is evaluated and an exponential model is fitted to relate such probability to inter-station distance. The conditional probability of 1 h and 6 h rainfall occurrences is approximately 0.35 and 0.55, respectively for inter-station distances of 10 km. Such small probability of occurrences at scales smaller than 10 km shows the high variability of the rainfall in the basin. The increase in the
20
conditional probability with an increase in the aggregation time of the rainfall data can be caused by: (i) the presence of rain events with a duration that is longer than 1 h; (ii) the movement of rain producing clouds at a speed that is lower than the inter-station distance per hour, or (iii) the occurrence of multiple rain events in the 6 h or 1 day time period.
25
prob-HESSD
7, 5805–5849, 2010Rain event properties and dimensionless
rain event hyetographs
A. T. Haile et al.
Title Page
Abstract Introduction
Conclusions References
Tables Figures
◭ ◮
◭ ◮
Back Close
Full Screen / Esc
Printer-friendly Version Interactive Discussion
Discussion
P
a
per
|
Dis
cussion
P
a
per
|
Discussion
P
a
per
|
Discussio
n
P
a
per
|
abilities only vary over a very small range that does not show relation with inter-station distance and as such a trend could not be established.
Haile et al. (2010) have shown that the accuracy of the simulated stream flows of the Gilgel Abbay watershed in Lake Tana basin depends on whether a low land or a moun-tain rain gauge is considered. In the same work, a relative error between observed and
5
simulated stream flow of up to 100% is reported when rainfall data from a single station served as model input. Such indicates large variability in the rainfall over the study area that largely affects the accuracy of runoffsimulations. In particular the rainfall of Sekela and Jema is very important and should be considered for runoffmodelling. The present study showed that Jema has high intensity events while Sekela has the largest
10
number of events with relatively short IET. Also, the two stations have longest event duration as compared to the stations in the low land areas.
Based on these results we speculate that the rain events of mountain areas have less soil erosive power than the rain events in the low lands. We recommend that future studies should evaluate the effect of soil erosion in the watershed since severe
15
erosion has been observed in the watershed during the field visit of this study.
References
Angel, J. R., Palecki, M. A., and Hollinger, S. E.: Storm Precipitation in the United States. Part II: soil erosion characteristics, J. Appl. Meteorol., 44, 947–959, 2005.
Arnaud, P., Fine, J. A., and Lavabre, J.: An hourly rainfall generation model applicable to all
20
types of climate, Atmos. Res., 85, 230–242, 2007.
Barros, A. P., Joshi, M., Putkonen, J., and Burbank, D. W.: A study of the 1999 monsoon rainfall in a mountainous region in central Nepal using TRMM products and rain gauge observations. Geophys. Res. Lett., 27, 3683–3686, 2000.
Bidin, K. and Chappell, N. A.: Characteristics of rain events at an inland locality in northeastern
25
Borneo, Malaysia, Hydrol. Process., 20, 3835–3850, 2006.
HESSD
7, 5805–5849, 2010Rain event properties and dimensionless
rain event hyetographs
A. T. Haile et al.
Title Page
Abstract Introduction
Conclusions References
Tables Figures
◭ ◮
◭ ◮
Back Close
Full Screen / Esc
Printer-friendly Version Interactive Discussion
Discussion
P
a
per
|
Dis
cussion
P
a
per
|
Discussion
P
a
per
|
Discussio
n
P
a
per
|
Dairaku, K., Emori, S., and Oki, T.: Rainfall amount, intensity, duration and frequency rela-tionships in the Mae Chaem watershed in Southeast Asia, J. Hydrometeorol., 5, 458–470, 2004.
Diodato, N. and Bellocchi, G.: Estimating monthly (R)USLE climate input in a Mediterranean region using limited data, J. Hydrol., 345, 224–236, 2007.
5
Dunkerley, D.: Rain event properties in nature and in rainfall simulation experiments: a compar-ative review with recommendations for increasingly systematic study and reporting, Hydrol. Process., 22, 4415–4435, 2008a.
Dunkerley, D.: Identifying individual rain events from pluviograph records: a review with analysis of data from an Australian dryland site, Hydrol. Process., 22, 5024–5036, 2008b.
10
Garcia-Guzman, A. and Aranda-Oliver, E.: A Stochastic Model of Dimensionless Hyetograph, Water Resour. Res., 29, 2363–2370, 1993.
Gebremichael, M., Vivoni, E. R., Watts, C. J., and Rodr´ıgueze J. C.: Submesoscale spatiotem-poral variability of North American monsoon rainfall over complex terrain, J. Clim., 20, 1751– 1773, 2007.
15
Haile, A. T., Rientjes, T., Gieske, M., and Gebremichael, M.: Rainfall Variability over mountain-ous and adjacent lake areas: the case of Lake Tana basin at the source of the Blue Nile River, J. Appl. Meteorol. Clim., 488, 1696–1717, 2009.
Haile, A. T., Rientjes, T., and Reggiani, P.: Model sensitivity to rainfall representation: the representative elementary watershed model, J. Hydrol., under review, 2010.
20
Huff, F. A.: Time distribution of rainfall in heavy storms, Water Resour. Res., 3, 1007–1019, 1967.
Koutsoyiannis, D. and Onof C.: Rainfall disaggregation using adjusting procedures on a poisson cluster model, J. Hydrol., 246, 109–122, 2001.
Kusumastuti, D. I., Struthers, I., Sivapalan, M., and Reynolds, D. A.: Threshold effects in
catch-25
ment storm response and the occurrence and magnitude of flood events: implications for flood frequency, Hydrol. Earth Syst. Sci., 11, 1515–1528, doi:10.5194/hess-11-1515-2007, 2007.
Loukas, A. and Quick, M. C.: Spatial and temporal distribuition of storm precipitation in south-western British Columbia, J. Hydrol., 174, 37–56, 1996.
30
Menabde, M. and Sivapalan, M.: Linking space-time variability of runoffand rainfall fields: a dynamic approach, Adv. Water Resour., 24, 1001–1014, 2001.
HESSD
7, 5805–5849, 2010Rain event properties and dimensionless
rain event hyetographs
A. T. Haile et al.
Title Page
Abstract Introduction
Conclusions References
Tables Figures
◭ ◮
◭ ◮
Back Close
Full Screen / Esc
Printer-friendly Version Interactive Discussion
Discussion
P
a
per
|
Dis
cussion
P
a
per
|
Discussion
P
a
per
|
Discussio
n
P
a
per
|
Res., 24, 620–624, 1987.
Palecki, M. A., Angel, J. R., and Hollinger S. E.: Storm Precipitation in the United States. Part I: Meteorological characteristics, J. Appl. Meteorol., 44, 933–946, 2005.
Renard, K. G. and Freimund, J. R.: Using monthly precipitation data to estimate the R factor in the revised USLE, J. Hydrol., 157, 287–306, 1994.
5
Robinson, J. S. and Sivapalan, M.: An investigation into the physical causes of scaling and heterogeneity of regional flood frequency, Water Resour. Res., 33, 1045–1049, 1997. Robinson, P. J.: Precipitation regime changes over small watersheds. In Statistics for the
envi-ronment 2 Water related Issues, edited by: Barnett, V. and Turkman, K. F., John Wiley&Sons, New York, USA, 43–59, 1994.
10
Tsubo, M., Walker, S., and Hensley, M.: Quantifying risk for water harvesting under semi-arid conditions, Part I, Rainfall intensity generation, Agr. Water Manage., 76, 77–93, 2005. van Dijk, A. I. J. M., Meesters, A. G. C. A., Schellekens, J., and Bruijnzeel, L. A.: A
two-parameter exponential rainfall depth-intensity distribution applied to runoffand erosion mod-eling, J. Hydrol., 300, 155–171, 2005.
15
Woolhiser, D. A. and Osborn, H. B.: A stochastic model of dimensionless thunderstorm rainfall, Water Resour. Res., 21, 511–522, 1985.
Zar, J. H.: Biostatistical Analysis, 3rd edn., Upper Saddle River, NJ: Prentice Hall, 471–479, 2000.
Zeng, N., Shuttleworth, J. W., and Gash, J. H. C.: Influence of temporal variability of rainfall on
20
HESSD
7, 5805–5849, 2010Rain event properties and dimensionless
rain event hyetographs
A. T. Haile et al.
Title Page
Abstract Introduction
Conclusions References
Tables Figures
◭ ◮
◭ ◮
Back Close
Full Screen / Esc
Printer-friendly Version Interactive Discussion
Discussion
P
a
per
|
Dis
cussion
P
a
per
|
Discussion
P
a
per
|
Discussio
n
P
a
per
|
Table 1.The Lake Tana basin area and the location of the rain gauge stations.
Statistics Depth Duration Peak intensity Event intensity Inter-event
(mm) (min) (mm h−1) (mm h−1) time (h)
Minimum 1.20 3.00 12.00 0.93 0.52
Maximum 67.6 344.00 180.00 54.67 94.62
Mean 9.11 76.55 42.56 10.01 17.12
Median 5.60 60.00 36.00 6.18 13.42
HESSD
7, 5805–5849, 2010Rain event properties and dimensionless
rain event hyetographs
A. T. Haile et al.
Title Page
Abstract Introduction
Conclusions References
Tables Figures
◭ ◮
◭ ◮
Back Close
Full Screen / Esc
Printer-friendly Version Interactive Discussion
Discussion
P
a
per
|
Dis
cussion
P
a
per
|
Discussion
P
a
per
|
Discussio
n
P
a
per
|
Table 2. Box plot of the rain event depths in JJA of 2007 as observed at eight rain gauge stations. The lower and the upper bars indicate the 25% quartile minus 1.5 IQR and the 75% quartile plus 1.5 IQR, respectively. IQR refers to the interquartile range which is defined by the height of the box. The bar inside the boxes shows the median while the upper and lower edges of the boxes show the 75% and the 25% quartiles.
Depth Duration Mean PeakI1
Inter-intensity event
time
Depth 1.000
Duration 0.446a 1.000
Mean intensity 0.481a −0.313a 1.000
PeakI1 0.739a 0.028 0.800a 1.000
Inter-event time 0.059 0.046 0.087 0.067 1.000