a panel data study of Brazilian states
Luiz Carlos Ribeiro Neduziak
Fundação de Estudos Sociais do Paraná / Departamento de Economia Pontifícia Universidade Católica do Paraná / Departamento de Economia Curitiba / PR — Brazil
Fernando Motta Correia
Universidade Federal do Paraná / Programa de Pós-Graduação em Desenvolvimento Econômico Curitiba / PR — Brazil
he efect of the allocation of government spending on the economy is currently a subject of interest given the iscal budget constraints facing governments due to iscal crises or adjustments. his paper thus seeks to study the efects of the allocation of government spending on the GDP behavior of Brazilian states from 1995 to 2011. Using a conventional FE (Fixed Efect) panel data model, this paper’s main results are as follows: (i) administration and planning, (ii) judicial, (iii) housing and (iv) social assistance spending were found to be productive, while (i) education and culture and (ii) legislative spending were found to be unproductive. In addition, some evidence has been found that the introduction of public borrowing rules by the Fiscal Responsibility Law has been beneicial to the economic growth of Brazilian states.
Keywords: government spending; economic growth; Brazilian states.
Alocação dos gastos públicos e crescimento econômico: um estudo em painel para os estados brasileiros Tendo em vista as restrições orçamentárias impostas aos governos, em contextos de crises e ajustes iscais, faz-se necessária a discussão acerca do efeito da alocação dos gastos públicos sobre o estado da economia. Nesfaz-se sentido, o presente ensaio busca discutir os efeitos da alocação do gasto público sobre o comportamento do PIB real dos estados brasileiros. Para tanto, foi utilizado um painel convencional de Efeitos Fixos (EF), no período de 1995/2011. Os gastos em: (i) administração e planejamento, (ii) judiciário, (iii) habitação e urbanismo e (iv) assistência e previdência mostraram-se produtivos e os gastos em: (i) educação e cultura e (ii) legislativo mostra-ram-se improdutivos. Foram encontradas evidências de que a Lei de Responsabilidade (LRF) tem sido benéica ao crescimento econômico dos estados brasileiros.
Palavras-chave: gasto público;crescimento econômico; estados brasileiros.
La alocación de los gastos públicos y crecimiento económico: un estudio de datos en panel aplicado a los estados de Brasil
El presente trabajo analiza los efectos de la alocación del gasto público sobre el crecimiento económico de los estados de Brasil en el período de 1995-2012. La investigación se realizó mediante el análisis de datos en panel. Los resultados muestran que los gastos con el: (i) ejecutivo, (ii) judicial, (iii) habitación y (iv) bienestar social im-pactaron el crecimiento económico positivamente, mientras que los gastos en: (i) educación y (ii) legislativo no tuvieron impacto productivo sobre el crecimiento económico. Además, la introducción de reglas iscales a través de la “Ley de Responsabilidad Fiscal” ha sido beneiciosa al crecimiento de los estados.
Palabras clave: gastos públicos; crecimiento económico; estados de Brasil.
DOI: http://dx.doi.org/10.1590/0034-7612155177
Article received on October 5, 2015 and accepted on June 27, 2017.
1. INTRODUCTION
Is it possible for the government to promote long-term economic growth by reallocating (or re-shaping) government spending? his question is relevant because states and other federal entities are facing iscal adjustments that oten make it impossible to increase spending beyond a certain limit, which also occurs when the relationship between spending and GDP becomes stagnant or decadent.
Government spending has increased signiicantly over time and is far from being easily under-stood. In terms of the justiication for the presence of the government in the economy and society, it is diicult to determine if more government intervention will, in fact, inluence the GDP of countries, states and municipalities. In the international ield literature, there are many theoret-ical and empirtheoret-ical studies that address the efects of government spending on economic growth. Barro (1990), for example, develops a model in which the government’s presence in the economy produces two efects, one good and one bad, related respectively to the ofering of public goods and the taxing of production.
Some studies point out that in developed countries higher government spending is associated with more modest growth due to the typical impediments of the state bureaucratic structure. How-ever, this argument does not constitute an imperative, given that not all components of government spending will have an equal impact on the rate of economic growth. Many of these studies, in line with Barro (1990), have focused on the relationship between government spending and the long-term rate of growth.
If we analyze this historically, the evolution of the composition of government spending in Brazil has changed greatly over time. he ratio of “educational spending/operating expenses” declined in magnitude from 21% in 1997 to 16% in 2011, while the ratio of “health spending/operating expenses” increased from 8% in 1995 to 13% in 2011. During this time many iscal events afected the Brazilian economy, such as the Fiscal Responsibility Law or LRF, which imposed rules and established budgetary limits to increases in government spending.
In this sense, this study seeks to analyze the efect of the allocation of government spending on the rates of growth of Brazil’s states and capital territory. As an analytical reference we will use the model proposed by Devarajan, Swarrop and Zou (1996). A strong point of this model is that it does
not consider a priori which forms of spending are productive (promote positive efects on GDP) or
unproductive (promote negative efects on GDP), letting the data speak for itself. For our economet-ric analysis we will use a conventional Fixed Efects (FE) panel made up of Brazil’s 26 states and the Federal District from 1995 to 2011.
2. THE ALLOCATION OF GOVERNMENT SPENDING AND ECONOMIC GROWTH
It is interesting to note that the answer to this question is of interest not only to public policy
makers, in terms of the conceptualization of stabilization strategies, but also to decision makers in
the implementation of policy when it is imbued with normative theoretical models that are almost always in conlict. Comparing the Real Business Cycle (RBC), New Classical and Dynamic Stochastic General Equilibrium (DSGE) models ofers a good example of how qualitative forecasts can vary, mainly in relation to the iscal transmission mechanisms involved.
RBC models generally foresee a decline in consumption in response to an increase in govern-ment spending. On the other hand, the Keynesian inspired IS-LM model argues that consumption should increase, thereby further accentuating the efects of increased public expenditure. Naturally, the reason behind this conceptual and empirical diference resides in the way in which consumers react to iscal policy behavior.
In RBC models, with ixed prices, consumption decisions involve time horizons based on in-tertemporal budgetary restrictions; these models suggest that, under the aegis of Ricardian equiva-lence, iscal policy will be ineicient if it intends to stimulate economic activity. On the other hand, according to the IS-LM model, consumers do not make their decisions in a “Ricardian” manner, with consumption being only a function of present liquid earnings. hus, the efect of an increase in government spending depends on the way in which consumers are expected to behave according to one tradition or the other.
New Classical inspired models argue that increasing spending inanced through a lump sum
tax1 will have a negative efect on wealth, leading to: (i) a decrease in private consumption; (ii) an
increase in job openings and a decrease in marginal work productivity and real wages, which will result in lower levels of production and employment. However, the multiplier will be less than one due to the crowding out efect in terms of private consumption. he recent development of DSGE models, which incorporate the micro-fundamentals of market failures, the intertemporal optimization of representative agents and changes in preferences, is of interest due to the results of these models which do not correspond to those of RBC and Keynesian inspired models.
he entire debate concerning iscal policy transmission channels for economic activity permeates the attempt to capture elements that explain this controversy in terms of cyclical responses to iscal policy, which are of interest when we are seeking to reduce economic luctuations. Of great relevance in this debate is the question of how important the allocation of government spending is in terms of economic growth.
2.1 WHAT DOES THE INTERNATIONAL LITERATURE SAY?
According to Feldstein (1980), government deicits do not represent an unequivocal way for iscal policy to afect aggregate demand, because they can inluence private consumption through expecta-tions. hus a permanent increase in government spending or taxes that do not “inance” this spend-ing can result in a contraction of the economic cycle. Consumers react to a iscal change by alterspend-ing their subjective probability distributions in relation to the overall possibilities of future government
taxation and spending. Feldstein’s analysis (1980) leads us to believe that the reaction to a particular change in the conduct of iscal policy will depend on the expectations associated with this change, which may result in the nullifying of its efects.
In this sense, Alesina and Ardagna (1998) investigate the hypothesis of the non-linearity of fiscal policy, meaning the extent to which expansionary or contractionary impacts on discre-tionary policy can affect economic agents. The expansionary effects of fiscal adjustments can be felt through the wealth effect on consumption related to cuts in spending that are viewed as permanent. In this sense, a reduction in taxation will be perceived as a permanent increase in the consumer’s disposable income. In a forward looking context, private demand will increase. In the same way, an increase in taxation can result in expansionary effects. This will occur if consumers perceive this increase in taxation as temporary due to a possible change in the conduct of future fiscal policy in the opposite direction, which will mean lower taxation. The wealth effect may be even more pronounced if this fiscal consolidation occurs during periods of elevated government spending.
Some determinants of the non-linearity of iscal policy are pointed out in the literature such as the composition of government spending and iscal consolidation. It appears to be a stylized fact that the composition of spending is associated with the balancing of public inances. According to Alesina and Perotti (1995, 1996), iscal adjustments based on tax increases, especially direct taxation, are not very efective in controlling an increase in public debt. On the contrary, successful iscal adjustments are achieved through cutting spending, particularly the most rigid components of spending, which include, for example, social security and government wages and employment.
Based on that, it makes sense to ask whether the government is capable of promoting long-term growth by reallocating spending, given that it may confront a large debt that will make iscal adjust-ments necessary to maintain a stable level of debt, thus reducing its supposed anticyclical impact. Policy makers would thus be faced with a trade-of between various expenditures to maintain a given level of economic growth. he origins of this dilemma can be traced back to Barro (1990), whose endogenous model of growth emphasizes the importance of the alignment between public and private capital.
Like every political and academic debate, the question of the impact of reorganizing the compo-sition of government spending on economic growth has never reached the outlines of a consensus. Acosta-Ormaechea and Morozumi (2013) have not found any signiicant relationship between the reallocation of spending on defense, infrastructure, health and social programs and long-term growth in GDP. However, when this reallocation occurs through increasing education spending, a robust association has been found. his association is even more robust when education spending takes the place of social spending. In this sense, Gemmel, Kneller and Sanz (2014) show that increases in the share of social spending may be associated with more modest recent growth in the GDP of OECD countries.
Similar research has analyzed the impact of government spending on education on the rate of
economic growth. A priori it would be expected that an increase in education spending would
reaching a consensus in terms of this relationship. Easterly and Rebelo (1993) observe that greater spending on public education is associated with greater levels of income inequality and, depending on the speciic type of econometrics used, the relationship between education and economic growth is not robust.
his lack of empirical support may be due to there being a more complex relationship between these two variables. In other words, government spending on education improves economic growth while taxes have the opposite efect, resulting in an ambiguous net efect. his ambiguity would be the result of the way in which the government inances educational spending – taxing income. his is why the inancing of government spending should be taken into account in these empirical esti-mates, since the adjustments to the overall equilibrium related to taxation will be present (Blankenau, Simpson and Tomljanovich, 2007).
Basu and Bhattarai (2009), on the other hand, ind a very weak correlation between growth and government spending on education, which suggests a non-linear U-shaped relationship between the two variables. For developed countries, government spending on education initially promotes a positive efect on economic growth, while in poorer countries, initial government spending on edu-cation may inhibit long-term growth. hus in countries which have historically done little in terms of education, the crowding out efect of government spending on private spending in education will dominate the complementary efect, resulting in low GDP growth.
Another component of government spending that has been investigated in the literature is infrastructure, which also does not appear to present a consensus. According to Dabla-Norris and partners (2012), not all investment in infrastructure is directly related to higher rates of growth, because investments of this nature are related to the eiciency and quality of the spending. A low return on a public investment resulting in ineiciency and low quality may be due to (i) the asym-metry of information in the implementation of projects, (ii) the wasting of resources and (iii) a lack of technical expertise. hus, the spending of resources does not necessarily imply an expansion of physical capital, like the construction of a highway that leads nowhere (Acosta-Ormaechea and Morozumi, 2013).
In this sense, Agénor and Neanidis (2006) and Agénor (2010) develop a long-term model in which public investment in infrastructure is the key to growth, concluding that the degree of eiciency in public infrastructure becomes non-linear in relation to the accumulation of public capital, which means that redirecting spending towards infrastructure projects will only be productive when the spending is very eicient. On the other hand, Aschauer (1989) inds a positive signiicant relationship between public investment in infrastructure (streets, avenues, airports, sewers and other items) and improvements in economic productivity and growth.
spending on health is of primary importance since it directly inluences individual productivity and thus GDP growth. Health spending contributes not only to labor productivity but also to the quality of education, improving the cognitive aspects related to the ability to learn and school attendance, and inducing in turn an increase in registrations.
On the other hand, Gemmel, Kneller and Sanz (2014) and Agénor (2010) point out that gov-ernment spending directed towards social assistance in particular has presented counterproductive behavior. hey argue that social spending has passed the inlexion point in the productivity curve. Meanwhile, in terms of defense, Barro (2004) and Acosta-Ormaechea and Morozumi (2013) have not found a signiicant relationship between spending in this area and economic growth, even though the relationship between these variables can occur through spending on defense investments that protect private property.
he studies that focus exclusively on the analysis of the composition of government spending and its inluence on growth (Haque, 2004; Agénor and Neanidis, 2006; Acosta-Ormaechea and Mozoru-mi, 2013; Albertini and Roulleau-Pasdeloup, 2014; Afonso and Jalles, 2013; and Gemmell, Kneller and Sanz, 2014), cite the seminal work of Devarajan, Swarrop and Zou (1996) which undertakes an analysis of developing nations. Using data from 43 countries over a period of 20 years, these authors demonstrate that an increase in overall government spending is positive and signiicant in relation to economic growth, even though capital expenditures have presented contrary signals in comparison to the other areas. his is explained by the fact that, when it occurs in excess, spending that has proved productive may become unproductive, and this can be observed in health, education, transport, communication and capital expenditures.
Finally, analyzing the OECD countries, Afonso and Jalles (2013) ind a very interesting result from the point of view of reallocating spending. While spending on education and health is productive in terms of economic growth, meaning they further GDP growth, income taxes, public employee salaries, interest payments on debt, and government consumption and subsidies promote the opposite efect, inhibiting growth in these countries. In the same way, spending on social security and well-being appear to be less productive than spending on health and education.
2.2 WHAT DOES THE BRAZILIAN LITERATURE SAY?
For the Brazilian economy we ind studies about the composition of government spending in relation to growth trends. Most of these studies concentrate on the impact of aggregate spending on growth or the impact of some particular component on economic growth.
productivity of government spending does not grow beyond the revenue limit, this will certainly help diminish GDP.
Meanwhile Herrera and Blanco (2006) verify the quality of iscal adjustments made since 1999 and their impact on long-term growth trends. Periods of successful stability coincided with periods in which iscal policy was more lexible in increasing the primary surplus, given that maintaining the surplus demonstrated government commitment. Since part of the adjustments were achieved through increasing tax receipts and reducing capital expenditures, this occurred in conjunction with an increase in spending on social security and social assistance. In this way, Brazil would be able to obtain gains by increasing investment in infrastructure, but the resulting increases in taxation would have pernicious efects on economic growth.
he literature has emphasized that government spending on investment when eicient can play an important high proile role in the country’s long-term growth, independent of the sphere that is being analyzed (federal, state or municipal). Rodrigues and Teixeira (2010) verify which of these spheres most inluenced Brazilian economic growth during the period from 1948 to 1998 considering the following spending categories: (i) consumption, (ii) subsidies and (iii) transfers. hey found that the states were the entities that most afected growth with investment being the most important component, which therefore should be prioritized. In compensation, spending on consumption, subsidies and transfers should be avoided, given that the public sector is not very productive in managing these areas.
Furthermore, in accordance with the spending productivity argument, Da Silva and Triches (2014) verify the impact of government spending on production from 1980 to 2005. Spending on communications, transport, health and sanitation is considered to be productive. hey found signiicant estimates for these variables from the statistical point of view. On the other hand, they did not ind signiicant estimates for spending on defense, national security and education, despite their theoretical importance in terms of growth. herefore, improvements in transport infrastructure and the quality of health and basic sanitation, for example, imply greater rates of GDP growth.
Rocha and Giubert (2007) is a pioneering work on the efect of the composition of spending on the Brazilian economy. he study’s goal is to determine which components of government spending inluenced Brazilian growth during the period from 1986 to 2003. Some of their indings are notable: irst of all, they ind a positive and signiicant relationship between defense, education, transport and communications spending and the rate of growth; secondly, they ind that the relationship between capital expenditures and the rate of growth is signiicant and apparently non-linear and, inally, the relationship between primary expenditures and the rate of economic growth is signiicant and
ap-parently non-linear. In relation to what was expected a priori, only health spending is found to be
insigniicant.
municipalities below the poverty line, spending on maintenance is found to be more productive than capital expenditures. his result may be attributed to the fact that economic growth is of primary importance to poorer municipalities.
herefore, there does not seem to be a consensus within the Brazilian or international literature in terms of the efects of the allocation of government spending on economic growth. An important point in this debate, which will serve as a backdrop theoretically as well as empirically, is the rela-tionship observed between productive and unproductive spending on economic growth, or in other words, the debate which considers the efects of the allocation of government spending on the rate of economic growth.
3. THE THEORETICAL MODEL
he discussion presented in the previous section calls attention to the importance of the composition of government spending in relation to economic growth. his section will present our basic model with the objective of synthesizing the causal relationships necessary for developing this study’s em-pirical analysis. his analysis will use the analytical model of Devarajan, Swarrop and Zou (1996) as a reference for two reasons:
(i) they do not establish a priori which forms of spending are productive or unproductive. he data
speaks for itself;
(ii) the model analyzes the efects of the composition of government spending on the rate of economic growth for any unit of analysis (countries, states, municipalities, etc.).
he analytical structure expresses the diference between productive and unproductive spending and the way a reallocation of this spending may afect steady-state growth rates. It assumes a pro-duction function with three arguments: the private stock of capital “k” and two types of government
spending “g1” and “g2”, productive and unproductive spending respectively. If the relationship between
the variables assumes the CES (Constant Elasticity of Substitution) functional form, we have:
y = f(k, g1, g2) = [ak-ζ + bg
1
-ζ + γg
2-ζ]
1
ζ (1)
where:
a> 0,b≥ 0, γ≥0, a + b+ γ = 1, ζ ≥ –1
According to Barro (1990), the government inances its spending according to the following relationship:
τy = g1 + g2 (2)
where:
With being the given parameters, the representative agent maximizes its utility function according to consumption “c” and capital stock “k”:
U = ∫0∞ U(C)e-ρt dt (4)
subject to:
k.= (1 – τ) y – c (5)
where ρ is the intertemporal discount rate.
he representative agent will maximize a CRRA (Constant Relative Risk Aversion)2 type utility
function:
U(C) = c
1–σ – 1
(6) 1 –
Substituting (6) in (4) and maximizing, subject to (1), (2), (3) and (5), we arrive at the consump-tion growth equaconsump-tion:
c.
= α(1 – τ) {α + (g/k)
-ζ [βφ ζ + γ (1 – φ)-ζ]} 1 + ζ
ζ - ρ
(7)
c σ
Assuming that in a steady state, taxation is the constant it follows that “g/k” is a constant that assumes:
g
={[τ ζ– βf – γ (1 – φ)
-ζ]}1ζ
(8)
k α
Substituting (8) in (7), we obtain the rate of growth of consumption “λ” as being:
λ = α(1 – τ) {ατζ / [τζ – βφ ζ – γ (1– φ)
-ζ]}1 + ζ
ζ + ρ (9)
σ
Diferentiating the equation (9) in relationship to parameter we have the relationship between
the rate of growth in the steady state and the portion of spending determined to be g1 (productive
spending):
dλ =α(1 – τ) (1 + ζ)[ατ ζ]1 + ζζ [βφ(1 + ζ) – γ (1 – φ)-(1 + ζ)]
(10)
dφ σ[τ ζ – βφ-ζ -γ (1 – φ)-ζ]-ζ1
From expression (10), we can infer that any component of government spending will be productive
when its relative increase implies an increase in the steady-state growth rate. hus, component g1 will
be productive if, and only if, dλ
dφ
. For this to occur, the parameters of the model need to satisfy several
conditions. Assuming that λ > 0, the right side of the equation (10) will be positive if:
(1 + ζ)[βφ–(1 + ζ) – γ (1 – φ)–(1 + ζ)] > 0 (11)
If ζ≥ –1 for dλ > 0,
dφ the expression (11) should satisfy
φ
< β θ
(12)
(1 – φ) γ
he parameter θ = 1/(1 + ζ) measures the elasticity of the substitution. According to this condition (12), we can see that the value of this parameter depends not only on the parameters that measure productivity (β and γ) but also on the initial composition of the spending. In this way, a reallocation of spending will not be productive if the initial value of share “θ” is very high. herefore, whether a given form of spending is productive will depend on the relationship between the elasticity coeicient and the initial value of the spending; or in other words, the reallocation of spending will not inluence GDP growth if the initial value of share (θ) is high.
4 THE ECONOMETRIC MODEL
4.1 THE ECONOMETRIC SPECIFICATION
he econometric speciication adopted to test the relationship between the per capita rate of growth and the allocation of government spending uses the previously mentioned endogenous growth model of Devarajan, Swarrop and Zou (1996) as a reference. he model produces an equation in which the
rate of GDP per capita growth “git” varies as a function of the ratio of Spending/GDP “G/Y” as well
as a vector of the relative spending “Gk/G,” both indexed to unit “i” over period “t.” he inclusion
of the term “G/Y” seeks to control for the level efect as well as the inancing of the spending on the
rate of growth (Devarajan, Swarrop and Zou, 1996; Blankenau, Simpson and Tomljanovich, 2007).
A control “φit” vector of variables, consistent with the empiricism involved, should be included
to achieve the best econometric speciication. he overall model thus assumes the following form:
git = Dyit = d1
(
YG)
it+ Skd2,k(
GGK)
it + μi + θt + φit + εit (13)Where: “yit” is the log of GDP per capita of the unit of cut “i” over period “t”, “git” is the rate of
GDP growth, “Y” is the level of GDP, “G” is total government spending and Gk is the spending of
the kth component; μi and θt correspond, respectively, to the idiosyncratic efect of each state and a
dummy temporal variable. Finally, εit denotes the error term.
For the rate of GDP per capita growth, a period of 4 years is considered ideal to measure growth (Devarajan, Swaropp and Zou, 1996; Rocha and Giuberti, 2007; Acosta-Ormaechea and Morozumi, 2013). Given period “t,” we have opted to use a moving growth average of the four following periods. In addition to being a more appropriate measure of long-term growth, it makes it possible to control possible sources of endogeneity (simultaneity) in the model.
We have also included a dummy variable for the Financial Responsibility Law (LRF) to evaluate the efect of the imposition of rules on government spending. Since the implementation of the LRF coincided with the beginning of the economic boom in the decade beginning in 2000, a dummy temporal variable has been inserted in the model to control for the economic cycle efect, making the LRF variable more accurate in measuring the efect of the imposition of budgetary rules.
4.2 THE DATA
he results that appear below are based on three data sources that cover the period from 1995 to 2011. he iscal data was extracted from the Brazilian Treasury’s database through the Budgetary Execution item. he rate of economic growth (a proxy for long-term growth) was obtained based on GDP per capita data supplied by the Brazilian Institute of Geography and Statistics (IBGE). he population growth and unemployment rates were extracted from Datasus, the IT Department of SUS (Brazil’s Uniied Health System). he statistics package Stata was used to perform the econometric calculations.
he 26 states and the Federal District of Brazil were used for the equation’s empirical estimate (13). he Brazilian Treasury uses spending nomenclature that is distinct from that used by interna-tional empirical works. According to the concept of Budgetary Execution, the igures for expenses are categorized as: (i) legislative; (ii) judicial; (iii) administration and planning; (iv) agriculture; (v) communications; (vi) national defense and security; (vii) regional development; (viii) education and culture; (ix) energy and mineral resources; (x) habitation and urban planning; (xi) industry, commerce and services; (xii) foreign relations; (xiii) health and sanitation; (xiv) labor; (xv) social assistance and social security; and (xvi) transport.
Since spending on Foreign Relations, Labor, Communications, Energy and Mineral Resources and Regional Development is relatively low in budgetary terms and in some cases much information is missing, we use the following categories: (i) administration and planning, (ii) legislative, (iii) judicial, (iv) transport, (v) public safety, (vi) industry, commerce and services, (vii) education and culture, (viii) habitation and urban planning, (ix) social assistance and social security and (x) health and sanitation. his data can be found in the Brazilian Treasury website under the Budgetary Execution item.
Here is a description of each variable used in the empirical model:
rategdpgrowth = rate of GDP per capita growth for each state. his series was constructed taking into account the following four periods.
spendinggdpratio = the ratio of total spending/GDP for each state.
administration_and_planning = ratio of the spending on “administration and planning” divided by total spending.
legislative = ratio of legislative spending divided by total spending.
judicial = ratio of judicial spending divided by total spending.
transport = ratio of transport spending divided by total spending.
public_safety = ratio of public safety spending divided by total spending.
industry_commerce_service = ratio of industry, commerce and service spending divided by total spending.
education_culture = ratio of education and culture spending divided by total spending.
social_assistance_social_security = ratio of social assistance and social security spending divided by total spending.
health_sanitation = ratio of health and sanitation spending divided by total spending.
ratepopgrowth = rate of population growth.
rateunemployment = rate of statewide unemployment.
lrf = dummy variable which deines the Financial Responsibility Law (LRF).
First we constructed a Fixed Efect (FE) and Random Efect (RE) panel data model. To achieve the best model speciication, we performed the Hausman test to verify which would be the most appro-priate data structure. If the model suggested by the Hausman test was the Random Efect (RE) model, we would have proceeded with the Breusch-Pagan test which compares the REs with the Ordinary Least Squares (OLS). Otherwise we would conclude that the Fixed Efect (FE) model would be ideal.
5. EMPIRICAL RESULTS
To verify the appropriateness of the model, we performed speciication tests. First the Hausman3
test veriied which was the most appropriate data structure, RE or FE. If the model suggested by the Hausman test was the Random Efect (RE) model, we would have proceeded with the Breusch-Pagan test which compares the REs with the Ordinary Least Squares (OLS).
According to Wooldridge (2002), the FE estimator will always produce consistent estimators no matter which model is used; however, this estimator may not necessarily be the most eicient. On the other hand, the RA estimator will be not only consistent, but also the most eicient, if the RE model is the appropriate model. Table 1 presents the results of the Hausman test and the estimated econometric model.
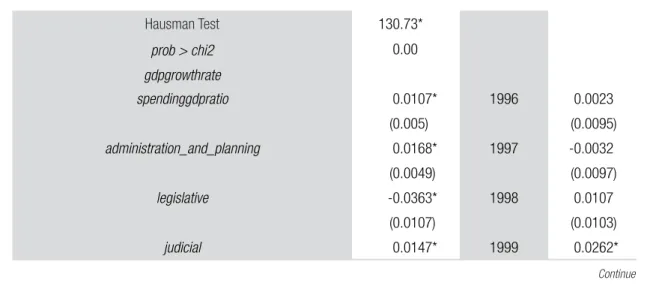
TABLE 1 HAUSMAN TEST AND THE FE MODEL FOR SPENDING BY FUNCTIONAL CATEGORY
Hausman Test 130.73*
prob > chi2 0.00
gdpgrowthrate
spendinggdpratio 0.0107* 1996 0.0023
(0.005) (0.0095)
administration_and_planning 0.0168* 1997 -0.0032
(0.0049) (0.0097)
legislative -0.0363* 1998 0.0107
(0.0107) (0.0103)
judicial 0.0147* 1999 0.0262*
3 he Hausman test veriies whether there is a signiicant diference between the FE and RE estimators. If the Hausman test is not sig-niicant, the RE model should be used.
(0.0044) (0.0106)
transport -0.0017 2000 -0.0528*
(0.0027) (0.0151)
public_safety 0.001 2001 omitted
(0.0039)
industry_commerce_service -0.0006 2002 0.032*
(0.0039) (0.0122)
education_culture -0.0242* 2003 0.0668*
(0.0125) (0.0125)
habitation_urban_planning 0.0041** 2004 0.0973*
(0.0023) (0.0130)
social_assistance_social_security 0.0096* 2005 0.1252*
(0.0044) (0.0135)
health_sanitation 0.0062 2006 0.1596*
(0.0072) (0.0137)
rateunemployment 0.0158* 2007 0,1922*
(0.0064) (0.0146)
ratepopgrowth 0.092*
(0.0549)
lrf 0.0907*
(0.0169)
constant 0.924
(0.8307)
n. obs. 308
Festat 118.78
R2
within 0.9206
between 0.0586
overall 0.1469
Source: Elaborated by the authors. * variable with less than 5% signiicance. ** variable with less than 10% signiicance. null variable not signiicant.
standard error between parentheses.
Given that the Hausman test was statistically signiicant, the ideal model to analyze the relationship between the allocation of government spending and economic growth is the Fixed Efects model. hus, there is no need to perform the Breusch-Pagan LM test.
he spending on the three spheres of government presents signiicant parameters from the sta-tistical point of view. Spending on administration and planning and judiciary spending were found to be productive, while legislative spending presented unproductive behavior. In terms of public administration spending, an increase of 1% led to an increase of 0.0168% in the rate of growth and in terms of judicial spending the igure was 0.0147%. A 1% increase in legislative spending resulted in a decline in GDP of 0.0363%.
he igures for transport, public safety, and industry, commerce and service spending were not signiicant, leading us to believe that spending of this nature, related to public infrastructure, has not afected the economic growth of the states.
One result that draws our attention is that spending on education and culture was found to be unproductive (having a negative parameter). In this way, a variation of 1% in education and culture spending was associated with a decline in state GDP on the order of 0.0242%. he unproductiveness of education spending may be related to high costs of education and low returns, a situation which is characteristic of developing countries, when compared to countries with a lower education/GDP ratio and high returns from education (Blankenau, Simpson and Tomljanovich, 2007). Another factor that could be inluencing this result is the fact that this variable is not pure given that the Brazilian Treasury only publishes igures for the sum of education and culture spending.
On the other hand, spending on habitation and urban planning along with social assistance and social security was also statistically signiicant and productive in terms of economic growth. An increase in 1% in terms of habitation and urban planning spending promoted a 0.0041% increase in growth, while social assistance and social security spending promoted a 0.0096% increase in growth in the Brazilian states. hese results may be associated with the nature of this spending. Social spending promotes greater physical and mental vigor within the population, thus increasing productivity and healthy days of work (Weil, 2014; Bhargava et al., 2001; Bloom et al., 2004, Bloom and Canning, 2005).
Finally, let us examine the result for the LRF dummy variable. Since the ixed efects of time were controlled for in this model by the inclusion of a temporal dummy variable, thus making it possible to control for the efect of the economic cycle on this model, we found that the imposition of rules by the LRF have been in general productive in terms of the growth of the Brazilian states.
6. CONCLUSIONS
his study seeks to answer how the long-term growth of the Brazilian states and the federal district has responded to the allocation of government spending through an analysis of this spending by functional category. Many previous studies have tried to answer this question in one form or another, without arriving at a consensus. Obviously, the results presented here do not represent the last word on this subject, which must be examined further in the future, given the scarcity of studies of this nature in the Brazilian literature.
Our objective has been to analyze the efects of the composition of government spending on the rates of growth of Brazilian states from 1995 to 2011. Based on the speciication criteria, the most appropriate model for this empirical analysis has been determined to be a Fixed Efects model. Here are some of the most important results:
of Brazilian states. his result means that a 1% increase in total government spending leads to a 0.01% increase in economic growth for these states.
(ii) In relation to spending within the three spheres of government — executive or administrative, legislative and judicial, only legislative spending was found to be unproductive. A 1% increase in legislative spending was associated with a 0.0363% reduction in the rate of the states’ GDP growth. On the other hand, a 1% increase in public administration spending promoted a 0.0168% increase in the growth, while judicial spending promoted a 0.0147% increase in growth.
(iii) Transport, public safety, industry, commerce and service spending was not signiicant. hey are, in general, types of infrastructure spending which do not present any relationship to state economic growth.
(iv) Spending on education and culture proved to be unproductive in these terms. A 1% increase in this area was associated with a reduction in state economic growth on the order of 0.0242%. It is important to point out that it is not always possible to ind a clear and robust relationship between education and growth, given that it depends on the way the spending is carried out by the public authorities and/or the econometric speciication adopted, which may be linear or quadratic, etc. However, alternative speciications were tested and there was no signal inversion for this variable parameter, which leads us to the hypothesis that the quality of the execution of education spending has been low.
(v) Spending on habitation and urban planning along with social assistance and social security proved to be productive in terms of economic growth. A 1% increase in habitation and urban planning spending was associated with a 0.0041% increase in growth, while a 1% increase in social assistance and social security spending promoted a 0.0096% increase in the growth of Brazilian states. (vi) he results for the dummy LRF variable demonstrated that the imposition of iscal rules has been
beneicial in terms of promoting an environment conducive to greater economic growth.
he results overall are consistent with other contributions to the literature on the theoretical and empirical side of the spectrum. Using the terminology of productive and unproductive government spending, we can say that total government spending has been productive, at least for the period from 1995 to 2011.
Some variables related to the basic functioning of the government in the economic area present robust positive behavior in terms of GDP, examples being spending of a social nature (habitation and urban planning along with social assistance and social security), which are types of spending that promote greater biological vigor within the population, improving productivity and the number of healthy days of work.
REFERENCES
ACOSTA-ORMAECHEA, Santiago; MOROZUMI, Atsuyoshi. Can a government enhance long-run growth by changing the composition of public expenditure? IMF Working Paper, v. 13, n. 162, p. 1-44, 2013.
AFONSO, António; JALLES João T. Fiscal compo-sition and long-term growth. Working Paper Series, n. 1518, p. 1-43, 2013.
AGÉNOR, Pierre-Richard. A theory of infrastructu-re-led development. Journal of Economic Dynamics
& Control, v. 34, n. 5, p. 932-950, 2010.
AGÉNOR, Pierre-Richard; NEANIDIS, Kyriakos C. he allocation of public expenditure and economic growth. Economics Discussion Paper, n. EDP-0608, p. 1-58, 2006.
ALBERTINI, Julien; POIRIER, Arthur; ROULLEAU -PASDELOUP, Jordan. he composition of govern-ment spending and the multiplier at the zero lower bound. Economic Letters, v. 122, n. 1, p. 31-35, 2014.
ALDERMAN, Harold; BEHRMAN, Jere R.; HOD-DINOTT, John. Nutrition, malnutrition and econo-mic growth. In: LÓPEZ-CASASNOVAS, Guillem; RIVERA, Berta; CURRAIS, Luis (Ed.). Health and
economic growth: indings and policy implications.
Cambridge: he MIT Press, 2005.
ALESINA, Alberto; ARDAGNA, Silvia. Tales of iscal adjustments. Economic Policy, v. 27, n. 27, p. 489-585, 1998.
ALESINA, Alberto; PEROTTI, Roberto. Fiscal adjustments in OECD countries: composition and macroeconomic efects. Working Paper, n. 5730, p. 1-46, 1996.
ALESINA, Alberto; PEROTTI, Roberto. Fiscal ex-pansions and iscal adjustments in OECD countries.
NBER Working Paper Series, n. 5214, p. 1-38, 1995.
ASCHAUER, David A. Is public expenditure pro-ductive? Journal of Monetary Economics, v. 23, n. 2, p. 177-200, 1989.
BARRO, Roberto J. Economic growth. Cambridge: he MIT Press: 2004.
BARRO, Robert J. Government spending in a simple model of endogenous growth. he Journal of Political
Economy, v. 98, n. 5, p. 103-125, 1990.
BASU, Parantap; BHATTARAI, Keshab. Does go-vernment spending on education promote growth and schooling returns? Durham University and Hull
University Working Paper, p. 1-22, 1999.
BHARGAVA, Alok et al. Modelling the efects of health on economic growth. Journal of Health Eco-nomics, v. 20, n. 3, p. 423-440, 2001.
BLANKENAU, William F.; SIMPSON, Nicole B.; TOMLJANOVICH, Marc. Public education ex-penditures, taxation, and growth: linking data to theory. American Economic Review, v. 2, n. 97, p. 393-397, 2007.
BLOOM, David E.; CANNING, David. Health eco-nomic growth: reconcilling the micro and macro evidence. CDDRL Working Papers, Stanford Institute of International Studies, n. 42, p. 1-25, 2005.
BLOOM, David E.; CANNING, David; SEVILLA, Jaypee. he efect of health on economic growth: a production function approach. World Development, v. 32, n. 1, p. 1-13, 2004.
CÂNDIDO JR., José O. Os gastos públicos no Brasil são produtivos? Planejamento e Políticas Públicas, n. 23, p. 233-260, 2001.
DA SILVA, Soraia S.; TRICHES, Divanildo. Uma nota sobre efeitos de gastos públicos federais so-bre o crescimento da economia brasileira. Revista
Brasileira de Economia, v. 68, n. 4, p. 547-559, 2014.
DABLA-NORRIS, Era et al. Investing in public in-vestment: an index of public investment eiciency.
Journal of Economic Growth, v. 17, n. 3, p. 235-266,
2012.
DATASUS. Departamento de Informática do SUS. Available at: <www2.datasus.gov.br/DATASUS/ index.php>. Acessed on: 20 Feb. 2015.
DEVARAJAN, Shantayan; SWARROP, Vinaya; ZOU, Heng-fu. he composition of public expenditure and economic growth. Journal of Monetary Economics, v. 37, n. 2, p. 313-344, 1996.
DIVINO, José A.; DA SILVA JR., Rogério L. S. Com-posição dos gastos públicos e crescimento econômi-co dos municípios brasileiros. Revista Economia, v. 13, n. 3, p. 507-528, 2012.
FELDSTEIN, Martin. Government deicits and ag-gregate demand. Journal of Monetary Economics, v. 9, n. 1, p. 1-20, 1982.
GEMMEL, Norman; KNELLER, Richard; SANZ, Ismael. Does the composition of government expen-diture matter for long-run GDP levels? Working Papers
in Public Finance, University of Wellington, n. 10, 2014.
HAQUE, Emranul. he composition of government expenditure and economic growth in developing economies. Global Journal of Finance and Economics, v. 1, n. 1, p. 97-117, 2004.
HERRERA, Santiago; BLANCO, Fernando. The quality of iscal adjustment and the long run grow-th impact of iscal policy in Brazil. Working Paper, World Bank Policy Research, n. 4004, 2006.
IBGE. Instituto Brasileiro de Geograia e Estatística. Available at: <www.ibge.gov.br/home/>. Acessed on: 20 Feb. 2015.
INGERSOLL JR., Jonathan E. heory of inancial
deci-sion making. New Haven: Yale University Press, 1986.
LUCAS, Robert E. On the mechanics of economic development. Journal of Monetary Economics, v. 22, n. 1, p. 3-42, 1988.
ROCHA, Fabiana; GIUBERTI, Ana C. Composição do gasto público e crescimento econômico: uma avaliação macroeconômica da qualidade dos gastos dos estados brasileiros. Economia Aplicada, v. 11, n. 4, p. 463-485, 2007.
RODRIGUES, Rodrigo V.; TEIXEIRA, Erly C. Gasto público e crescimento econômico no Brasil: uma análise comparativa dos gastos das esferas do governo. Revista Brasileira de Economia, v. 64, n. 4, p. 423-438, 2010.
STATA. Data Analysis and Statistical Software. Versão 12.
TESOURO NACIONAL. Available at: <www.tesou-ro.fazenda.gov.br/pt_PT/contas-anuais>. Acessed on: 20 Feb. 2015.
WEIL, David. N. Health and economic growth. In: AGUION, Philippe; DURLAUF, Steven N. (Ed.).
Handbook of economic growth. North Holland:
El-sevier, 2014. v. 2.
WOOLDRIDGE, Jefrey M. Econometric analysis of
cross-section and panel data. Cambridge: he MIT
Press, 2002.
Luiz Carlos Ribeiro Neduziak
PhD from the Graduate Program in Economic Development at the Federal University of Paraná (UFPR). Full Professor at the Faculty of Social Studies of Paraná (FESP-PR) and Assistant Professor at the Catholic University of Paraná (PUC-PR). Email: [email protected].
Fernando Motta Correia