ADVANCED METHODOLOGIES FOR THE FATIGUE
ANALYSIS OF REPRESENTATIVE DETAILS OF
METALLIC BRIDGES
António Luís Lima da Silva
2015
Thesis presented to the Faculty of Engineering of the University of Porto for the Doctor Degree in Mechanical Engineering
Supervisors
António Augsto Fernandes Full Professor Abílio Manuel Pinho de Jesus Assistant Professor
To my wife Andreia and my daughter Áurea.
A
CKNOWLEDGMENTS
This thesis was possible due to the assistance received from many individuals and organizations. Acknowledgments have to be addressed to a large number of persons and institutions. The words and feelings expressed in these acknowledgments express my genuine gratitude to those who have provided important assistance and support during my studies. The order of appearance of individuals and organizations does not reflect in any way the level of importance of their contribution to the success of the research presented in this thesis.
• To my supervisors, Professor António Augusto Fernandes and Professor Abílio Manuel Pinho de Jesus, who gave me far more help and assistance than that I could expect. Their guidance and discussion about the structure of the thesis and several theoretical and methodological aspects of the research is recognized; their assistance on pointing out me the right direction regarding the experimental and numerical analysis were also enthusiastically appreciated;
• To the Portuguese Foundation for Science and Technology (FCT) and the European Commission, respectively in the context of the doctoral scholarship SFRH/BD/72434/2010 and FADLESS project (RFSR-CT-2009-00027), that provided the necessary funds to carry out the work;
• To the University of Trás-os-Montes e Alto Douro for providing the access to their laboratories;
• To the INSA-Lyon and particularly to Prof. Maigre and Prof. Gravouil for their support and help, during a 3 months internship, that allowed me to understand the XFEM methodology;
• To Dr. José Xavier for his unconditional support and help in the development of experimental procedures and also several algorithms used in this thesis, in particular what concerns the use of DIC;
• To my collegues from the Civil Engineering Department of the Faculty of Engineering of the University of Porto, Carlos Albuquerque and Fernando Marques, for their sympathy, partnership and collaboration;
• To Professors Rui Calçada and Álvaro Cunha for their leadership in the FADLESS project context and for their key contributions for the presented research;
• To Engº Miguel Figueiredo from the Mechanical Department of the Faculty of Engineering of the University of Porto and responsible for LET, Dr. Cristóvão Santos, Prof. Paula Braga both from the University de Trás-os-Montes and Alto Douro for their support in their respective work domain, particularity concerning the experimental activities;
• My fraternal thanks to João Pereira and Fábio Pereira; without their friendship and help, this PhD would be more burdensome;
• Lastly, but certainly not least at all, I am very grateful to my wife Andreia for her love and continuous understanding and support.
Abstract
Advanced methodologies for the fatigue analysis of metallic bridges are investigated in this thesis. Local approaches to fatigue are proposed for complex bridge details leading to multi-scale problems requiring efficient tools to allow feasible solutions for real bridge components under actual traffic conditions. The current doctoral thesis was prepared within the framework of the FADLESS European project (Fatigue Damage
Control and Assessment for Railways Bridges) where two bridge case studies were
investigated, and selected representative details supported the analyses presented in this thesis. Trezói and Alcácer do Sal Railway Bridges, respectively riveted and welded bridges, motivated a significant experimental study aiming the characterization of the fatigue behaviour of riveted and welded joints, as well as the fatigue characterisation of respective materials (S235 and S355 structural steels). The generated experimental data was important to provide basic material data for models identification as well as for the models validation. The down-scale fatigue testing of riveted and welded components and the mixed-mode fatigue crack propagation tests assisted by Digital Image Correlation could be emphasized as noteworthy contributions from the experimental program.
This doctoral research also included significant numerical fatigue investigation. Both local approaches to fatigue and Fracture Mechanics were applied to simulate the fatigue crack initiation and propagation of tested details. Several finite element models of tested riveted and welded connections were developed in order to validate fatigue life prediction models. Distinct finite element approaches were used to simulate the fatigue crack propagation. This included the finite element method and the extended finite method, the latter being attractive since it does not require remeshing operations.
In general, it was observed a good compromise between simulations and experimental results.
Finally, numerical fatigue studies were developed for selected structural details of the Trezói and Alcácer do Sal railway bridges. With respect to the first case study, it was recognized the necessity to develop multiaxial fatigue analyses. Also, non-proportionality of stress states and their random time history nature were verified, demanding specialized damage models. For riveted joints, the simulation of rivets using contact elements is crucial to obtain reliable critical locations. An innovative approach for the fatigue damage assessment based on modal stress intensity factors superposition was also addressed in this doctoral thesis. The key objective of this methodology aims an efficient fatigue damage analysis considering the concept of modal stress intensity factors. It was found that the approach was able to simulate the residual fatigue life of a welded detail of the Alcácer do Sal Railway Bridge, for a significant traffic sample from the monitoring system.
R
ESUMO
Metodologias avançadas para análise à fadiga de pontes metálicas são objeto de estudo nesta dissertação. As abordagens locais de fadiga propostas para detalhes complexos de pontes conduzem a problemas multiescala que requerem ferramentas eficientes de modo a permitir soluções confiáveis para detalhes de pontes reais sob a ação de condições de tráfego representativas. A presente tese foi realizada no contexto do projeto Europeu FADLESS onde dois casos de estudo foram investigados, tendo-se selecionado dois detalhes estruturais representativos para suportar as análises realizadas nesta dissertação. As pontes ferroviárias de Trezói e Alcácer do Sal, respetivamente rebitadas e soldadas, motivaram um programa experimental visando a caracterização do comportamento à fadiga de ligações rebitadas e soldadas, assim como a caracterização à fadiga dos respetivos materiais (aços estruturais S235 e S355). Os resultados experimentais providenciaram informação essencial relativa aos materiais, necessária à identificação dos modelos, assim como a informação para a validação dos mesmos modelos. Merecem destaque os ensais de fadiga em ligações rebitadas e soldadas, construídas numa escala reduzida dos detalhes reais das pontes, assim como os ensaios de propagação de fendas em modo misto, assistidos por técnicas de correlação digital de imagem.
A presente tese de doutoramento também contempla uma componente numérica importante que visa a simulação do comportamento à fadiga de detalhes estruturais recorrendo a modelos de iniciação e de propagação de fendas, baseados em abordagens locais da fadiga e Mecânica da Fratura. Foram propostos vários modelos de elementos finitos dos componentes rebitados e soldados testados, no sentido de validar modelos de previsão de vida à fadiga. Neste domínio, a presente tese de doutoramento abrange diversas metodologias numéricas para a modelação de propagação de fendas de fadiga. A metodologia XFEM foi considerada para modelar a propagação de fendas de fadiga em ligações, sem haver a necessidade de refazer a
malha de elementos finitos, para cada incremento de fenda de fadiga. Em geral foi observado um bom compromisso entre as simulações e os resultados experimentais. Finalmente foram desenvolvidos estudos numéricos incidindo nos detalhes estruturais selecionados das pontes ferroviárias de Trezói e Alcácer do Sal. No que diz respeito ao primeiro caso de estudo, foi reconhecida a necessidade de uma análise de fadiga multiaxial. Foi também observada a não-proporcionalidade do estado de tensões e a natureza aleatória da sua história, o que exige a utilização de modelos de dano especializados. A simulação do comportamento à fadiga de ligações rebitadas requer o uso de elementos finitos de contacto para estimativas fiáveis das zonas críticas. Foi ainda testada uma abordagem inovadora para a determinação de vidas residuais de componentes recorrendo à Mecânica da Fratura, com a história dos fatores de intensidade de tensões simulada através da sobreposição modal de fatores de intensidade de tensões. Esta abordagem foi demonstrada para um detalhe soldado da ponte de Alcácer do Sal permitindo a computação, de forma eficiente, da evolução do dano de fadiga considerando uma amostra significativa de comboios resultante de um sistema de monitorização.
C
ONTENTS
Acknowledgments V
Abstract VII
Resumo IX
Contents XI
List of Figure XIX
List of Tables XXXVII
Nomenclature XLI
Chapter I - Introduction
1.1. Introduction 1.2
1.2. Aim of the thesis 1.3
1.2.1. Trezói Railway Bridge case study 1.5
1.2.2. Alcácer do Sal Railway Bridge case study 1.8
1.3. Outline of the thesis 1.9
1.4. References 1.11
Chapter II - A review of fatigue assessment
methodologies for bridge details
2.2. General considerations on fatigue of steel structures 2.4
2.2.1. Stress-based fatigue approach 2.4
2.2.2. Fracture mechanics based fatigue approach 2.7
2.2.3. Variable amplitude stress conditions 2.8
2.2.4. Multiaxial fatigue 2.9
2.2.5. Code-based S-N fatigue curves for structural details 2.10 2.3. Overview of existing research on riveted members and connections 2.12 2.4. Overview of existing research on welded members and connections 2.25
2.5. Concluding remarks 2.32
2.6. References 2.32
Chapter III - Fatigue characterization of structural steels
3.1. Introduction 3.2
3.2. Microstructures of the S355 and S235 structural steels 3.3 3.3. Assessment of cyclic elastoplastic and fatigue behaviours of the S355 and S235 structural steels
3.3
3.3.1. Cyclic elastoplastic behaviour of the S355 steel 3.5 3.3.2. Cyclic elastoplastic behaviour of the S235 steel 3.9 3.3.3. Strain-life behaviour of the S355 steel 3.12 3.3.4. Strain-life behaviour of the S235 steel 3.14 3.3.5. Comparison of the cyclic elastoplastic and fatigue behaviours of the tested structural steels
3.16
3.4. Assessment of fatigue crack growth rates of the S355 and S235 structural steels
3.18
3.4.1. Fatigue crack propagation rates of the S355 steel 3.20 3.4.2. Fatigue crack propagation rates of the S235 steel 3.26
3.4.2.2. Mixed- mode (I and II) fatigue crack propagation rates of the S235 steel
3.29
3.4.2.2.1. Digital image correlation 3.32
3.4.2.2.2. Crack tip location assessment 3.33 3.4.2.2.3. Stress intensity factors assessment for
experimentally based crack paths
3.47
3.4.2.2.3.1. SIFs computation using full-field DIC displacements
3.47
3.4.2.2.3.2. Stress intensity computation using FEM 3.50 3.4.2.2.4. Correlation of pure mode I and mixed mode
crack propagation data
3.55
3.4.3. Comparison of fatigue crack growth data of several structural steels
3.56
3.4.4. Comparison of fracture surfaces between S355 and S235 structural steels
3.57
3.5. Concluding remarks 3.58
3.6. References 3.60
Chapter IV - Fatigue behaviour of relevant riveted and
welded details of railway bridges
4.1. Introduction 4.2
4.2. Experimental fatigue program of riveted details 4.3 4.2.1. Design of the riveted specimens and experimental details 4.3 4.2.2. S-N fatigue results obtained for riveted specimens 4.14
4.2.2.1. Statistical assessment of fatigue data aiming S-N curves definition
4.15
4.2.3. Fatigue classification of riveted joints 4.28 4.3. Experimental fatigue program of welded details 4.32
4.3.1. Design of welded specimens 4.33
4.3.2. Experimental results 4.43
4.3.2.1. Fracture surfaces of welded specimens 4.57 4.3.2.2. Digital image correlation performed on welded
specimens
4.59
4.4. Concluding remarks 4.68
4.5. References 4.70
Chapter V - Welded joint fatigue behaviour assessment
using mesh insensitive procedures and S-N master
curve concepts
5.1. Introduction 5.2
5.2. Mesh insensitive procedure to compute structural stresses on welded joints
5.4
5.2.1 Equivalent structural stress compatible with a S-N Master Curve 5.8 5.3. Mesh insensitive approach – verification examples 5.12
5.3.1. Verification example 1: 2D tensile problem 5.12 5.3.2. Verification example 2: 2D bending problem 5.15 5.3.3. Verification example 3: 3D tensile problem 5.17 5.4. Mesh insensitive approach applied to tested welded specimens 5.20
5.5. Concluding remarks 5.35
6.1. Introduction 6.2
6.2. Crack initiation assessment 6.3
6.3. Fatigue crack propagation assessment 6.4
6.3.1. Fatigue crack growth simulation 6.4
6.3.2. Stress intensity factor computation 6.5
6.3.2.1. Contour integral evaluation 6.7
6.3.2.2. J-integral 6.7
6.3.2.3. Stress intensity factor computation 6.10
6.3.3. Virtual Crack Closure Technique 6.12
6.4. The Standard Finite Element method applied to fractured solids 6.15 6.5. The eXtended finite element method applied to fractured solids 6.16
6.5.1. Enrichment functions 6.17
6.5.2. Level set method for modelling discontinuities 6.18
6.5.3. Blending elements 6.20
6.6. Verification examples of stress intensity factors computation 6.21
6.6.1. Verification example 1 6.22
6.6.2. Verification example 2 6.30
6.7. Numerical simulation of welded specimens 6.36
6.8. Numerical simulation of riveted specimens 6.44
6.9. Concluding remarks 6.59
Chapter VII - Fatigue modelling of a relevant detail from
the Trezói bridge
7.1. Introduction 7.2
7.2. Overview of the proposed approach 7.3
7.3. Finite element model of a structural detail from Trezói bridge 7.8
7.4. Results and discussion 7.15
7.4.1. Continuous finite element model of the structural detail of the Trezói bridge: results analysis
7.18
7.4.2. Riveted finite element model of a structural detail of the Trezói bridge: results analysis
7.30
7.5. Concluding remarks 7.38
7.6. References 7.40
Chapter VIII - Finite element modelling of a relevant
detail of the Alcácer do Sal Bridge
8.1. Introduction 8.2
8.2. Theoretical background 8.3
8.2.1. Dynamic analysis using modal superposition 8.3
8.2.2. Fatigue model 8.5
8.2.3. Modal superposition of stress intensity factors 8.7 8.3. Proposed workflow for residual fatigue life assessment of bridge
details
8.9
8.4. Application of the proposed methodology to a case study 8.13
8.4.1. Monitoring system 8.13
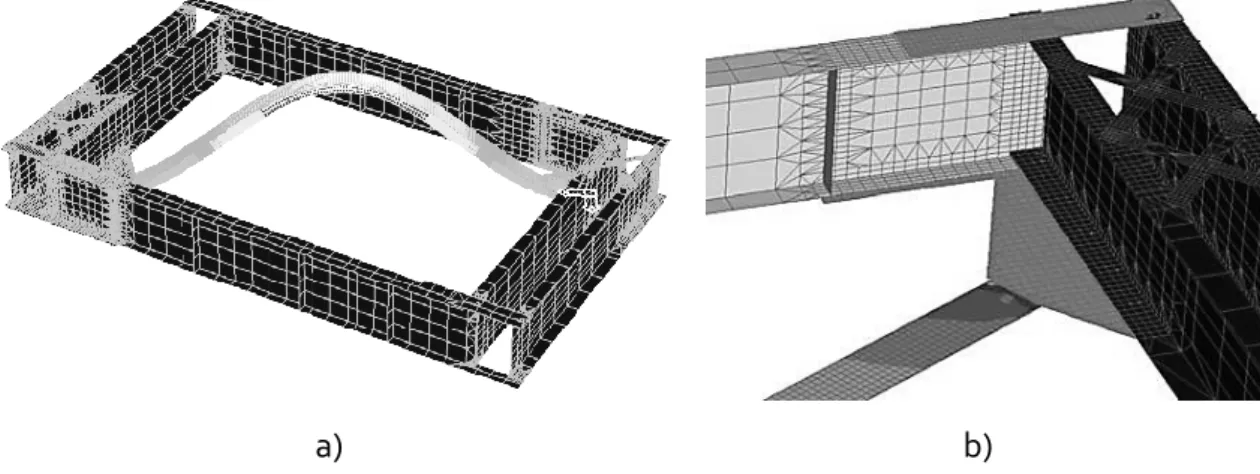
8.4.2. The global numerical model of the bridge 8.15 8.4.3. The local numerical model of the selected detail and
shell-to-solid sub-modelling technique
8.5. Results 8.19
8.5.1. Experimental Validation 8.19
8.5.2. Comparison of stress intensity factors computation techniques 8.22
8.5.3. Residual fatigue life computation 8.22
8.6. Concluding remarks 8.26
8.7. References 8.27
Chapter IX - Final conclusion and future works
9.1. Overview of main results 9.2
9.2. Future works 9.8
L
IST OF
F
IGURES
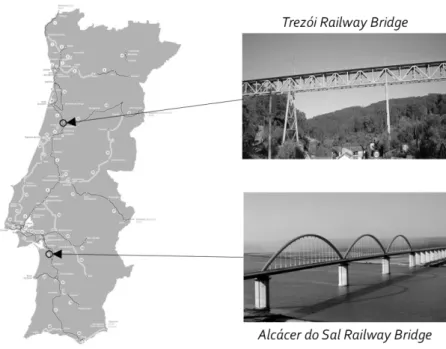
1.1 Location of the Trezói and Alcácer do Sal Railway Bridges. 1.4
1.2 General view of the Trezói Bridge [1]. 1.6
1.3 Technical representation of the Trezói Bridge: elevation and plan
view [1].
1.6
1.4 Partial view of the upper structure. 1.7
1.5 Selected structural detail. Connection between the cross girder and
the main chord [1].
1.7
1.6 Overview of the bridge of the new railway crossing of the river Sado
(adapted from [2]).
1.8
1.7 Diaphragm 54 of the Alcácer do Sal Bridge: global overview of the
diaphragm; b) detail of the welded joint.
1.9
2.1 Schematic S-N curve. 2.6
2.2 Schematic da/dN versus K curve. 2.8
2.3 Collected fatigue damage cases listed according to the type of detail
in which they were met [37].
2.13
2.4 Stringer-to-cross-girder assembly tested by Abouelmaaty et al. [44]. 2.16
2.5 Stringer-to-cross-girder assembly tested by Al-Emrani [45]
(dimensions in mm).
2.16
2.6 Finite element model of a stringer-to-cross-girder assembly
developed by Al-Emrani and Kliger [54].
2.19
2.7 3-D finite element model developed by Al-Emrani et al. [55]. 2.19
2.8 Global-local FE models of a riveted bridge module proposed by Imam
[58].
2.10 FE model of the substructure elements according Ghafoori et al. [62].
2.22
2.11 FE model of a single rivet connection from the Trezói railway bridge proposed by Correia et al. [65].
2.23
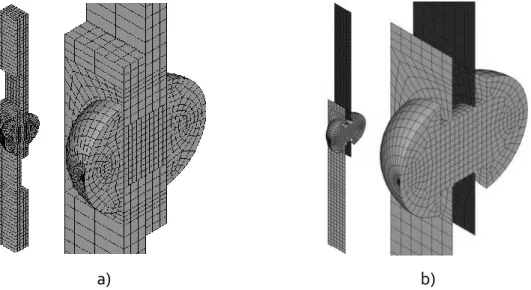
2.12 Finite element models of a single riveted connection: a) Solid finite element models; b) Shell finite element model (Correia et al. [65]).
2.24
2.13 Finite element models of a multiple rivets connections: a) solid finite element models; b) shell finite element models (Rodrigues et al. [66]).
2.24
2.14 Small ICOM specimens tested by Frýba [68]: a) specimen with circular cut-outs; b) specimens with cut-outs with apple form.
2.25
2.15 Truss girder tested by Schumacher, general geometric configuration and dimensions [70].
2.27
2.16 Transverse stiffener specimen geometries tested by Ghahremani et al.: a) straight geometry; b) variable width geometry [72].
2.27
2.17 Finite element model of a welded joint investigated by Xiao et al [73]. 2.28
2.18 Finite element models of an investigated welded joint by Heshmati [74].
2.30
2.19 Welded detail investigated by Aygül [75]: a) Fatigue test specimen loading and investigated hot spot points; b) solid element model with an element size of 4 mm.
2.30
2.20 Finite element models of a welded connection investigated in [78]. 2.31
3.1 Typical microstructures of the S355 and S235 structural steels: a)
S355, 200x magnification; b) S235, 200x magnification; c) S355, 500x magnification; d) S235, 500x magnification; e) S355, 1000x magnification; f) S235, 1000x magnification.
3.4
3.2 Experimental setup: a) INSTRON 8801 servo-hydraulic machine; b)
INSTRON clip gauge, model 2670-602.
3.5
3.3 Smooth plane fatigue specimen (S355 steel): a) dimension in mm; b)
photo of a smooth plane specimen.
3.7
3.6 Cyclic curve of the S355 steel grade. 3.9
3.7 Smooth plane fatigue specimen (S235 steel) (dimension in mm). 3.10
3.8 Fatigue hysteresis loop of the S235 steel. 3.11
3.9 Stress range evolution with the number of cycles (S235 steel). 3.11
3.10 Cyclic curve of the S235 steel grade. 3.12
3.11 Strain-life data obtained for the S355 steel grade: a) elastic strain– life data; b) plastic strain–life data; c) total strain–life data.
3.13
3.12 Strain-life data for the S235 steel grade: a) elastic strain–life data; b) plastic strain–life data; c) total strain–life data.
3.15
3.13 Comparison of the cyclic curves obtained for the S235 and S355 steel grades.
3.16
3.14 Comparison of strain-life data between S235, S355 and S690 steel grades: a) elastic strain–life data; b) plastic strain–life data; c) total strain–life data.
3.17
3.15 Experimental setup used for fatigue crack growth testing: a) crack tip measurement using optical microscopes inspecting both surfaces of the CT specimen; b) crack tip measurement using both optical microscope and DIC inspecting opposite surfaces of the CT specimen; c) setup overview for mixed mode fatigue crack growth testing.
3.21
3.16 CT specimens made of S355 structural steel: a) thickness of 4mm; a) thickness of 8mm.
3.21
3.17 Experimental fatigue crack propagation rates obtained for the S355 steel grade, with a thickness of 4 mm and correlated using the Paris
law: a) R=0.01; b) R=0.5; c) stress ratio effects; d) global
correlation with the Paris relation.
3.23
3.18 Experimental fatigue crack propagation rates obtained for the S355 steel grade, with a thickness of 8mm and correlated using the Paris
law: a) R=0.01; b) R=0.5; c) stress ratio effects; d) global
correlation with Paris relation.
3.25
3.19 Experimental fatigue crack propagation rates for the S355 steel grade: a) thickness effects; b) global Paris correlation; c) global Walker correlation.
specimens; d) photo of modified CT specimens.
3.21 Pure mode I fatigue crack propagation rates obtained for the S235
steel and correlations with Paris relation: a) R=0.01; b) R=0.5; c)
stress ratio effects; d) global correlation with the Paris relation.
3.30
3.22 Correlation of pure mode I fatigue crack propagation rate using the Walker relation.
3.31
3.23 Schematic representation of the variation of relative position between adjacent subsets: a) subsets grid; b) adjacent subset displacements.
3.34
3.24 Speckle pattern applied to one face of the modified CT specimen. 3.35
3.25 A(x,y) map for the cracked S235_I+II_01_01 specimen at distinct stages of the crack propagation: a) for measurement stage 20; b) for measurement stage 40.
3.36
3.26 A(x,y) map for the cracked S235_I+II_01_01 specimen with the application of the threshold: a) for measurement stage 20; b) for measurement stage 40.
3.36
3.27 Comparison of assessed crack paths for S235_I+II_01_01 specimen: a) evolution of the X coordinate of the crack tip; b) evolution of the Y coordinate of the crack tip; c) crack path.
3.37
3.28 Comparison of assessed crack paths for S235_I+II_01_02 specimen: a) evolution of the X coordinate of the crack tip b) evolution of the Y coordinate of the crack tip; c) crack path.
3.38
3.29 Comparison of assessed crack paths for S235_I+II_01_03 specimen: a) evolution of the X coordinate of the crack tip b) evolution of the Y coordinate of the crack tip; c) crack path.
3.40
3.30 Comparison of assessed crack paths for S235_I+II_01_04 specimen: a) evolution of the X coordinate of the crack tip b) evolution of the Y coordinate of the crack tip; c) crack path.
3.41
3.31 Comparison of crack paths evaluated from direct optical measurements, DIC computation and from polynomial and exponential fittings of DIC results: a) S235_I+II_01_01; b) S235_I+II_01_02; c) S235_I+II_01_03 and d) S235_I+II_01_04.
3.42
specimens; b) S235_I+II_01_03 specimen; c) S235_I+II_01_04 and S235_I+II_01_05 specimens.
3.34 Nomenclature for Virtual Crack Closure Technique applied to 8-noded plane finite elements.
3.51
3.35 Comparison of equivalent stress intensity factor range evolutions with the fatigue crack size: a) S235_I+II_01_01; b) S235_I+II_01_02; c) S235_I+II_01_03; d) S235_I+II_01_04.
3.54
3.36 Mixed mode fatigue crack propagation rates measured for the S235
steel grade: combine pure mode I (R=0) and Mixed mode fatigue
crack growth rate data.
3.56
3.37 Comparison of pure mode I fatigue crack propagation rates for several structural steels.
3.57
3.38 Fracture surfaces of CT specimens tested under pure mode I fatigue loading, obtained from SEM: a) S355, 5000x magnification; b) S235, 5000x magnification; c) S355, 1000x magnification; d) S235, 1000x magnification.
3.58
4.1 Location of the potential fatigue critical node in the riveted Trezói railway bridge.
4.4
4.2 Actual photo of the potential fatigue critical structural node of the Trezói railway bridge (node 6).
4.4
4.3 Down-scale riveted specimen, R1 series. 4.5
4.4 Down-scale riveted specimen geometry (R1 series). 4.6
4.5 Riveted down-scale specimen mounted in a rigid frame and 10 tons servo-hydraulic actuator.
4.8
4.6 Instrumentation of the riveted beams with strain gauges placed along the beam longitudinal direction, at remote position (flange of the beam) (CEA-06-250UW-350) and at local position in between the two top most rivets (CEA-06-062UW-350).
4.9
4.7 Single line double shear riveted splices (R2 series), instrumented with strain gauges: 9 specimens with remote strain gauges (CEA-06-250UW-350) and 4 specimens with strain gauges placed in between first and second rivet (CEA-06-062UW-350).
c) instrumentation of the specimen with strain gauges (3 specimens instrumented; remote strain gauge (1) (CEA-06-250UW-350) and local strain gauges (2), (3) and (4) (CEA-06-062UW-350).
4.9 Servo-hydraulic machines used in the fatigue tests of the R2 and R3 riveted series: a) 10 tons Instron testing machine used in the R2 specimens; b) 25 tons MTS machine used in the R3 specimens.
4.10
4.10 Hardness measurement locations assessed on a cross section of a R2 riveted specimen.
4.13
4.11 Hardness values on a cross section of a R2 riveted specimen. 4.14
4.12 Micrograph of the rivet/plate interface: rivet and plate (S235) microstructures.
4.14
4.13 S-N curves of riveted specimens: R1 series. 4.18
4.14 S-N curves of riveted specimens: R2 series. 4.18
4.15 S-N curves of riveted specimens: R3 series. 4.18
4.16 Typical failure modes of riveted specimens of R1 series: a) fatigue cracks propagated from riveted holes; b) fatigue crack propagated from corner of angles.
4.19
4.17 Typical failure surfaces of riveted tested series: a) R2 series; b) R3 series.
4.20
4.18 Fatigue striations representative of the fracture surfaces of R2 riveted specimens observed with SEM (magnification 5000 x).
4.21
4.19 Fatigue striations representative of the fracture surfaces of R2 riveted specimens observed with SEM (magnification 10000 x).
4.21
4.20 Fatigue striations representative of the fracture surfaces of R2 riveted specimens observed with SEM (magnification 30000 x).
4.22
4.21 Comparison of experimental S-N data of all tested riveted series. 4.24
4.22 S-N curves for R1 and R3 series jointed tested data. 4.25
4.23 S-N curves of jointed riveted test data. 4.25
4.24 Typical strain measurements for riveted specimens: a) R1 series; b) R2 series; c) R3 series.
4.26 Experimental S-N data for riveted joints from several sources. 4.31
4.27 Alcácer do Sal bridge box girder: a) inside view with reinforcing diaphragms; b) local view of the connection between the diagonal and the hanger gusset; c) welded connection investigated between the gusset the diagonal
4.33
4.28 Welded specimens designed according actual geometry used in the Alcácer do Sal bridge.
4.34
4.29 Welded specimens designed according to EC3 [1]. 4.34
4.30 Welded specimens geometries for laboratory fatigue tests: a) same weld configuration of the bridge detail and a 5 mm thickness (W1 series); b) weld configuration according to EC3 and a 5 mm thickness (W2 series); c) same weld configuration of the bridge detail and a 12 mm thickness (W3 series); d) weld configuration according to EC3 and a 12 mm thickness (W4 series).
4.38
4.31 Hardness measurements performed in a W3 welded specimens. 4.40
4.32 Hardness values in the W3 welded specimens. 4.41
4.33 Hardness measurements performed in a W1 welded specimen. 4.41
4.34 Hardness values in the W1 welded specimens. 4.42
4.35 Microstructures of the steel: a)microstructure of the BM zone; b)
microstructure of the weld toe (10x); c) microstructure of the weld toe (20x);d) microstructure of the weld toe (50x).
4.43
4.36 Experimental S-N curves of W1 welded series, using remote stress definition.
4.44
4.37 Experimental S-N curves of W2 welded series, using remote stress definition.
4.45
4.38 Experimental S-N curves of W3 welded series, using remote stress definition.
4.45
4.39 Experimental S-N curves of W4 welded series, using remote stress definition.
4.46
4.40 Experimental S-N curves of W1 welded series, using net stress definition.
4.42 Experimental S-N curves of W3 welded series, using net stress definition.
4.48
4.43 Experimental S-N curves of W4 welded series, using net stress definition.
4.49
4.44 Comparison of S-N curves for welded series W1 and W2 (thin plate thickness of 5 mm).
4.51
4.45 Comparison of S-N curves for welded series W3 and W4 (thin plate thickness of 12 mm).
4.51
4.46 Experimental S-N data for W1 and W3 welded series joined together. 4.52
4.47 Experimental S-N data for W2 and W4 welded series joined together.
4.53
4.48 Experimental S-N data for welded series with the thinner plate of 5mm thick (W1 and W2).
4.55
4.49 Experimental S-N data for welded series with the thinner plate of 12mm thick (W3 and W4).
4.56
4.50 Comparison of experimental S-N data of all welded specimens with EC3 class 45 S-N curve using the net stress definition.
4.57
4.51 Fracture surfaces of welded specimens (W3 specimen). 4.58
4.52 Fatigue crack striations observed with a Scan Electron Microscopy (SEM) on fracture surface of W3 welded specimens (magnification: 50 000x).
4.58
4.53 Fatigue crack striations observed with a SEM on fracture surface of a W3 welded specimen (magnification: 100 000 x).
4.59
4.54 Experimental stress field computation using DIC on W1-05 welded specimen: a) speckled specimen surface and strain gauge location defined by a dashed rectangle; b) computed x stress field (MPa); c) overlapping of figures (a) and (b).
4.60
4.55 Comparison of x strain evolution given by both strain gauge and DIC measurements (W1-05 welded specimen).
defined by a dashed rectangle; b) computed x stress field (MPa); c) overlapping of figures (a) and (b).
4.57 Comparison of x strain evolution given by both strain gauge and DIC measurements (W1-07 welded specimen).
4.62
4.58 Experimental stress field computation using DIC on W2-02 welded specimen: a) speckled specimen surface and strain gauge location defined by a dashed rectangle; b) computed x stress field (MPa); c) overlapping of figures (a) and (b).
4.63
4.59 Comparison of x strain evolution given by both strain gauge and DIC measurements (W2-02 welded specimen).
4.63
4.60 Experimental stress field computation using DIC on W2-05 welded specimen: a) speckled specimen surface and strain gauge location defined by a dashed rectangle; b) computed x stress field (MPa); c) overlapping of figures (a) and (b).
4.64
4.61 Comparison of x strain evolution given by both strain gauge and DIC measurements (W2-05 welded specimen).
4.64
4.62 Structural stress computation using DIC (W1-05) (F=22.5 kN). 4.66
4.63 Structural stress computation using DIC (W1-07) (F=50 kN). 4.67
4.64 Structural stress computation using DIC (W2-02) (F=85 kN). 4.67
4.65 Structural stress computation using DIC (W2-05) (F=25 kN). 4.68
5.1 Through thickness stress linearization. 5.4
5.2 Structural stresses definition for through-thickness fatigue crack: a)
local through-thickness normal and shear stress at weld toe; b) structural stress definition at weld toe.
5.5
5.3 Structural stresses calculation procedure for through-thickness
fatigue crack.
5.7
5.4 Fracture mechanics interpretation of the structural stress. Fatigue
damage interpreted as a fatigue crack propagation process.
5.8
5.5 Comparison of fatigue crack propagation data resulting from various
fatigue tests: a) data presented without Mkn effect; b) data represented using Mkn effect with n=2.
5.11
5.8 Local notch and structural stresses (stress concentration factors) computed using distinct finite element sizes (verification example 1).
5.14
5.9 Verification example 2: 2D bending problem. 5.16
5.10 Local notch and structural stresses (stress concentration factors) computed using distinct finite element mesh sizes (verification example 2).
5.16
5.11 Through stress Stress evolution: a) normal stress (x); b) shear stress
(xy).
5.16
5.12 Finite element meshes simulated for verification example 3: a) mesh 1; b) mesh 2; c) mesh 3; d) mesh 4; e) mesh 5; f) mesh 6 (elements with cubic shape).
5.18
5.13 Local notch and structural stresses (stress concentration factors) computed using distinct finite element sizes (verification example 3).
5.19
5.14 Crack path definition based on experimental observation for W1 and W3 welded specimens.
5.20
5.15 Crack path definition based on experimental observation for W2 and W4 welded specimens.
5.21
5.16 Finite element meshes used to model the W1 and W3 welded specimens: a) coarse mesh (element size equal to plate thickness); b) intermediate mesh (element size equal to 1/4 of the plate thickness); c) finer mesh (element size equal to 1/8 of the plate thickness).
5.22
5.17 Finite element meshes used to model the W2 and W4 welded specimens: a) coarse mesh (element size equal to plate thickness); b) intermediate mesh (element size equal to 1/4 of the plate thickness); c) finer mesh (element size equal to 1/8 of the plate thickness).
5.22
5.18 Membrane stress assessment using nodal forces approach and stress integration procedure for: a) W1 welded specimen; b) W2 welded specimen; c) W3 welded specimen and d) W4 welded specimen (1MPa applied remotely in the thicker plate).
5.23
5.19 Bending stress assessment using nodal forces approach and through thickness stress integration approach procedure for: a) W1 welded specimen; b) W2 welded specimen; c) W3 welded specimen and d) W4 welded specimen (1MPa applied remotely in the thicker plate).
stress (1MPa applied remotely in the thicker plate).
5.21 Stress concentration factors resulting from the ratio between the equivalent structural stress computations, based on Equation (5.18), and the remote uniform applied stress.
5.28
5.22 Experimental S-N curves assessed using through thickness structural stress procedure for welded specimens: a) W1; b) W2; c) W3 and d) W4.
5.29
5.23 Experimental S-N curve assessed using nodal forces assessment for welded specimens: a) W1; b) W2; c) W3 and d) W4.
5.30
5.24 S-N master curve assessed using through thickness structural stress procedure of welded specimens.
5.32
5.25 S-N master curve assessed using nodal forces data, for all welded specimens fatigue tested.
5.33
5.26 S-N master curve resulting from literature data and the welded fatigue data from this work: S-N master curve validation using through thickness stress integration approach.
5.34
5.27 S-N master curve resulting from literature data and the welded fatigue data from this work: S-N master curve validation using nodal forces approach.
5.34
6.1 Three pure crack loading modes: a) mode I; b) mode II and c) mode
III.
6.6
6.2 A three-dimensional coordinate system describing the stresses near
the crack front.
6.6
6.3 Contour Integral definitions: a) 2D contour integral (open contour);
b) 2D closed contour integral.
6.8
6.4 A three-dimensional coordinate system (a) used to define the 3D
domain integral at the crack front (b).
6.9
6.5 Virtual Crack Closure Technique. Nomenclature for the computation
of the energy release rate at corner nodes of a 20-noded solid mesh.
6.14
6.6 Virtual Crack Closure Technique. Nomenclature for the computation
of the energy release rate at mid-side nodes of a 20-noded solid mesh.
6.8 Evaluation of the Heaviside function. 6.17
6.9 Level set functions used for crack definition (crack path and crack
tip).
6.19
6.10 Standard, enriched and blending elements in a XFEM domain discretization.
6.20
6.11 Summary of the proposed simulations for each verification example, for stress intensity factors computation.
6.21
6.12 Contours used in the computation of the stress intensity factors with the XFEM approach.
6.22
6.13 Central through-thickness crack located in a finite plate. 6.23
6.14 Finite element meshes for the verification example 1: a) coarse FE mesh; b) intermediate FE mesh; c) fine FE mesh.
6.23
6.15 Examples of enriched finite elements area used in the computation of the stress intensity factors with the XFEM approach, for verification example 1: a) coarse FE mesh; b) fine FE mesh.
6.24
6.16 Ratio between the numerical stress intensity factor and analytical stress intensity factor versus the crack length computed for the mesh 1 (verification example 1): a) FEM analysis; b) XFEM analysis.
6.26
6.17 Ratio between the numerical stress intensity factor and analytical stress intensity factor versus the crack length computed for the mesh 2 (verification example 1): a) FEM analysis; b) XFEM analysis.
6.27
6.18 Ratio between the numerical stress intensity factor and analytical stress intensity factor versus the crack length computed for the mesh 3 (verification example 1): a) FEM analysis; b) XFEM analysis.
6.28
6.19 Ratio between the numerical stress intensity factor and analytical stress intensity factor versus the crack length computed for the mesh 4 (verification example 1): a) FEM analysis; b) XFEM analysis.
6.29
6.20 Single edge notched bending specimen. 6.30
6.21 Finite element mesh sensitivity analysis (FEM): a) coarse FE mesh; b) intermediate FE mesh; c) fine FE mesh.
6.30
1 (verification example 2): a) FEM analysis; b) XFEM analysis.
6.24 Ratio between the numerical stress intensity factor and analytical stress intensity factor versus the crack length computed for the mesh 2 (verification example 2): a) FEM analysis; b) XFEM analysis.
6.33
6.25 Ratio between the numerical stress intensity factor and analytical stress intensity factor versus the crack length computed for the mesh 3 (verification example 2): a) FEM analysis; b) XFEM analysis.
6.34
6.26 Ratio between the numerical stress intensity factor and analytical stress intensity factor versus the crack length computed for the mesh 4 (verification example 2): a) FEM analysis; b) XFEM analysis.
6.35
6.27 FE models of welded specimens obtained using ANSYS® and y
stress field illustration for an arbitrary crack: a) W1 series; b) W2 series; c) W3 series; d) W4 series. FE models of welded specimens
obtained using ANSYS® and
y stress field illustration for an
arbitrary crack: a) W1 series; b) W2 series; c) W3 series; d) W4 series.
6.37
6.28 W1 welded specimen modelled using 3D XFEM: a) overview of the welded specimen finite element mesh; b) detail of the enriched finite
elements; c) illustration of yy stress field for an arbitrary crack; d)
level set function; e) level set function.
6.38
6.29 Stress intensity factors range computed using FEM/VCCT and XFEM approaches: a) W1 welded specimens loaded at 50kN; b) W2 welded specimens loaded at 25kN; c) W3 welded specimens loaded at 50kN; d) W4 welded specimens loaded at 75kN.
6.40
6.30 Comparison between experimental S-N data and numerical S-N curves computed using FEM/VCCT and XFEM analysis: a) W1 series; b) W2 series; c) W3 series; d) W4 series.
6.42
6.31 Finite element model for the R1 specimen with a crack emanating from the upper most rivet hole: a) global finite element mesh; b) local finite element mesh; c) Von Mises stress field for a particular crack size.
6.48
6.32 Finite element model for the R1 riveted specimen with crack propagating at the angle corner): a) finite element mesh of the
angle; b) illustration of x stress field for a particular crack; c) detail
of the x stress field.
mesh and XFEM crack location; c) z stress field
6.34 Finite element model of the R2 riveted specimen: a) global finite
element mesh; b) local finite element mesh; c) y stress field for a
particular fatigue crack.
6.51
6.35 Finite element model for the R3 riveted specimen. 6.52
6.36 Comparison between R1 riveted specimen experimental S-N curve with numerical results of the model with a crack propagating at the web, from a rivet hole.
6.54
6.37 Comparison between R1 riveted specimen experimental S-N curve and the numerical results obtained with the FEM model and XFEM with a crack at angle corner.
6.55
6.38 Normal stress range evolution at the net section of the angle: a) applied load of 18kN; b) applied load of 25kN.
6.55
6.39 Effective stress intensity factor evolution computed using FEM and VCCT, and XFEM and contour integral method of a propagating
crack at the angle corner (P=18 kN).
6.56
6.40 Comparison between R2 riveted specimen experimental curve with the R2 specimen numerical model: a) Clamping stress of 30MPa; b) Clamping stress of 80MPa.
6.57
6.41 Comparison between R3 riveted specimen experimental curve with the R3 specimen numerical model: a) Clamping stress of 30MPa; b) Clamping stress of 80MPa.
6.58
7.1 Bannantine and Socie methodology [5]. 7.7
7.2 Location of the potential critical node of the Trezói bridge to be
fatigue assessed using a detailed local model.
7.9
7.3 Potential critical node (node 6): actual photograph. 7.9
7.4 Geometry and dimensions of node 6 of the Trezói bridge. 7.10
7.5 Local finite element models: continuous model. 7.11
7.6 Local finite element model: combined riveted and continuous model. 7.12
7.7 Cross sections of the local models where boundary conditions were
applied.
7.9 Displacements histories at sections 1 to 9 of node 6 from Trezói bridge.
7.14
7.10 Rotations histories at sections 1 to 9 of node 6 from Trezói bridge 7.15
7.11 Verification of the multiaxiality of the stress-time history: a) principal stresses evolution; b) direction cosines of the first principal stress direction.
7.16
7.12 Selected node for the verification of the multiaxiality of the stress-time history (full continuous model).
7.17
7.13 Location of strain gauges used to monitor the strains at the node 6 of the bridge model.
7.19
7.14 Experimental vs numerical stress measurements at locations illustrated in Figure 7.13.
7.20
7.15 Damage computed at each surface FE node of the local continuous model, for each passenger train crossing, using the Von Mises equivalent stress criterion.
7.20
7.16 Von Mises stress distribution (continuous model) (step 10). 7.21
7.17 Angular coordinates defining an arbitrary plane thru its normal. 7.22
7.18 Critical plane assessment for the node located at location 1 (continuous FEM model): a) BS approach; b) FS approach; c) SWT approach; d) Findley approach and e) modified Findley approach.
7.24
7.19 Critical plane assessment for the node located at location 2 (continuous FEM model): a) BS approach; b) FS approach; c) SWT approach; d) Findley approach and e) modified Findley approach.
7.26
7.20 Critical plane assessment for the node located at location 3 (continuous FEM model): a) BS approach; b) FS approach; c) SWT approach; d) Findley approach and e) modified Findley approach.
7.28
7.21 Fatigue damage computed at each surface FE node of the local combined continuous/riveted model, for each passenger train crossing.
7.31
7.22 Von Mises stress distribution (combined continuous/riveted model) (step 10): a) local model overview; b) detail of riveted cross girder with some highlighted hot spot locations at rivet holes.
approach; c) SWT approach; d) Findley approach and e) modified Findley approach.
7.24 Critical plane fatigue damage assessment for the location 2 (combined continuous/riveted model): a) BS approach; b) FS approach; c) SWT approach; d) Findley approach and e) modified Findley approach.
7.34
7.25 Critical plane fatigue damage assessment for the location 3 (combined continuous/riveted model): a) BS approach; b) FS approach; c) SWT approach; d) Findley approach and e) modified Findley approach.
7.36
8.1 Workflow of the proposed analysis: pre-processing of the input data
(1st step).
8.10
8.2 Workflow of the proposed analysis: crack propagation simulation
(2nd step).
8.11
8.3 New Alcácer do Sal railway bridge. 8.13
8.4 Location of diaphragms 51 and 54 on bridge. 8.13
8.5 Location of strain gauges at diaphragm 51: a) global and local strain
gauges locations; b) detail of local strain locations.
8.14
8.6 Some details of the global numerical modal of the bridge: a) deck,
hangers and arch; b) diaphragm 51 and corresponding diagonals
8.16
8.7 Local finite element model of the welded joint of the Alcácer do Sal
bridge
8.17
8.8 Shell-to-solid sub-modelling, location of the local FE model with
respect the shell model: a) front view; b) side view; c) top view.
8.17
8.9 Experimental vs. numerical strain measurements: a) strain gauge 1;
b) strain gauge 2; c) strain gauge 3; d) strain gauge 4; e) strain gauge 5.
8.20
8.10 Fatigue crack initiation spot: a) numerical simulation of real detail; b) experimental evidence from fatigue tests of small-scale fatigue tests
8.21
8.11 Figure 8.11 – VCCT vs. DE: a) KI; b) KII. 8.22
8.14 Characteristics of simulated trains: a) Trains loads per unit length: b) Trains speeds; c) Trains lengths.
8.24
8.15 Crack propagation length as a function of cumulative traffic for current traffic volumes.
8.25
8.16 Comparison of crack propagation for distinct traffic scenarios. 8.26
L
IST OF
T
ABLES
3.1 Fatigue experimental program of smooth plane specimens made of
S355 steel.
3.6
3.2 Fatigue experimental program of smooth plane specimens made of
S235 steel.
3.10
3.3 Summary of cyclic elastoplastic and fatigue properties for structural
steels.
3.18
3.4 Overview of fatigue crack growth testing adopted for the S355 steel. 3.22
3.5 Overview of fatigue crack growth testing adopted for the S235 steel. 3.28
4.1 Comparison between the structural node of the Trezói Bridge and the
suggested riveted down-scale simplified specimens.
4.8
4.2 Chemical composition of the S235JR steel and rivet material used in
the fabrication of the riveted specimens (% weight).
4.11
4.3 Tensile properties of the S235JR steel and rivet material used in the
fabrication of the riveted specimens.
4.11
4.4 Experimental fatigue test data of R1 riveted specimens. 4.11
4.5 Experimental fatigue test data of R2 riveted specimens. 4.12
4.6 Experimental fatigue test data of R3 riveted specimens. 4.12
4.7 Summary of linear regression data for each tested riveted series. 4.22
4.8 Confidence intervals for regression parameters A and B given in Table
4.7.
4.23
4.9 Summary of linear regression data for joint data from R1 and R3
series.
4.26
4.10 Confidence intervals for S-N curve parameters resulting from R1 and R3 series joint test data.
4.12 Confidence intervals for S-N curve parameters resulting from all joint test data.
4.26
4.13 Riveted connection categorization proposed by Taras & Greiner [4]. 4.30
4.14 S-N curves constants, referring to experimental data presented in Figure 4.25.
4.31
4.15 Summary of linear regression parameters for S-N data of riveted joints from several sources illustrated in Figures 4.25 and 4.26.
4.32
4.16 Confidence intervals for S-N curve parameters resulting from all joint test data shown in Figures 4.25 and 4.26.
4.32
4.17 Fillet weld lap joint configuration and respective strength according to the EC3.
4.33
4.18 Welding procedure specifications. 4.35
4.19 Experimental data of the fatigue tests of W1 welded specimens. 4.36
4.20 Experimental data of the fatigue tests of W2 welded specimens. 4.36
4.21 Experimental data of the fatigue tests of W3 welded specimens. 4.37
4.22 Experimental data of the fatigue tests of W4 welded specimens. 4.37
4.23 Chemical composition of S355J2+N steel, S355NL1 and welded material (% weight).
4.39
4.24 Tensile strength properties of the S355 and welded materials. 4.39
4.25 Summary of linear regression parameters for all welded series (using of remote stresses).
4.46
4.26 Confidence intervals for regression parameters A and B given in Table 4.25.
4.47
4.27 Summary of linear regression parameters for all welded series (using of net stresses).
4.49
4.28 Confidence intervals for regression parameters A and B given in Table 4.27.
4.50
4.29 Summary of linear regression parameters resulting from W1 and W3 welded data analyzed together.
4.31 Summary of linear regression parameters resulting from W2 and W4 welded data analyzed together.
4.54
4.32 Confidence intervals for regression parameters A and B given in Table 4.31.
4.54
4.33 Summary of linear regression parameters resulting from W1 and W2 welded data analyzed together (5 mm thick plates).
4.55
4.34 Confidence intervals for regression parameters A and B given in Table 4.33.
4.55
4.35 Summary of linear regression parameters resulting from W3 and W4 welded data analyzed together (12 mm thick plates).
4.56
4.36 Confidence intervals for regression parameters A and B given in Table 4.35.
4.57
5.1 Finite element details for the verification example 1. 5.13
5.2 Stress range values at 2E6 cycles. 5.32
6.1 Finite element refinement used for the verification example 1 (FEM
approach).
6.24
6.2 Finite element refinement used for the verification example 1 (FEM
approach).
6.25
6.3 Finite element size used for the verification example 2 using XFEM
approach.
6.32
6.4 Paris law material constant for the S355 steel considering
thicknesses of 4mm and 8mm (R=0.01).
6.39
6.5 Constants of the strain-life Morrow relation for S235 steel. 6.44
6.6 Constants of the Paris equation for S235 steel. 6.44
7.1 Fatemi and Socie model constants [8]. 7.22
7.2 Findley model constants [8]. 7.22
7.3 Summary of the number of passenger train crossings until failure,
computed using several fatigue assessment models, based on a continuous finite element model.
combined continuous/riveted finite element model.
8.1 Adopted fracture mechanics and fatigue parameters for the fatigue
analysis performed using the welded model of the Alcácer do Sal bridge.
N
OMENCLATURE
Latin
a Fatigue crack size
B Pre-logarithmic energy factor
b Fatigue strength exponent
bγ torsional cyclic fatigue strength exponent
C Paris law’s coeficient
c Fatigue ductility exponent
D Fatigue damage
D Damping matrix
da
dN Fatigue crack growth rate
dA Infinitesimal area segment
E Young modolus
Fmax Maximum load in a load range
Fmin Minimum load in a load range
f Body force per volume unit
j
f Modal forces, for the jth mode of vibration
G Elastic shear modulus
J Energy release rate calculated with respect to a finite segment
tot
J Total J-integral
K Stiffness matrix
K’ Cyclic strain hardening coefficient
I
K Mode I stress intensity factor
II
K Mode II stress intensity factor
KIc. Material toughness
Keq Equivalent stress intensity factor
k Number of specimens for statically analysis
kt Elastic stress concentration factor
M Mass matrix
kn
M Magnification stress intensity factor parameter(S-N Master
Curve)
m Paris law’s exponent
n’ Cyclic strain hardening exponent
2Nf/ Nf Number of reversals to failure/ Number of cycles to failure
Rσ Stress ratio
R1 Riveted specimens (configuration 1)
R2 Riveted specimens (configuration 2)
R3 Riveted specimens (configuration 3)
Rp Yield stress
Rm Rupture stress
R Rigid body rotation
S2 Variance
S Standard deviation
t Thickness
W Width of the Compact Tension specimens
W1 Welded specimens 1 (configuration 1)
W2 Welded specimens 2 (configuration 2)
W3 Welded specimens 3 (configuration 3)
W4 Welded specimens 4 (configuration 4)
X Mean value of the independent variable X
Y Mean value of the independent variable Y
j
Y , Y tj
( )
Modal coordinate, modal coordinates time historiestr Reference length of the final crack depth at failure (S-N Master
Curve)
Greek ´ f
ε Fatigue ductility coefficient
γ Material constant of the Walker model
μ Friction coefficient
ν Poisson ratio
,max
n
σ Maximum direct stress acting on the principal strain range plane
assessed during principal strain cycle counting procedure
σb Bending stress component for structural stress computation
´ f
σ Fatigue strength coefficient
σm Membrane stress component for structural stress computation
τm Transverse shear component for structural stress computation
ΔF Load range
th
K
Δ Crack propagation threshold stress intensity factor range
s S
Δ Equivalent structural stress range
γ
Δ Shear strain range
ε
Δ Total strain range
ε
Δ 1 Maximum principal strain range
ε
Δ E Elastic strain range
ε
Δ P Plastic strain range
loc
ε
Δ Local strain range
σ
Δ
Stress ranges
σ
Δ Structural stress range
loc
σ
Δ Local stress range
nom
σ
Δ Nominal stress range
j
ξ Modal damping ratio
'
fτ
Torsional cyclic fatigue strength coefficient)
(x
φ
Normal level set function)
(x
ϕ
Tangential level set functionj
ω Natural frequency
ACRONYMS
AASHTO American Association of State Highway Traffic Officials
ANSYS Swanson Analysis Systems
BS Bannantine and Socie
CT Compact Tension
DIC Digital image correlation
DE Displacement Extrapolation method
EC3 Eurocode 3
EPFM Elastoplastic Fracture Mechanics
FADLESS Fatigue Damage Control and Assessment for Railways Bridges
FE Finite element
FS Fatemi and Socie
IDMEC Institute of Mechanical Engineering
IIW International Institute of Welding
LEFM Linear Elastic Fracture Mechanic
MCS Maximum Circumferential Stress criteria
MERR Maximum Energy Release Rate
MTS Maximum Tangential Stress criteria
SIF Stress intensity factor
SWT Smith-Watson-Topper
Chapter I
1.1. I
NTRODUCTIONBridges are very complex structures that are built to support dynamic loads resulting from traffic actions (e.g. cars, trucks, trains, etc). The action of the dynamic loads over these structures is responsible for their progressive damaging due to fatigue. This is a major concern of designers and owners of the structures since they need to guarantee significant operational safety levels in order to avoid catastrophic collapses with strong social and economic impact.
The awareness of fatigue behaviour of bridges did not appear with the construction of the first metallic riveted bridges at the end of XIX century. Only some decades ago, the fatigue design became a concern of engineers. This happened with the development of the first design rules that included a fatigue design section. Nowadays there is a full awareness for the need of a fatigue design of metallic bridges (e.g. bolted, welded, composite bridges) and design codes are strictly observed. The traffic intensity (e.g. axle loads, speed and frequency) on modern bridges is very high and with an increasing trend which requires constant attention in order to avoid fatigue cracks and in case they cannot be avoided, maintenance plans supported on residual life calculations need to be implemented.
Although fatigue modelling has suffered significant advances for mechanical engineering applications, the fatigue methodologies preconized in design codes for bridges have a very simple form, despite the enormous complexity of the generality of those structures. The question that may be advanced is why the state-of-the art fatigue models are not being explored for bridge fatigue assessment? One answer that could be formulated is the fact that the most advanced fatigue models are local models that recognize the local nature of the fatigue damage. The application of those local models to bridges is cumbersome since a multi-scale problem needs to be faced. A global model of the structure is required to account conveniently for the traffic loads, but local information (e.g. strains, stresses, stress intensity factors) at critical hot spots is also
required to provide the required input information to the fatigue models. The conciliation of these two scales of analyses is currently an open problem that requires significant contributions in other to allow the progress of current design code approaches which are based on global S-N approaches.
1.2. A
IM OF THE THESISThe main goal of the present dissertation was to develop advanced methodologies to be applied in the fatigue assessment of structural details from metallic bridges, including welded and riveted joints. Local models for the fatigue analysis were preferably followed in the proposed research, in alternative to traditional global S-N approaches, and strategies proposed to overcome the difficulties introduced by the multi-scale problem that this kind of fatigue models introduces.
The present research was performed within the framework of the FADLESS European project, entitled Fatigue Damage Control and Assessment for Railways Bridges [1]. This European project aimed at the development of methodologies for the assessment of the fatigue behaviour of critical details, to be demonstrated for several European railway bridges, selected as case studies. Regarding the Portuguese case studies, two railway bridges were selected, namely the Trezói Railway Bridge and the new Alcácer do Sal Railway Bridge (see Figure 1.1).
![Figure 1.6 - Overview of the bridge of the new railway crossing of the river Sado (adapted from [2])](https://thumb-eu.123doks.com/thumbv2/123dok_br/18906875.935931/54.892.116.752.766.1079/figure-overview-bridge-railway-crossing-river-sado-adapted.webp)
![Figure 2.5 – Stringer-to-cross-girder assembly tested by Al-Emrani [45] (dimensions in mm)](https://thumb-eu.123doks.com/thumbv2/123dok_br/18906875.935931/74.892.157.738.543.800/figure-stringer-cross-girder-assembly-tested-emrani-dimensions.webp)
![Figure 2.6 – Finite element model of a stringer-to-cross-girder assembly developed by Al-Emrani and Kliger [54]](https://thumb-eu.123doks.com/thumbv2/123dok_br/18906875.935931/77.892.300.619.109.411/figure-finite-element-stringer-assembly-developed-emrani-kliger.webp)
![Figure 2. 8 – Global-local FE models of a riveted bridge module proposed by Imam [58]](https://thumb-eu.123doks.com/thumbv2/123dok_br/18906875.935931/79.892.138.791.97.536/figure-global-local-models-riveted-bridge-module-proposed.webp)
![Figure 2.14 – Small ICOM specimens tested by Frýba [68]: a) specimen with circular cut-outs; b) specimens with cut-outs with apple form](https://thumb-eu.123doks.com/thumbv2/123dok_br/18906875.935931/83.892.307.613.750.1099/figure-small-specimens-tested-frýba-specimen-circular-specimens.webp)
![Figure 2.17 – Finite element model of a welded joint investigated by Xiao et al [73].](https://thumb-eu.123doks.com/thumbv2/123dok_br/18906875.935931/86.892.233.621.563.1050/figure-finite-element-model-welded-joint-investigated-xiao.webp)
![Figure 2.18 – Finite element models of an investigated welded joint by Heshmati [74].](https://thumb-eu.123doks.com/thumbv2/123dok_br/18906875.935931/88.892.116.741.138.399/figure-finite-element-models-investigated-welded-joint-heshmati.webp)