1876-6102 © 2016 The Authors. Published by Elsevier Ltd. This is an open access article under the CC BY-NC-ND license (http://creativecommons.org/licenses/by-nc-nd/4.0/).
Peer-review by the scientific conference committee of EEIC | CIEE 2016 under responsibility of Guest Editors. doi: 10.1016/j.egypro.2016.12.118
Energy Procedia 106 ( 2016 ) 225 – 234
ScienceDirect
1
stEnergy Economics Iberian Conference, EEIC | CIEE 2016, February 4-5, Lisbon,
Portugal, APEEN (www.apeen.org) and AEEE (www.aeee.es)
On the nexus of energy use - economic development: a panel
approach
António Cardoso Marques
1, José Alberto Fuinhas
1, Jorge dos Santos Gaspar
21NECE-UBI and 1,2 University of Beira Interior, Management and Economics Department, Rua Marquês D'Ávila e Bolama,
6200-001 Covilhã, Portugal, [email protected]
Abstract
Gross Domestic Product (GDP) is inefficient for evaluating sustainable development, and the most suitable indicator for this is the Index of Sustainable Economic Welfare (ISEW). This paper focuses on distinguishing the ISEW from GDP, mainly through the study of the energy consumption - economic growth nexus. The traditional hypotheses were tested using a Panel-Corrected Standard Errors estimator for twenty-two countries for the time span from 1995 to 2013. The findings show substantial differences between GDP and ISEW. This paper contributes to the discussion about the consequences of these two approaches for the design of suitable policies for a sustainable future.
© 2016 Published by Elsevier Ltd. Selection and/or peer-review under responsibility of [name organizer]
Keywords: Energy consumption; Economic growth; Economic development; ISEW; PCSE
1.Introduction
World population is increasing. It currently stands at 7.3 thousand million, and is expected to increase 1.5 thousand million by 2030. In view of this, the UN is naturally concerned with the use of the Earth’s resources and well-being, and has been promoting the sustainable development of countries, defined as "development that meets the needs of the present without compromising the ability of future generations to meet their own needs"[1]. This problem has been discussed more seriously, and there are several indices that measure social well-being, such as the Human Development Index (HDI) and Gross National Happiness (GNH). However, only the Index of Sustainability and Economic Welfare (ISEW) created by Daly and Cobb in 1989, is established in the literature and includes the use of natural resources by each
© 2016 The Authors. Published by Elsevier Ltd. This is an open access article under the CC BY-NC-ND license (http://creativecommons.org/licenses/by-nc-nd/4.0/).
country. In addition, it takes into account factors such as inequality in income distribution, exchange of goods/services and investment in health or education by the Government. All this makes the ISEW the best indicator for measuring sustainable development, because it considers practically all the elements necessary to achieve the goals set by the United Nations as essential for the future of our planet and the generations who will live on it. These concerns are ignored in calculating Gross Domestic Product, the economic growth proxy most used in scientific papers.
It is necessary to rethink the way we measure a country’s economic development so that it becomes seen as an indication of the well-being provided by a nation and its efforts to ensure the planet’s future. It is widely proven in the literature that a rise in energy consumption is related to economic growth. This used to be necessary for improving our lifestyle, but as pointed out in the 2015 UN Climate Change Conference, in the 21st century it is necessary to look at energy consumption in a sustainable way.
Following this line of thought, this paper compares the sustainable development proxy ISEW with the economic growth indicator GDP, and examines the relationship of these two variables with energy consumption. A first graphic comparison between ISEW and GDP was done, and demonstrated that the two variables diverge over the time span studied, which reinforces the initial idea that they might not be the ideal substitutes in analysing the nexus. The central question of this paper is: are the usual results of traditional energy-growth nexus (measured by GDP) valid when using a more suitable indicator for economic development, specifically the ISEW? Consequently, the paper’s main objectives are: (i) to assess the impact of energy consumption on sustainable development; (ii) to appraise the different effects on ISEW from renewable and non-renewable energies; (iii) to illustrate the differences between economic growth and sustainable development. For this purpose, annual data for twenty-two countries, covering the period from 1995 to 2013, was used. To achieve the main goals, micro econometric techniques were employed.
The results show the differences between using the ISEW and GDP to analyse the energy nexus. Energy produced by renewable sources is important to development as measured by the ISEW. However, one of the major drivers of GDP growth is the consumption of non-renewable energy sources, which makes the ISEW a better indicator to measure a country’s efforts to preserve the Planet.
The remainder of the paper is organised as follows. Section 2 presents a literature review on the ISEW and the energy consumption nexus. Section 3 describes the data and methodology used, and Section 4 shows the results. The interpretation of results is discussed in Section 5. Section 6 states the conclusion.
2.Literature Review
There is a lack of empirical studies analysing the nexus by focusing on development instead of economic growth, and few with comparisons of the ISEW and GDP [2]. The literature review to support this paper was divided into sections. The ISEW is in sub-section 2.1, while the relationship between energy consumption and economic growth is presented in sub-section 2.2, the determinants of economic growth in 2.3.1, and energy consumption in 2.3.2.
2.1.The Index of Sustainable Economic Welfare
As mentioned above, in comparison to others indicators, the ISEW is recent (since 1989) and arose from the need to evaluate the costs of economic activity on the well-being of societies. Increasing economic activity could imply future costs, costs that must be paid sooner or later. The payment of these costs are more likely to become accumulated over generations like debt [3]. So a share of production output must be used to offset the costs of economy activity, the so-called defensive costs. Only in this
way can the same maximum consumption of the current period be assured in a future, which is the main argument of the Hicks income definition [4].
The defensive costs taken into account in the ISEW construction (Table 1) are: income inequality from the Gini Index, the depletion of natural resources, gross capital consumption, and the cost due to the inefficiency of public education and health systems. These defensive costs are part of the ISEW construction standard, which decreases the arbitrariness of their choice. Such indicators as the cost of noise, crime, and divorce, or car accidents, are more unreliable than the standard statistics, therefore are not included. These kinds of indicators are usually calculated differently in each country, and are highly subjective. All the indicators used in constructing the ISEW are drawn from the World Bank and ILOSTAT, to eliminate calculation ambiguity (Table 1).
In the energy and mineral depletion calculation, the resource rent method [5] was used, taking into account that profit decreases as the life span of the resource declines, mostly because resources became more difficult to extract. As the forest is a natural resource that is relativity easy to replenish, its depletion is calculated from the difference between the profit from forest exploration and the cost of reforestation. The damage caused by CO2 emissions is evaluated at 20 euros per ton by the World Bank, including the social cost, which makes it higher than the market value.
Unpaid work is included in the ISEW to account for the welfare provided by unpaid domestic and volunteer work. The net capital growth is important to evaluate if countries are producing more capital than that which is consumed, and are thus able to satisfy their growing population with increasing needs. Private consumption measures society’s wellbeing through the available income of families, adjusted by the Gini Index, because the acquisition of more money by wealthy families creates less well-being than it does for poor families [3].
Table 1. ISEW components
Component Data Source Computation
Adjusted private consumption (+)
WDI Final household consumption expenditure * (1- GINI Index) Net capital growth (+/-) WDI Gross Capital Formation - Gross Capital Consumption Health expenditure (+) WDI Public health expenditure * 0,5
Education expenditure (+) WDI Public education expenditure * 0,5 Unpaid work (+) Number of unpaid workers- WDI
Minimum wage – ILOSTAT
Number of unpaid workers * Average wage
Mineral depletion (-) WDI Ratio of the value of the stock of mineral resources to the remaining lifetime reserve (capped at 25 years). It includes tin, gold, lead, zinc, iron, copper, nickel, silver, bauxite, and phosphate.
Net forest depletion (-) WDI Calculated as the product of unit resource rents and the excess of round wood harvest over natural growth.
Energy depletion (-) WDI Ratio of the value of the stock of energy resources to the remaining lifetime reserve (capped at 25 years). It includes coal, crude oil and natural gas.
Carbon dioxide damage (-) WDI Carbon dioxide damage is estimated to be $20 per ton of carbon (the unit damage in 1995 in U.S. dollars) times the number of tons of carbon emitted.
2.2. Energy-Growth nexus
The causality relationship between economic growth and energy consumption has been widely explored, mostly by testing four hypotheses [6]: (i) the feedback hypothesis, in which energy consumption causes economic growth and vice versa; (ii) the neutrality hypothesis, which assumes that energy consumption and economic growth are neutral in regards to each other, so that energy efficiency policies can be use without production decreasing; (iii) the growth hypothesis, which specifies a unidirectional relationship running from energy consumption to economic growth, therefore diminishing energy consumption negatively affects economic growth; and (iv) the conservation hypothesis, which states a unidirectional causality implying that an increase in production causes an increase in energy consumption, but that economic growth is not fully dependent on energy consumption.
2.3.Economic growth determinants
The principal factors used in our study, which could potentially cause economic growth are labour, trade openness, inflation, energy, natural resources exploration and investment. Due to lack of data, other factors like productivity and direct foreign investment were excluded from the study. Gross capital formation is an ISEW component and this precluded its use in the study. For trade openness, proxy imports per capita (IMPTPC) was used, which is widely proven to have a positive effect on growth, even in energy consumption studies [7]. A higher value of imports per capita means more openness of the economy leading to better use for a comparative advantage in trade.
The employment rate is used as a labour proxy (TXEMP). This variable is used in several energy nexus articles [8], [9]. All of these reach the same conclusion, i.e. a positive relation between employment and growth.
One of the most important determinants of economic growth is inflation, represented in this study through the Consumer Price Index (CPI). As is well known, inflation has a non-linear relation and is negative outside certain limits with Gross Domestic Product [10]. Energy influence in economic growth is tested using three variables: energy imports per capita (EIMPTP), renewable (REPC) and non-renewable energy (NREPC) consumption per capita.
Energy imports determine the effect of energy dependence on economic growth and sustainable development [11], so a negative impact on economic growth is expected. Dependence on another country makes controlling prices a difficult task, particularly if that country is politically or socially unstable.
Primary energy consumption is separated from renewable energy consumption per capita (solar, wind and biomass), and non-renewable energy consumption (oil, coal, gas) per capita. This was investigated in several studies, proving a feedback hypothesis between the two different sources of consumption and economic growth [12], [13]. When studies are carried out with renewable energy as the principal focus, the results are different. For example, there was a negative effect on GDP in Italy [14], but for a part of the countries studied there was a positive relation [15]. Thus, this relationship is unpredictable in the model that will be used for calculations in this paper.
Also tested in the study are the natural resource rents per capita (RENTSPC) from forests, oil, coal, and gas, allowing the valuation of the environmental impact for each country. A negative relation in ISEW and positive relation with GDP is expected, the last due to the monetary advantages. Part of the income is for consumption, the rest is for savings and investment. So savings per capita (SAVINGSPC) is used as a proxy for investment. Savings as a determinant for economic growth has been widely studied, showing a positive effect [16], [17].
2.4.Economic growth determinants
The principal primary energy consumption (ECOMPC) determinants seen in literature are the level of urbanization (URBAN), energy prices, GDP, the level of industrialization and, less frequently, energy security. Levels of urbanization and industrialization have been widely explored in energy studies with a consensual conclusion; they have a positive effect on energy consumption [7].
In this work, as pointed out previously, the consumer price index is used as a proxy for energy prices, as it is in other articles [18]. Energy imports are used as the energy security proxy [19]. We predict that greater dependence on energy imports will lead to additional research into energy efficiency policies and will also lead to a decrease in energy consumption. In contrast, the opposite is expected for energy produced from fossil sources (FPRODPC), since greater production causes less dependence on outside sources. The consumer price index (CPI) is computed as the energy price proxy, based on the fact that all product prices depend on energy prices [18].
3.Data and Methodology
Annual data was used, ranging from 1995 to 2013, for 22 countries around the world: Australia, Belgium, Brazil, Canada, Chile, Czech Republic, France, Hungary, Korea, Mexico, Netherlands, New Zealand, Poland, Portugal, Slovakia, United States of America, Colombia, Peru, Romania, Russia, Thailand and Ukraine. It was chosen taking into account the available data for the 12 indicators used to construct the ISEW (Table 1) and for the 13 other variables.
To re-examine the energy nexus, focusing on a sustainable approach, four models for panel data were produced (Table 2), taking into account the growth determinants that affect both economic growth and sustainable development simultaneously. For an assessment of the traditional nexus hypotheses, a pair-wise Granger Causality test was performed to detect the direction of causality as well as the bidirectional relationships. The causality test was used between energy consumption (LREPC, LNREPC) and economic progress variables (LISEW, LGDPPC), with economic growth determinants as endogenous variables. Causality between primary energy consumption was also checked.
Table 2. Description of Models
Description Dependent variable
Model I Sustainable development LISEWPC
Model II Economic growth LGDPPC
Model III Energy consumption approach in a sustainable way LECOMPC Model IV Energy consumption approach in a traditional way LECOMPC
All the variables are in natural logarithms to rescale the data and make the non-linear relations linear (L denotes natural logarithm before variable name). Data samples have been transformed into panel data form, which increases the number of observations, bringing higher viability to the study. Panel data can be performed under standard errors and residuals instability provided that the right estimators are chosen.
The Pesaran parametric test, the Friedman semi-parametric test and the Frees non-parametric test were carried out, all of them to random and fixed effects, in order to detect cross-section dependence. The Wooldridge test to identify serial correlation and the Wald modified test to recognize the group wise heteroscedasticity were also carried out.
4.Results
The energy-consumption nexus is analysed with panel data constituted by 22 countries. Due to the different characteristics of the countries different variations in economic growth are expected, which results in panel heteroscedasticity. Therefore, a modified Wald test was computed, where the null hypotheses is rejected, supporting the presence of heteroscedasticity. Panel data must be treated carefully, due the fact that they usually have complex error structures. Thus, the Wooldridge, Pesaran, Frees and Friedman tests were carried out, and in all of them the null hypothesis was rejected, leading to confirmation of the presence of contemporaneous autocorrelation and cross-section dependence in the panel under analysis.
Results from the specification tests demonstrate contemporaneous autocorrelation, group-wise heteroscedasticity, and cross-section dependence for all four models. Coupled with the fact that Feasible Generalized Least Squares(FGLS) is appropriate for panels with T>N and the panel is constituted by 22 countries and 19 years, the Panel-Corrected Standard Error (PCSE) is the most suitable estimator. In this way, four assumptions were tested for this estimator: one with first-order autocorrelation and a specific coefficient AR (1) which is different for each country (Psar1); one with first-order autocorrelation but the same AR (1) coefficient for all countries (AR1); an independent (Ind) with unspecified autocorrelation but correlation over countries; and one with AR (1) common to all countries, and they resulted in heteroscedasticity level errors (Normal).
Model I (Table 3) shows the effects of economic growth determinants on LISEWPC. Thus it can be seen how traditional growth factors affect sustainable development.
Table 3 Model I - Sustainable development
Model I show robustness with almost all variables except for LEIMPTPC, not significant in AR1 and Psar1 estimators. Model II (Table 4) was computed to understand the variations in economic growth in the time span considered. It also demonstrates the differences between effects on economic growth and sustainable development from the same determinants.
Independent variables OLS PCSE
Normal Psar1 AR1 Ind
LTXEMP 0.0873*** 0.0873*** 0.1660*** 0.1403*** 0.0873*** LNREPC -0.2894*** -0.2894*** -0.3097*** -0.2367*** -0.2894*** LREPC 0.0306** 0.0306*** 0.0221*** 0.0208** 0.0306** LCPI -1.0445*** -1.0445*** -0.9250*** -0.9587*** -1.0445*** LRENTSPC -0.0465*** -0.0465*** -0.0226*** -0.0291*** -0.0465*** LIMPTPC 0.1262** 0.1262*** 0.2607*** 0.2101*** 0.1262*** LSAVINGSPC 0.7461*** 0.7461*** 0.6782*** 0.6659*** 0.7461*** LEIMPTPC -0.0610* -0.0610*** -0.0161 -0.0203 -0.0610*** CONS 4.3041*** 4.3041*** 2.0028 3.7260*** 4.3041*** N 418 418 418 418 418 R2 0.7627 0.7627 0.9915 0.9677 0.7627
Table 4: Model II – Economic growth
Table 4 shows that only LRENTSPC are not statistically significant and it is kept in the table to reveal the differences with model I. LNREPC is not statistically significant with the Psar1 estimator, but significant with others. All the other variables are significant at 1% level, which show that model II is robust. Model III (Table 5) shows how energy consumption determinants affect this, mainly the
LISEWPC.
Table 5: Model III - Energy consumption approached in a sustainable way
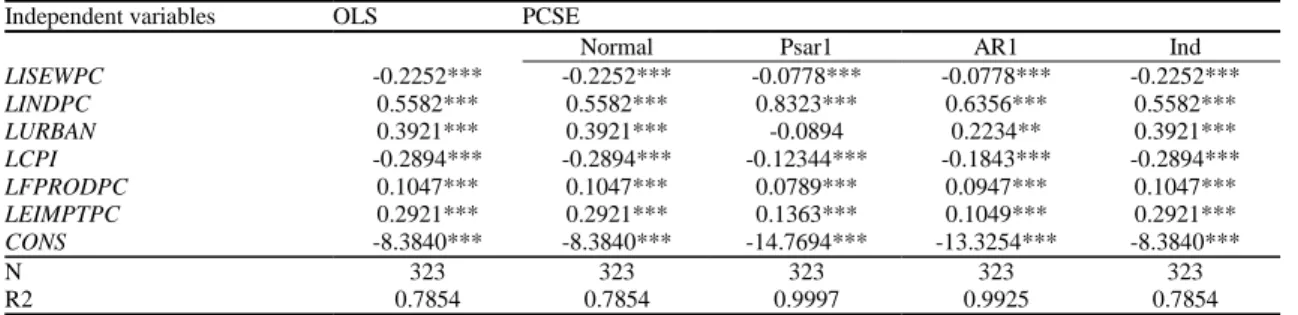
Model III is robust with almost all variables, except LURBAN, which is statistically significant at 1% level. Model IV (Table 6) is computed with the same variables excluding LISEWPC and adding
LGDPPC, to demonstrate the different effects of the two indicators on energy consumption. Independent variables OLS PCSE
Normal Psar1 AR1 Ind
LTXEMP 0.1866*** 0.1866*** 0.2878*** 0.2331*** 0.1866*** LNREPC 0.1300*** 0.1300*** 0.0030 0.2003*** 0.1300*** LREPC 0.0706*** 0.0706*** 0.0424*** 0.0340*** 0.0706*** LRENTSPC 0.0062 0.0062 -0.0044 -0.0039 -0.0062 LIMPTPC 0.2969*** 0.2969*** 0.4594*** 0.3513*** 0.2969*** LSAVINGSPC 0.5079*** 0.5079*** 0.3275*** 0.2660*** 0.5079*** LCPI -0.4517*** -0.4517*** -0.2074*** -0.095 -0.4517*** LEIMPTPC -0.0674*** -0.0674*** -0.0424*** -0.0102 -0.0674*** CONS 7.0244*** 7.0244*** 4.0886*** 7.8993*** 7.0244*** N 418 418 418 418 418 R2 0.9385 0.9385 0.9967 0.9905 0.9385
Note: ***, **, *, denote significance at 1, 5 and 10% significance levels, respectively.
Independent variables OLS PCSE
Normal Psar1 AR1 Ind
LISEWPC -0.2252*** -0.2252*** -0.0778*** -0.0778*** -0.2252*** LINDPC 0.5582*** 0.5582*** 0.8323*** 0.6356*** 0.5582*** LURBAN 0.3921*** 0.3921*** -0.0894 0.2234** 0.3921*** LCPI -0.2894*** -0.2894*** -0.12344*** -0.1843*** -0.2894*** LFPRODPC 0.1047*** 0.1047*** 0.0789*** 0.0947*** 0.1047*** LEIMPTPC 0.2921*** 0.2921*** 0.1363*** 0.1049*** 0.2921*** CONS -8.3840*** -8.3840*** -14.7694*** -13.3254*** -8.3840*** N 323 323 323 323 323 R2 0.7854 0.7854 0.9997 0.9925 0.7854
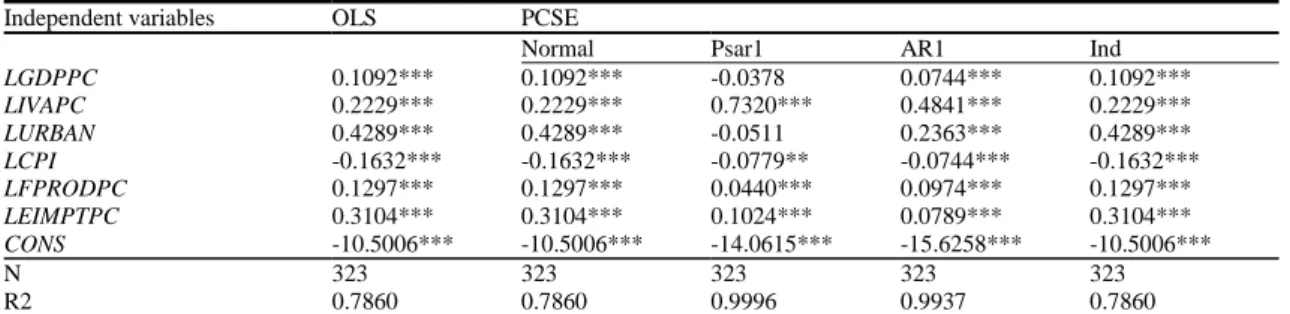
Table 6: Model IV- Energy consumption approached in a traditional way Independent variables OLS PCSE
Normal Psar1 AR1 Ind
LGDPPC 0.1092*** 0.1092*** -0.0378 0.0744*** 0.1092*** LIVAPC 0.2229*** 0.2229*** 0.7320*** 0.4841*** 0.2229*** LURBAN 0.4289*** 0.4289*** -0.0511 0.2363*** 0.4289*** LCPI -0.1632*** -0.1632*** -0.0779** -0.0744*** -0.1632*** LFPRODPC 0.1297*** 0.1297*** 0.0440*** 0.0974*** 0.1297*** LEIMPTPC 0.3104*** 0.3104*** 0.1024*** 0.0789*** 0.3104*** CONS -10.5006*** -10.5006*** -14.0615*** -15.6258*** -10.5006*** N 323 323 323 323 323 R2 0.7860 0.7860 0.9996 0.9937 0.7860
Note: ***, **, *, denote significance level at 1, 5 and 10%, respectively.
Table 6 shows that model IV is robust and that LGDPPC has a different effect on energy consumption than LISEWPC. Next, pair-wise Granger Causality was performed to analyse the traditional energy nexus and the energy nexus with LISEWPC as a proxy for sustainable development. So the two different nexuses can be compared.
Table 7. Pair-wise Granger causality tests
LISEWPC LPIBPC LCEPRIM LREPC LNREPC
LISEW does not cause - - 9.45*** 0.228 8.791***
LPIBPC does not cause - - 7.3778*** 0.232 0.239
LCOMPC does not cause - 6.151** 0.107 - -
LREPC does not cause 3.412* 0.165 - - -
LNREPC does not cause 0.395 3.094* - - -
Note: ***, **, *, denote significance level at 1, 5 and 10%, respectively
The pair-wise Granger tests demonstrate that the direction of causality between the endogenous variables used are; LREPC→LISEWPC; LNREPC→LGDPPC; LECOMPC←LISEWPC; LECOMPC ↔
GDPPC; and LNREPC → LISEWPC. 5.Discussion
Following economic theory, inflation, represented by LCPI in the model, has a negative effect on economic growth, mainly outside certain limits. In this study, this effect is stronger in ISEWPC, because when prices rise, increased production follows, leading to pressure on natural resources and less respect for the environment. The limits for “good inflation” seem to be more restricted for sustainable development than for economic growth.
Imports of goods and services have an effect in models 1 and 2, showing the importance of open trade. In the case of the ISEW, this still has the effect that liberalised trade can shift polluting activities from developed countries with higher production cost, such as environmental taxes, to poorer countries. However, the influence is even stronger in GDPPC, for reasons explained by the race-to-the-bottom theory. This theory states that after countries open up to trade, they prefer to adopt looser standards of environmental regulation in order to gain international competitiveness.
The incentives and ability to save, which defines the savings level, naturally has a positive influence on the two indicators studied. It is more effective in ISEWPC, because higher level of savings implies less consumption, which is the major cause of pressure on natural resources. Optimal interest rates should be redefined to promote sustainable development in the future.
An increase in energy imports leads to a decrease in GDPPC because it becomes more dependent on other countries, which brings monetary costs, along with political and social instability. The effect is less robust on ISEWPC, revealing the importance of energy efficiency and indigenous energy production. It is still negative, due to the fact that, except for hydroelectric, the energy traded between countries is non-renewable, because renewables are intermittent and difficult to store.
As expected, the exploitation of natural resources has a negative influence on ISEWPC due to its environmental impact, which makes sustainable growth difficult. It is not statistically significant in the GDPPC, which seems to be an effect similar to that of resource curse. On the one hand, a lack of diversification in resources used brings more exposure to external shocks, whether environmental or financial. On the other hand, an economy based on the export of resources leads, sooner or later, to an increase in foreign exchange rates, which brings a loss of competitiveness and subsequently, an economic crisis.
Models 3 and 4 confirm that energy prices have a negative effect on energy consumption. The level of urbanization and industrialization are important too. Energy consumption grows with increased energy imports, which suggests that countries are looking for better prices abroad, and not just for local production, which is more expensive.
The pair-wise Granger tests and the model analyses confirmed the growth hypothesis for non-renewables with GDP. So a decrease in non-renewable energy consumption provokes a reduction in production. Adding to this the fact that renewable energy confirms the neutrality hypotheses with GDP, it is understandable why governments continue to invest in non-renewable energy.
Despite having verified the conservation hypotheses for non-renewables with the ISEW, a negative effect can be seen in the model. Increases in renewable energy consumption imply growth in the ISEW (growth hypotheses). So using the ISEW as an indicator, the choice between renewable and non-renewable energy is clear.
The feedback hypothesis was determined by Granger causality between GDP and total primary energy consumption. Economic growth is dependent on energy consumption, as seen in model 4 in a positive way. So, to become richer, more energy consumption is necessary, which at a certain point in the future, will be impossible. For the ISEW and energy consumption, the conservation hypothesis was determined, but with a negative effect, as seen in model 3. An increase in the ISEW provokes a decrease in energy consumption. Diminishing energy consumption can lead to sustainable development.
6.Conclusion
In this paper, panel data techniques were applied, namely the PCSE estimator, to study the traditional energy growth-nexus from a perspective of sustainable development. As such, two alternatives were compared, the ISEW and the GDP for a set of twenty-two countries for a time span from 1995 to 2013. The ISEW is able to measure energy efficiency, environmental damage and the way natural resources are exploited.
The findings prove that the conclusions reached using the traditional energy consumption-economic growth nexus are quite different from those obtained using the ISEW. The growth hypothesis was determined for the ISEW with renewables and for GDP with non-renewables. In turn, the feedback hypothesis between GDP and energy consumption was confirmed. Moreover, there was a negative effect from the ISEW on energy consumption and one new “negative conservation hypothesis” was settled.
This paper sheds some light on the risk that a traditional interpretation of the energy-growth nexus could lead policymakers to make decisions that compromise the sustainable future, such as policies that indefinitely increase energy consumption. In contrast, an energy-development nexus interpretation reveals the suitability of introducing renewable energy production and energy efficiency policies. Therefore, ISEW is an indicator suitable to accomplish international energy use goals. As a consequence, countries should take the ISEW into account, not as a perfect substitute for GDP, but as a complementary indicator. This may increase the penetration of renewable energies and increase respect for natural resources. It should also be used to monitor national commitments to international environmental treaties.
References
[1] WCED, Our Common Future (The Brundtland Report), vol. 4. 1987.
[2] P. Beça and R. Santos, “A comparison between GDP and ISEW in decoupling analysis,” Ecol. Indic., vol. 46, pp. 167– 176, 2014.
[3] H. E. Daly and J. B. Cobb, For the Common Good: Redirecting the Economy Toward Community, the Environment, and a Sustainable Future. Beacon Press, 1989.
[4] J. Hicks, “Value and capital,” Econ. J., vol. 49, no. 194, pp. 294–300, 1946.
[5] S. El Serafy, “Green accounting and economic policy,” Ecol. Econ., vol. 21, no. 3, pp. 217–229, 1997. [6] I. Ozturk, “A literature survey on energy–growth nexus,” Energy Policy, vol. 38, no. 1, pp. 340–349, Jan. 2010.
[7] U. Al-mulali and L. Sheau-Ting, “Econometric analysis of trade, exports, imports, energy consumption and CO2 emission in six regions,” Renew. Sustain. Energy Rev., vol. 33, pp. 484–498, 2014.
[8] E. Yildirim, Ş. Saraç, and A. Aslan, “Energy consumption and economic growth in the USA: Evidence from renewable energy,” Renew. Sustain. Energy Rev., vol. 16, pp. 6770–6774, 2012.
[9] N. Bowden and J. E. Payne, “The causal relationship between U.S. energy consumption and real output: A disaggregated analysis,” J. Policy Model., vol. 31, no. 2, pp. 180–188, 2009.
[10] R. Ibarra and D. R. Trupkin, “Reexamining the relationship between inflation and growth: Do institutions matter in developing countries?,” Econ. Model., vol. 52, pp. 332–351, 2015.
[11] L. Gan, G. S. Eskeland, and H. H. Kolshus, “Green electricity market development: Lessons from Europe and the US,” Energy Policy, vol. 35, no. 1, pp. 144–155, 2007.
[12] C. T. Tugcu, I. Ozturk, and A. Aslan, “Renewable and non-renewable energy consumption and economic growth relationship revisited: Evidence from G7 countries,” Energy Econ., vol. 34, no. 6, pp. 1942–1950, 2012.
[13] N. Apergis and J. E. Payne, “Renewable and non-renewable energy consumption-growth nexus: Evidence from a panel error correction model,” Energy Econ., vol. 34, no. 3, pp. 733–738, 2012.
[14] A. C. Marques, J. A. Fuinhas, and T. L. Afonso, “The dynamics of the Italian electricity generation system: an empirical assessment,” WSEAS Trans. Bus. Econ., vol. 12, pp. 229–238, 2015.
[15] M. Bhattacharya, S. R. Paramati, I. Ozturk, and S. Bhattacharya, “The effect of renewable energy consumption on economic growth: Evidence from top 38 countries,” Appl. Energy, vol. 162, pp. 733–741, 2016.
[16] M. us Swaleheen, “Corruption and saving in a panel of countries,” J. Macroecon., vol. 30, no. 3, pp. 1285–1301, 2008. [17] A. Ozturk, “Examining the economic growth and the middle-income trap from the perspective of the middle class,” Int.
Bus. Rev., 2015.
[18] M. Bartleet and R. Gounder, “Energy consumption and economic growth in New Zealand: Results of trivariate and multivariate models,” Energy Policy, vol. 38, no. 7, pp. 3508–3517, 2010.
[19] A. C. Marques, J. A. Fuinhas, and J. R. Pires Manso, “Motivations driving renewable energy in European countries: A panel data approach,” Energy Policy, vol. 38, no. 11, pp. 6877–6885, 2010.