I
NTER-S
TOREE
XTERNALITIES AND THEE
FFICIENTA
LLOCATION OF AC
OMMERCIALC
ENTERS
PACEThe case of Sonae Sierra
Marta João Veríssimo de Azevedo
Thesis submitted as a partial requisite to obtain the Masters degree in MANAGEMENT
Supervisor:
PhD José Dias Curto, ISCTE Business School, Department of Quantitative Methods Co-supervisor:
PhD José Castro Pinto, ISCTE Business School, Department of Quantitative Methods
Several people were so central to my work that I would like to acknowledge them for all their support and expertise.
First and foremost, I owe special thanks to my supervisor, PhD José Dias Curto, and co-supervisor, PhD José Castro Pinto, whose help, advice, guidance and patient were invaluable.
I am also very grateful to Diana Simona Damian for her cooperation in providing the data used for the empirical analysis and to Mrs. Graça Leonor for her kindness towards me by editing my English which made this manuscript more readable.
A special „thank you‟ to my friends (too many to mention but they know who they are!) for all their readiness to anything at anytime. I am very fortunate to have friends like you in my life.
Finally, I would also like to express my deepest gratitude to my family, especially to my parents, for giving me life in the first place, for their unconditional support, love, and encouragement to pursue my dreams, for listening to my complaints and frustrations, and for believing in me. To my grandmothers, for sharing their invaluable experiences of life, for showing the need to be persistent in accomplishing any goal and, mainly, for having always taught me how important is to look at the positive side of life. My family‟s love has always been my greatest strength…
This thesis analyzes the complex problem of an efficient space allocation in shopping centers in the presence of inter-store externalities. In doing so, we exploit a comprehensive and unique dataset extending for a period of three consecutive years, to confirm that anchors generate positive externalities by increasing the sales of non-anchor stores and, in turn, non-non-anchor stores pay for those benefits through higher rents. Taking this into account, the developer should allocate space to the various stores in order to maximize the center turnover and retailer profits. The carried out empirical analysis shows that, on average, anchor stores have more space provided, higher volume of sales, and lower rents to pay. Specifically, „restaurant‟ and „cinema‟ types of anchors contribute to an increase on non-anchor sales and, simultaneously, the former also provides an increase on non-anchor stores rent. These findings have strong practical implications for the design of a commercial center space.
Keywords:Externalities, Anchor Stores, Commercial Center, Space Allocation
Esta tese analisa o complexo problema de uma eficiente alocação de espaço em centros comerciais na presença de externalidades. Para tal, utilizamos uma extensa base de dados, única e abrangendo um período de 3 anos consecutivos, para confirmar que as lojas âncora geram externalidades positivas, aumentando as vendas das lojas não-âncora e, por sua vez, que estas pagam esses benefícios através de valores de renda mais elevados. Tendo isto em conta, o promotor do centro comercial deve alocar espaço às várias lojas com o intuito de maximizar o volume de negócios do centro e o lucro das lojas. A análise empírica realizada mostra que, em média, as lojas âncora têm mais espaço disponível, um maior volume de vendas e rendas mais baixas. Especificamente, as lojas âncora do tipo “restaurante” e “cinema” contribuem para um aumento das vendas das lojas não-âncora e, simultaneamente, o primeiro contribui ainda para um aumento da renda das lojas não-âncora. Estes resultados têm uma forte implicação prática na política de alocação de espaço de um centro comercial.
Palavras-Chave: Externalidades, Lojas Âncora, Centro Comercial, Alocação de Espaço
1 INTRODUCTION ... 1
2 LITERATURE REVIEW ... 5
2.1 Relevant Determinants of Commercial Center Success ... 5
2.1.1 Agglomeration Economies ... 5
2.1.2 Inter-Store Externalities ... 6
2.1.3 Tenant Mix ... 8
2.1.4 Product Diversity ... 9
2.2 Retail Rent Determination ... 10
2.3 Manage Inter-Store Externalities ... 12
3 SONAE SIERRA ... 14 4 CONCEPTUAL FRAMEWORK ... 18 5 METHODOLOGY ... 20 6 EMPIRICAL APPLICATION ... 23 6.1 Data ... 23 6.2 Estimation Analysis ... 24
6.2.1 Descriptive Analysis of the Dataset... 25
6.2.2 Explaining the Sales of Non-Anchor Stores ... 34
6.2.3 Explaining the Rents of Non-Anchor Stores ... 38
6.2.4 The Efficient Allocation of a Commercial Center Space ... 41
7 CONCLUSION ... 43
8 REFERENCES ... 46
Fig. 1 – Sonae Business Areas... 14
Fig. 2 – Impact of Externalities on the Performance of a Store/Commercial Center ... 19
Fig. 3 – Number and Space of Anchor and Non-Anchor Stores ... 26
Fig. 4 – Mean Sales of Anchor and Non-Anchor Stores ... 26
Fig. 5 – Base and Overage Rent of Anchor Stores ... 27
Fig. 6 – Mean Rent of Anchor and Non-Anchor Stores ... 29
Fig. 7 – Types of Anchor Stores ... 30
LIST OF
TABLES
Table 1. Sonae Sierra – The Six Clusters ... 15Table 2. Sonae Sierra‟s Growth and Performance Indicators ... 16
Table 3. Sonae Sierra‟s Performance Indicators ... 16
Table 4. Anchor and Non-Anchor Stores ... 25
Table 5. Yearly Sales of Anchor and Non-Anchor Stores ... 27
Table 6. Anchor Stores‟ Rent ... 28
Table 7. Yearly Base Rent of Anchor Stores... 28
Table 8. Yearly Overage Rent of Anchor Stores ... 29
Table 9. Mean Values for Anchors ... 31
Table 10. Test of Normality ... 32
Table 11. Test of Homogeneity of Variances ... 33
Table 12. Kruskal-Wallis Test ... 33
Table 13. Dependent (D) and Explanatory (E) Variables (Sales) ... 34
Table 14. Explaining the Sales of Non-Anchor Stores (fixed-effects regression) ... 36
Table 15. Explaining the Sales of Non-Anchor Stores (random-effects regression) ... 38
Table 16. Dependent (D) and Explanatory (E) Variables (Rents) ... 39
Appendix 1. GLA of Anchor and Non-anchor Stores ... 49
Appendix 2. Mean Sales of Anchor and Non-anchor Stores ... 49
Appendix 3. Base and Overage Rent of Anchor Stores ... 49
Appendix 4. Base and Overage Rent of Anchor Stores in 2005 ... 49
Appendix 5. Base and Overage Rent of Anchor Stores in 2006 ... 49
Appendix 6. Base and Overage Rent of Anchor Stores in 2007 ... 50
Appendix 7. Types of Anchor Stores ... 50
Appendix 8. Brands per Type of Anchor Stores ... 50
Appendix 9. Breusch-Pagan Test (Sales) ... 50
Appendix 10. Durbin-Wu-Hausman Test (Sales)... 51
Appendix 11. Breusch-Pagan Test (Rents)... 51
1 INTRODUCTION
“A given number of stores dealing in the same time merchandise will do more business if they are located adjacent or in proximity to each other than if they are widely scattered”
Richard Nelson
The impact of commercial centers in modern economics and lifestyles is well established: just to give an example, in 2007, malls account for around 14% of all US retailing, about $308 billion in annual sales, slightly more than half of what people did in malls was unrelated to actual shopping – eating, movies, games, hanging out, socializing, and so on (Yiu, 2007).
The term „shopping center‟ has been evolving since the early 1950s. Following Cushman and Wakefield (2009: 1), we define it as “a centrally managed, purpose built facility with a gross livable area of over 5,000m2 and comprising more than 10 retail units. Factory outlets and retail parks are excluded”. In a somewhat similar vein, the ICSC1 (1999) defines „shopping center‟ as a group of retail and other commercial service providers that is planned, developed, owned and managed as a single property. On-site parking is provided and the center's size and orientation are generally determined by the market characteristics of the trade area served by the center.
Taken together, this concept assumes the simultaneous existence of a number of characteristics: spatial integration of establishments, unitary management and shared services, adaptation of the commercial project to the specific nature of the target population, diversity in the trade mix and the presence of anchor stores, extended opening hours common to all installed units, and availability of car parking facilities. However, due to the maturity of the industry, numerous types of centers currently exist that go beyond the standard definitions. The ICSC (1999) has already defined eight main shopping center types based on size, age, number and type of anchors, as well as the trade area: Neighborhood Center, Community Center, Regional Center, Superregional Center, Fashion/Specialty Center, Power Center, Theme/Festival Center, and Outlet Center.
1
Implicit in shopping center definition are the concepts of retail agglomeration and inter-store externalities. Underlying the concept of agglomeration economies – defined as the benefits ensuing from clustering of economic activity, in this case, retail stores – is the reduction in consumer search and uncertainty costs (Des Rosiers et al., 2009). Besides, the agglomeration of a large number of stores together under the same roof also provides higher competition and easier price comparison (Yiu, 2007). In turn, retailers can enjoy high levels of customer traffic and large sales volume (Brueckner, 1993). As a result of this retail agglomeration, a complicated web of inter-store externality is created, assuming that the traffic and sales of each store depends in part on how many customers the other stores attract (Gould et al., 2005).
Positive inter-store externalities, sometimes referred as demand externalities, are the positive effects generated from one or more tenant(s) to other tenant(s) without consent between the generator and receiver. These demand externalities have been recognized as significant agglomeration economies that generate increased returns in shopping centers (Fujita and Thisse, 2002). Conversely, negative externalities can generate lower rates of return (Eppli and Benjamin, 1994).
Thus, the success of each store depends upon the presence and the effort of other stores, and also the effort of the developer to maintain the mall (both as an infrastructure pipe and a business). On the other hand, the success of the center is strongly connected with the extent to which stores can internalize positive externalities and eliminate the sources of negative ones.
Store types differ, as known, in their externality-generating abilities. Therefore, inter-store externalities must be internalized by subsidizing the rent of inter-stores that generate mall traffic to other stores (and charging a rent premium to the beneficiaries) so that space is efficiently allocated.
Several previous researches widely recognized that stores within commercial centers generate sales or business traffic externalities amongst themselves (see, e.g., Gould et al., 2005; and Wheaton, 2000). Many others even argue demand externalities are unidirectional – from anchor to non-anchor stores – (see, e.g., and Gerbich, 1998; Eppli and Shilling, 1993; and Ingene and Ghosh, 1990). However, this leads us to relevant issues: a) how to distinguish the (externalities) generator and receiver one, i.e., who
relies upon whom, b) how rents of „strong tenants‟2
are subsidized based on externalities generation, and c) how efficiently allocate mall space in order to increase center turnover and retailer profits.
In fact, the importance of each store‟s effort to the overall mall performance is related to the net externalities generated by all others stores. Therefore, charging the same rent and designing the same level of incentives for each store seems to be highly inefficient: stores which generate the most positive externalities by their presence and effort should pay lower rents per square meter and have larger incentives to exert effort (Pashigian et al., 1998). Furthermore, stores that confer large external benefits on other stores should also receive more space within the center (Miceli et al., 1998).
Understanding the full impact of the inter-store externalities on mall performance is a prerequisite for translating them into appropriate space allocation and rent determination decision rules which, therefore, remains a very complex task. A large body of literature has already proved the power of anchor stores; however, analyze the complex problem of an efficient space allocation in shopping centers in the presence of inter-store externalities has received less attention and call for more research on this issue.
This thesis has two main objectives. First, we intend to shed light on the impact of inter-store externalities created by anchors on sales and rents of non-anchor inter-stores. Second, we aim to demonstrate how malls price the net externality of anchor stores in order to achieve an efficient allocation of space. In doing so, we propose to confirm that anchors generate positive externalities by increasing the sales of non-anchor stores, and in turn, non-anchor stores pay for those benefits through higher rents. Basically, we intend to see how the Sonae Sierra‟s model is responding to those issues.
We contribute to the existing literature in two distinct ways. First, and besides using a unique data of mall performance and characteristics information, as we state below, we identify a very important and intriguing problem: if anchors do generate sales for other stores, what implications does this have for the rents of the non-anchor stores? Second, using those insights we aim to explain how a developer should allocate space in center among stores whose sales are interrelated through externalities in order to achieve the highest profits and investment returns possible. The answers to these questions are
2
crucial for mall developers interested in overall mall performance, yet, it is not straightforward.
Throughout this empirical analysis, we exploit a rich dataset of 35 Sonae Sierra‟s commercial centers, from Portugal and Spain, containing important information, such as: sales, traffic people, age of mall, size, number of stores, fixed and overage rent, on a yearly basis, of about 4,000 stores. Unlike many authors studying this problem, we have the privilege of multiple-period observations: 2005 to 2007. Hence, “cleaner” estimates of within-mall externalities between stores may actually be achieved. Besides, such a complete and large sample enable us to walk straight to the answers of the issues mentioned above, in a more accurate manner, i.e., studying annual data and verifying the stability in time of the conclusions found.
The thesis is structured as follows. We start with a summary of the relevant literature followed by a brief description of Portuguese market leader, Sonae Sierra, whose data is used in this thesis. Section 4 conceptualizes the impact of externalities on stores sales and rents, and on overall mall performance. Section 5 presents the methodology used to carry out our research. Section 6 introduces the empirical analysis. It describes our unique dataset, variables and estimation results based on STATA® and SPSS® software tools. Section 7, finally, provides conclusions and indicates areas for future research.
2 LITERATURE R
EVIEW
In this section, we provide an overview of published research results in three domains of interest to this thesis. The first two research streams relate to relevant determinants of commercial center success and to retail rent determination. Given our interest in profit-maximizing developer implications, an overview of manage inter-store externalities literature is provided in the third part of this review.
2.1 Relevant Determinants of Commercial Center Success
Taking location theories as the conceptual background (Weber, 1929), sales potential in commercial centers are looked upon through the concepts of agglomeration economies and externalities derived from the presence of anchor tenants (Eppli and Benjamin, 1994; Fisher and Yezer, 1993; Ingene and Ghosh, 1990; Ghosh, 1986; West et al., 1985; Mulligan, 1983; and Eaton and Lipsey, 1979), as well as from tenant mix and product
diversity (Mejia and Benjamin, 2002; and Pashigian and Gould, 1998)3. Taking this into
account, an overview of these four concepts seems to be mandatory to a broad understanding of their impact on the performance of a commercial center. However, since our main interest lies on the role of inter-store externalities in determining the centers‟ optimal space allocation, a deeper attention is given to this issue.
2.1.1 Agglomeration Economies
There exists a considerable body of literature that studied the economic reasons behind the co-location of firms – as seen in commercial centers and other centralized clusters. In retail location theory, Nelson (1958: 58) was the first to illustrate that agglomeration of retail activities is based on the theory of cumulative attraction which states that “a given number of stores dealing in the same time merchandise will do more business if they are located adjacent or in proximity to each other than if they are widely scattered”. Kalnins and Chung (2004) also emphasized that agglomeration among retail can
3 Meijia and Benjamin (2002) also state non-spatial factors (e.g., retail brand and image) as relevant
determinants of shopping center sales. However, since our main interest lies on externalities, those are unnecessary to highlight in this thesis.
heighten demand by attracting more customers than the sum of those that the agglomerating firms would attract individually.
As a result of co-location of stores, a retailer can reduces consumer search costs and thus attracts more consumers. Consumers economize on the amount of time spent shopping, by making multipurpose shopping trips, combining purchases for different product categories and reducing the number of trips at a particular time period, or by purchasing a large amount of goods, for example, groceries, while making a singlepurpose shopping trip (reducing travel costs by combining trips over time) (Popkowski et al., 2004).
Retail agglomeration can include both homogenous and heterogeneous clustering of retailers. Clusters of heterogeneous stores, based on central place theory, provide consumers with an increased opportunity for multipurpose shopping and a reduction in total travel costs (Ghosh, 1986; Huff, 1964; Converse, 1949; and Reilly, 1931). The clustering of homogeneous retailers, based on the concept of minimum differentiation, allows for comparison-shopping at agglomerated sites (Eaton and Lipsey, 1979).
Results from empirical studies have reported that between 30%-50% of all shopping trips are multipurpose (Popkowski and Timmermans, 2001; O‟Kelly, 1983). Retailers have responded to this assumption by providing a wide assortment of products allowing consumers to combine purchases in multiple product categories.
2.1.2 Inter-Store Externalities
While retail agglomeration economizes on consumer search and uncertainty costs, a complicated web of externality is created, assuming the profit and traffic of each store depend in part on how many customers the other stores attract (Gould et al., 2005). An externality arises when one part directly conveys benefit or cost to others (Lu, 2008). Thus, positive inter-store externalities, also referred as demand externalities, are the positive effects generated from one or more tenant(s) to other tenant(s) without consent between the generator and receiver. These demand externalities have been recognized as significant agglomeration economies that generate increased returns in shopping centers (Fujita and Thisse, 2002). Conversely, negative externalities can generate lower rates of return (Eppli and Benjamin, 1994).
These two types of situations - the generation of positive and negative externalities - have interesting implications with respect to the ensuing discussion concerning malls. However, while positive externalities generation are strongly associated to anchor stores, so far the negative ones are not so well researched. According to several authors, this is part of a general lack of research into the complex matter of inter-store externalities.
In fact, agglomeration of stores inevitably creates free-rider problems because the success of a store depends, in part, on the presence of other stores within the mall, especially on the presence of anchor stores. A common claim is that consumers are attracted to malls because of the presence of well-known stores - department stores with recognized names. By generating mall traffic, anchors create external economies by indirectly increasing sales and/or reducing promotion and other costs of a host of smaller stores. Therefore, lesser-known stores can free ride off of the reputations of better-known stores (Pashigian and Gould, 1998).
Those „better-known stores‟, so-called anchor stores, have been subject to numerous definitions, all of them including „size‟, „attraction‟, „recognition‟, „chain of stores‟, „traffic generator‟, and „stores benefit from its presence‟ as main elements. One of its definitions was developed by Konishi and Sandfort (2002: 2), who state that an anchor store “is a store that increases, through its name's reputation, the traffic of shoppers at or near its location”. The problem is that this kind of definition is „endogenous‟ in that the characterization of an anchor store already hinges on its ability to generate traffic/sales. Hence, based on objective characteristics, Sonae Sierra defines anchor store as a unit integrated in a shopping center mix of tenants with the purpose of significantly increasing the scheme attractiveness to the customer. It comprises all or most of the following features:
Large (commonly above 600m2 Gross Livable Area (GLA));
Multiple (national or international chain – a minimum of 3 stores);
Has a strong brand (high awareness and positive response levels);
Adds significant traffic (specifically generates footfall);
Wide attractiveness: this is taken to mean it would trade successfully as a stand-alone unit;
As an ex-post test, an anchor tenant usually enjoys a privileged position in the rent and service charges.
Basically, the anchor tenant sets the tone and image of the shopping center (Ibrahim and Galven, 2007). In general, consumers are likely to visit the shopping center because of its anchor tenants; this in turn helps to generate sales and profits for the other „lesser-known stores‟.
The importance of anchor tenants has been stressed earlier, yet it would be a mistake to think that a commercial center could prosper without the independent small tenants. Even though some anchor tenants do provide a wide selection of goods and services at a discounted price, they are not sensitive in providing for the ever-changing needs of the consumers. On the other hand, small retailers may carry a limited range of products and services, but they are more flexible and yet specific in catering to consumers' needs. Moreover, small retailers yield higher rentals per square meter as compared to anchor tenants in the same shopping center (Ibrahim and Galven, 2007).
If positive externality arises when one part directly conveys benefit to others, analogously, a negative externality arises when one party directly imposes a cost to others, e.g., business taken away by a new store from the existing stores (Lu, 2008). A notable research on the issue is provided by Yeates et al. (2001). Their results point to the following conclusions: there is no doubt that the closure of the department store had a negative impact on other stores in the malls involved in the analysis. However, the negative impact did not result, in the aggregate, in current dollar losses: it was marked only in those stores closest to the shopping center entrances and not similarly patent in all merchandise categories. It would appear that if the absence of an anchor can dampen aggregate sales in adjacent stores by about 12%, then a vibrant anchor may stimulate aggregate sales in adjacent stores by a similar percentage.
This illustrates why developers must take account of externalities in choosing the types, sizes and location of stores in the center in order to optimize externalities and make the center as profitable as possible.
2.1.3 Tenant Mix
Emerging from the literature on the design and evaluation of shopping malls, the tenant mix or the space allocation and location of the retail stores is an essential characteristic of the shopping mall: “a full line-up of strong and well placed traders is important to the retail tenant, whose performance is dependent on the level and type of footfall attracted.
The success of individual tenants and the success of a center as a whole are interdependent and enhanced by the cumulative synergy generated by the mix of stores.” (Kirkup and Rafiq, 1994: 29). Being certainly one of the most crucial elements on the generation of inter-store externalities and in establishing the image of a commercial center, its impact on the performance of a commercial center cannot be neglected.
As stated by Kaylin (1973) cited in Downi et al. (2002: 5), tenant mix refers to the “combination of business establishments occupying space in a shopping center to form an assemblage that produces optimum sales, rents, service to the community and financiability of the shopping center venture". Hence, optimizing tenant mix involves choosing the right tenant, with the right size, selling the right product at the right spot (Des Rosiers et al., 2009). Therefore, under the mixture of tenants, strong brand name and other popular stores spillover their sales efforts to other tenants (Miceli and Sirman, 1995), establishing the positive image of the center.
A good tenant mix includes a variety of compatible (or complementary) retail/service providers, and an efficient space allocation (both size and number) and proper tenant placement that encourages the interchange of customers and retail activities. In a wider perspective, it should also include sufficient public facilities and services, both in terms of the quality and quantity demanded. The essentials that enhance the quality of the center‟s shopping environment, to satisfy shoppers‟ needs, such as goods and services, convenience, excitement, and amenities, are all part of the elements of an ideal tenant mix - otherwise, it can result in a resounding failure.
However, tenant mix is not a static condition: the market changes over time, as do the customer preferences and fashion trends. Therefore, even the “ideal” condition achieved in one season or period might not be suitable for the next one. Consequently, center developers have to adjust their tenant mix constantly to keep up with the market trends (Yuo et al., 2004).
2.1.4 Product Diversity
As known, from agglomeration theory, variety of retail/service is an important factor in increasing productivity in the traded-good sector (Fujita and Thisse, 2002; and Fujita, 1989). Fischer and Harrington (1996: 281) thus suggested “greater product
heterogeneity increases consumer search, which raises the amount of shopping at a cluster”.
The larger the shopping center, the more variety it needs. The greater the variety it has, the higher the productivity it can achieve. Consequently, clustering of retailers can generate variety and increase attraction. However, variety is not merely the diversity of product combinations but should include certain principles to maximize the favorable effects that generate increasing returns. In a shopping center, product variety comes from the combination of retail/service tenants - the tenant mix strategies that are adopted by the manager (Yuo et al., 2004).
2.2 Retail Rent Determination
The empirical research on shopping center rents has revealed several findings (see, e.g. Eppli and Benjamin, 1994; Sirmans and Guidry, 1993). First, smaller retailers are willing to pay a rental premium to locate in planned shopping centers having high-order retailer customer drawing power. Second, there is a trade-off between base rents and overages. And, third, retail rents are determined by a set of factors that include: a) customer drawing power, which includes a vector of physical building characteristics and a vector of anchor tenant type (e.g., national, regional, or local); b) design characteristics of the center, such as strip center layouts versus enclosed mall design; c) market condition variables such as occupancy rates, population or households, and income; and d) other specific location attributes.
The current literature suggests that rental rates are largely determined by the shopping center‟s physical characteristics and location, along with the opportunity of smaller tenants to locate proximate to a major anchor tenant (Gatzlaff et al., 1994).
In Eppli and Shilling's (1993) model, they observed that anchor tenants have far lower rentals per square meter than independent small retailers. This is due to anchor tenants being able to enjoy rents that are heavily discounted4; developers use this strategy to lure the well-established anchor tenants into their shopping centers. On the other hand, the small retailers do not have much bargaining power and the developer sees no incentive to lower their rentals; hence, small retailers usually have to pay a higher rent
4 Major tenants are able to negotiate lower rents with developers (Anderson, 1985), as their departure may
cause rental income to drop by as much as 25% (Gatzlaff et al., 1994), a fact that greatly enhances their bargaining power.
per square meter than anchor tenants5. Basically, stores whose reputation, size or products tend to draw customers will pay less per square meter, while smaller, less known retailers who depend on passing-by traffic will pay more (Wheaton, 2000). For all stores, the rental payment is determined by three provisions in the contract: (1) the fixed base rent, (2) the threshold level of sales, and (3) the overage sharing percentage (Gould et al., 2005). Each month, a store must pay the specified fixed base rent (i.e., the base rent per square meter of GLA). If the store‟s sales exceed the threshold level, the store must also pay an overage component equal to a percentage (determined by the overage sharing percentage) of sales above the threshold level. That is, some stores theoretically may have to pay a portion of their sales above the threshold, but if their sales do not exceed the threshold in practice, the store just has to pay the base rent.
According to Gould et al. (2005) analysis6, the most striking feature of anchor contracts is that most anchors either do not pay any rent or pay only a trivial amount. This means, most anchors have a zero base rent7 and do not reach their threshold level of sales, thus paying no rent even though theoretically they could if their sales were high enough. Another striking feature concerns the sharing percentages: non-anchor stores are more likely to have sharing provisions in their contracts, with only 1% of non-anchor stores required to pay base rent only, compared to 76% of anchor stores. Furthermore, few anchors are eligible to pay overage, but similar to non-anchors, many of them do not reach the threshold level. The last striking regularity is that anchors have much lower sharing percentages than anchor stores (0.47% for anchors and 6.27% for non-anchor stores).
These findings reveal that the provisions of the lease are flexible enough to determine how much the rent will be based on the performance (sales) of the store, and how much is fixed in advance. Moreover, an intriguing issue is that these contracts are not designed to share risk, as several authors defend (see, e.g., Miceli and Sirmans, 1995; and Brueckner, 1993) but more to align incentives between anchor tenants and
5 Due to this discrimination in retail rents, a recent phenomenon has been observed: more landlords do not
try to replace anchor tenants alike when they cease operations. Instead, they invest considerable capital into renovations to convert the large vacated space to micro-mini retail space to accommodate many times more tenants marketed within a single concept (Ibrahim and Galven, 2007).
6 They used a database for over 2,500 stores in over 35 large malls across Unites States in 1994. 7
developer – lowering non-anchor threshold and increasing non-anchor sharing percentages.
Consistent with Sirmans and Guidry (1993), the rental rates charged to shopping center tenants are assumed to be related to customer drawing power (influenced by the size and age of the center, and anchor tenant information) market condition (demographic and economic attributes of the primary market area of the center), and shopping center’s physical characteristics and location (design of the center and specific locational characteristics of the site).
2.3 Manage Inter-Store Externalities
Once emphasized the synergy effects that can be generated by retail agglomeration, how to internalize or manage inter-store externalities is the next main issue.
Previous research has demonstrated that without any incentive or compensation, the „strong tenants‟ – the strong, positive, externality generators – will not maintain or enhance their ability to generate positive effects for other tenants (see, e.g., Yuo et al., 2003; and Pashigian and Gould, 1998). These incentives or compensations are considered in three economic theories: a) Pigouvian tax/subsidy, b) Coase Theorem, and c) constraint regulations through government intervention. The Pigouvian tax/subsidy approach directly implies a tax/subsidy mechanism between the effect generators and receivers: tenants that generate positive externalities should be subsidized by those who enjoy these benefits. In a more recent published article, Pashigian and Gould (1998: 115) suggest the concepts of „rent premiums‟ and „rent subsidies‟ should be implied in this process: “mall developers internalize these externalities by offering rent subsidies to anchors and by charging rent premiums to other mall tenants”. In line with this statement, a considerable number of studies document that percentage rent payments are smaller for stores that generate the most (positive) externalities (see, e.g., Gatzlaff et al., 1994; and Brueckner, 1993).
In a more general view, Coase theorem asserts that by clearly delineated the property rights of the externalities, the efficiency condition (Pareto Optimal) between the effect receivers and generators can be achieved by negotiation. However, high transaction costs usually become an obstacle to internalizing externalities through these two approaches. Under such a circumstance, rules or regulations set and implemented by
government or a third party (mall developer) become the best and most feasible way to manage externalities.
Taken together, these three basic approaches lead us to a relevant conclusion: a full understanding of in-center externalities and the way that the contribution of positive generators is “rewarded” by a lower rent is important in modeling shopping center rents (Yuo et al., 2003).
Besides, in shopping centers, clearly defined physical and intangible rights and obligations in the leasing contract can eliminate the sources of negative inter-store externalities, so as to prevent conflicts between tenants and the center manager. A well designed and implemented tenant mix strategy can also prevent negative effects among tenants by tenant selection specific retail categories. Furthermore, agglomeration economies can be enhanced by internalizing the externalities through service charges, leasing incentives and other non-monetary obligations among tenants, so as to establish the strongest tenant mix (Yuo et al., 2003).
However, this is more easily said than done. For one, it is hard to distinguish the generator and the receiver ones, i.e., who relies upon whom, and then distribute the optimal amount of incentives to exert effort to each of the three major participants in a mall: the developer, the anchors, and non-anchor stores. As known, the developer depends on each store owner to exert effort not only to maximize their own store‟s profit, and consequently their willingness to pay more rent, but also to generate more traffic to other stores as well.
Even though it is observed that the presence of an anchor store will lead to many benefits for the developer, one should note that having an increasing number of anchor stores in a shopping center would not work towards the developer's profit maximizing goals (Ibrahim and Galven, 2007).
As emphasized by West (1992), owners of shopping malls are selecting retail stores and their locations in a profit-maximizing way. Even so, there remains room for improvement: they need to be more aware of the impact of inter-store externalities and ways of manage them which, therefore, contribute to achieve an efficient allocation of a commercial center space.
3 SONAE SIERRA
8“We are guided by our belief that the people who visit our centers want to enjoy more than just a satisfying shopping experience”
Portela (CEO), 2006
Sonae Sierra is a part of a larger conglomerate named SONAE, whose roots can be found in the 60s of the last century. More precisely, Sonae was founded in August 1959, initiating its activities in industrial area of wood laminates. These activities were persecuted until the 70s, when Sonae began its activities diversification.
Nowadays, Sonae is structured in six main areas of business, as shown in Fig. 1.
Fig. 1 – Sonae Business Areas9
Incorporated in Portugal in 1989, Sonae Sierra is an international shopping center specialist owned by Sonae SGPS (Portugal) with 50%, and Grosvenor (United Kingdom) with 50%. The first two Commercial Centers managed by Sonae Sierra started operating in 1989 in Portimão and Albufeira, Portugal. This was followed in
8 Based on Sonae Sierra (2010). 9
1991 by the opening of Cascais Shopping – the first modern Commercial Center in Portugal.
Nowadays, Sonae Sierra operates in Portugal, Spain, Italy, Germany, Greece, Romania, and Brazil, where it manages 51 Shopping Centers with a total GLA of about 2.0 million m2, 8,924 tenants and, with more than 436 million visits in 2009. Simultaneously, it provides services to third-parties in Serbia, Cyprus, Morocco, and Colombia. Besides, Sonae Sierra has 3 more projects under construction and 7 new projects in different phases of development in Portugal, Italy, Germany, Greece, Romania and Brazil.
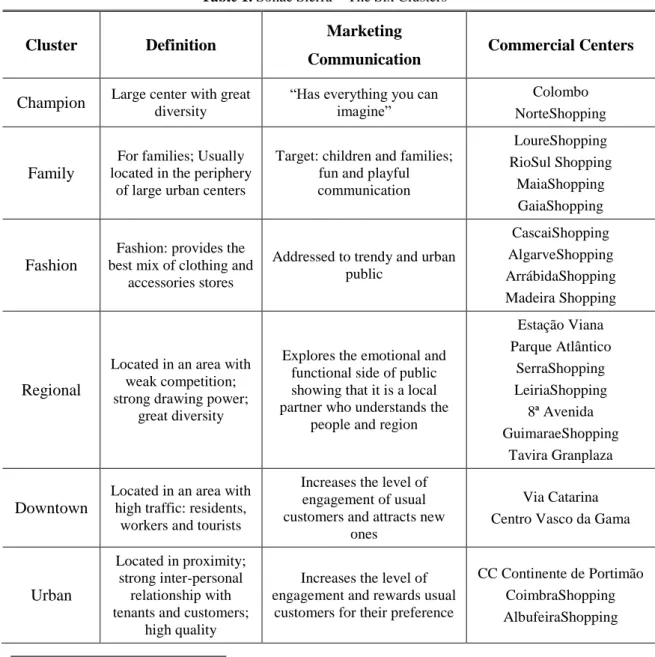
Sonae Sierra defines six clusters of commercial centers located in Portugal:
Table 1. Sonae Sierra – The Six Clusters10
Cluster Definition Marketing
Communication Commercial Centers
Champion Large center with great diversity “Has everything you can imagine” Colombo NorteShopping
Family
For families; Usually located in the periphery
of large urban centers
Target: children and families; fun and playful communication LoureShopping RioSul Shopping MaiaShopping GaiaShopping Fashion
Fashion: provides the best mix of clothing and
accessories stores
Addressed to trendy and urban public CascaiShopping AlgarveShopping ArrábidaShopping Madeira Shopping Regional
Located in an area with weak competition; strong drawing power;
great diversity
Explores the emotional and functional side of public showing that it is a local partner who understands the
people and region
Estação Viana Parque Atlântico SerraShopping LeiriaShopping 8ª Avenida GuimaraeShopping Tavira Granplaza Downtown
Located in an area with high traffic: residents,
workers and tourists
Increases the level of engagement of usual customers and attracts new
ones
Via Catarina Centro Vasco da Gama
Urban
Located in proximity; strong inter-personal
relationship with tenants and customers;
high quality
Increases the level of engagement and rewards usual
customers for their preference
CC Continente de Portimão CoimbraShopping AlbufeiraShopping 10 Based on Gonçalves, 2010
Sonae Sierra pursuits an “integrated approach” to the business - Shopping Center & Retail Parks - meaning the ownership, development and all the management activities required. The company owns know-how and expertise required to the entire Shopping Center development process: Planning Investment Building Management, and runs it under the mission “to create value for our shareholders, while taking into account our social responsibilities towards our other important stakeholders, as well as the environment”. (Sonae Sierra, 2010: 5)
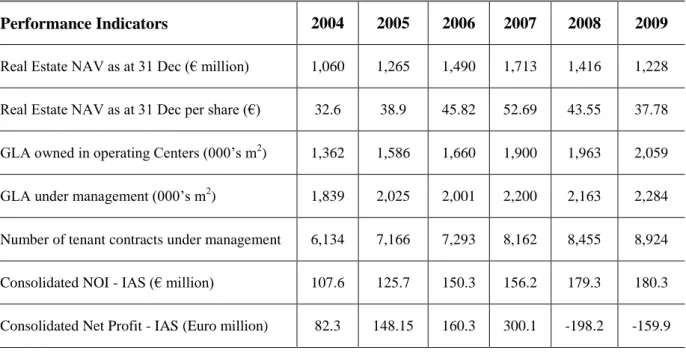
To get a deeper idea of Sonae Sierra‟s dimension, behind its 51 Shopping Centers and the dynamics of evolution, we can take into account the following Table 2 and 311:
Table 2. Sonae Sierra‟s Growth and Performance Indicators
Performance Indicators
Growth (as % of previous year)
2004 2005 2006 2007 2008 2009
Real Estate NAV as at 31 Dec per share 12% 19% 18% 15% -17% -13% GLA (m2) owned in operating Centers 13% 16% 4% 14% 3% 4%
GLA (m2) under management 17% 10% -1% 9% -1% 5%
Number of tenant contracts under management 13% 16% 1% 11% 3% 5%
Table 3. Sonae Sierra‟s Performance Indicators
Performance Indicators 2004 2005 2006 2007 2008 2009
Real Estate NAV as at 31 Dec (€ million) 1,060 1,265 1,490 1,713 1,416 1,228 Real Estate NAV as at 31 Dec per share (€) 32.6 38.9 45.82 52.69 43.55 37.78 GLA owned in operating Centers (000‟s m2) 1,362 1,586 1,660 1,900 1,963 2,059
GLA under management (000‟s m2) 1,839 2,025 2,001 2,200 2,163 2,284
Number of tenant contracts under management 6,134 7,166 7,293 8,162 8,455 8,924
Consolidated NOI - IAS (€ million) 107.6 125.7 150.3 156.2 179.3 180.3
Consolidated Net Profit - IAS (Euro million) 82.3 148.15 160.3 300.1 -198.2 -159.9
11
According to Inês Vasconcelos Proença, Marketing Europe B2C Manager at Sonae Sierra, in Gonçalves (2010: 12), “the ability of constant innovation in the last twenty years was what dictated the success of Sonae Sierra”. In fact, thanks to the expertise, innovation and good results, Sonae Sierra earned an international reputation and collected more international prizes than any other company in the sector.
4 CONCEPTUAL F
RAMEWORK
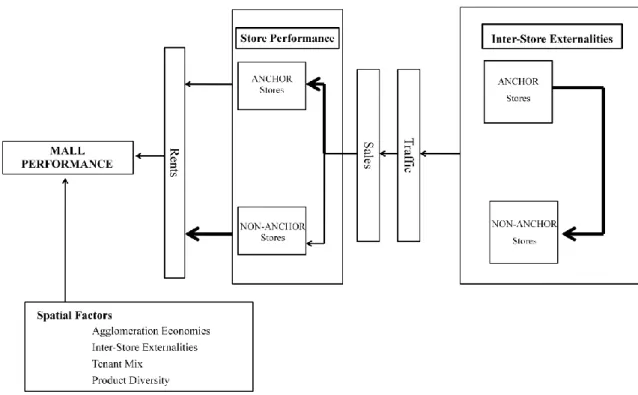
Based on the above literature, we develop a framework that characterizes the impact of demand externalities created by anchors on sales and rents of non-anchor stores. Accordingly, it also clarifies their impact on overall mall performance. This framework is depicted in Fig. 2.
The starting point for this framework is a set of relevant determinants of shopping center success. From the literature review, we retain some spatial factors (agglomeration economies, inter-store externalities, tenant mix, product diversity) that may influence mall performance. In one more detailed perspective, we conceptualize the way inter-store externalities may influence inter-store/mall performance.
According to the stylized model developed by Eppli and Shilling (1993), there are two types of tenants: a) anchor; and b) non-anchor tenants. The anchor tenants create a draw card for the center and the non-anchor tenants‟ benefit from locating near the anchor – such a dynamic interaction should be carefully planned, in view of the complex way in which developer decisions influence store/mall performance.
Fig. 2 suggests that anchor stores may trigger a mall draw effect, i.e., attract additional business to the center, either by inciting current customers to spend more at the center, or by attracting new customers. This mall draw effect creates interdependencies between all stores in a mall: each store affects other stores‟ sales and, therefore, the overall mall performance. To illustrate, customers drawn to a specific mall by an attractive (anchor) store may visit other stores engaged, for instance, in impulse buying. Another important issue that is also clarified in Fig. 2 is related to retail rents: stores that potentially generate the most positive externalities pay lower rents per square meter and this constitutes an incentive or compensation due to its attraction power. In turn, smaller stores, benefiting from the generation of demand, pay higher rents per square meter. As demonstrated by Gould et al. (2005), contracts are designed more to align incentives between anchor tenants and developer. Hence, rentals on retail space are extremely sensitive to the sales volume and externalities generated by the store (Sirmans et al., 1993). Finally, the developer must take this into account when choosing the optimal allocation of space to the stores, in order to maximize total center rental and, therefore, mall performance.
Fig. 2 – Impact of Externalities on the Performance of a Store/Commercial Center
Based on this, we can identify three important research questions: (a) how anchors generate sales for other stores, (b) what implications does this have for the rents of the non-anchor stores, and (c) how efficiently allocate mall space in order to increase center turnover and retailer profits. These issues are taken up next.
5 METHODOLOGY
12To fully account for the role that externalities play in producing non-anchors level results and more importantly, how it can be translated into an efficient allocation of a commercial center space, a combination of cross section and time series data is used13. Such data, so-called longitudinal or panel, allow us to analyze those issues in a more accurate manner, i.e., identifying unobserved heterogeneity and revealing dynamics – difficult to solve and detect with cross-sectional data.
A standard model with panel data is:
where: Y is the dependent variable, the Xj are observed explanatory variables, and the Zp
are unobserved explanatory variables. The index i refers to the unit of observation, t refers to the time period, and j and p are used to differentiate between different observed and unobserved explanatory variables. uit is a disturbance term assumed to satisfy the
usual regression model conditions.
Being Zp variables responsible for unobserved heterogeneity and as such constitute a
nuisance component of the model, we can confine it to the (quite common) special case where it is reasonable to assume that unobserved heterogeneity is unchanging and accordingly do not need a time subscript. Furthermore, there is no means of obtaining information about unobserved variables and, therefore, it is convenient to rewrite (1) as:
where,
12 Based on Wooldridge (2003) and Dougherty (2007)
13 Basically, we exploit a rich dataset of 35 Sonae Sierra‟s commercial centers, observed periodically:
2005-2007.
(1)
(2)
If the Xj controls are so comprehensive that they capture all the relevant characteristics
of the commercial center individual, there will be no relevant unobserved characteristics. In that case the i term may be dropped and a pooled OLS regression
may be used, treating all the observations for all of the time periods as a single sample. However, if i is correlated or uncorrelated with any of Xj variables, the regression will
be subject to unobserved heterogeneity bias or yield inefficient estimates and invalid standard errors. In those cases a fixed-effects model or random-effects model may be used, respectively.
But how can we assess the appropriateness of the models according to our dataset? Using STATA® software tool we identify the best model, firstly by running Breusch-Pagan Lagrange multiplier test and then the Durbin-Wu-Hausman (DWH) test14. The former was developed by Breusch and Pagan in 1980 and helps to choose between the pooled regression and the random effects regression:
Ho: pooled regression model Ha: random effects model
If the null hypothesis is not rejected, the pooled regression model is favored.
The Durbin-Wu-Hausman (DWH) test is the classical test of whether the fixed or random effects model should be used. The research question is whether there is significant correlation between i and the Xj variables:
Ho: i and Xj are uncorrelated
Ha: i and Xj are correlated
If there is no such correlation, then the random-effects model may be more powerful and parsimonious. If there is such a correlation, the random-effects model would be inconsistently estimated and the fixed-effects model would be the model of choice. When the fixed-effects approach is appropriate, we can have three models‟ versions:
14
Within-groups fixed-effects model: the mean values of the variables in the observations on a given individual are calculated and subtracted from the data for that individual15.
First differences fixed-effects model: unobserved effect is eliminated by subtracting the observation for the previous time period from the observation for the current time period, for all time periods16.
Least squares dummy variables fixed-effects model: the unobserved effect is treated as the coefficient of the individual-specific dummy variable, the term17 represents a fixed effect on the dependent variable Yi for individual i, and
it can be estimated using OLS.
Considering now that random effects regression is appropriate, the model is:
In short, the empirical research is based on statistical techniques for estimating panel data model in order to show that anchors generate positive externalities by increasing the sales of non-anchor stores, and in turn, non-anchor stores pay for those benefits through higher rents. Besides, we aim to give some clues on how to achieve an efficient allocation of commercial center space.
15 The unobserved effect disappears but the intercept and any X variable that remains constant for each
individual will drop out of the model.
16 Again, the unobserved effect disappears but the intercept and any X variable that remains constant
for each individual will drop out of the model.
17 A
i is a set of dummy variables, where Ai is equal to 1 in the case of an observation relating to individual
i and 0 otherwise.
(4)
(5)
(6)
6 EMPIRICAL APPLICATION
To shed more light on the relevance and implication that externalities carry, not only for sales and rents of non-anchor stores, but also for an efficient space allocation, an empirical application is conducted. This application provides factual evidences on: a) the presence and magnitude of cross-store effects; b) the impact of these externalities on sales and rents of non-anchor stores and c) the achievement of an efficient allocation of mall space. This section describes the data, as well as the estimation procedure and results.
6.1 Data
The dataset covers information on 35 commercial centers of a multinational enterprise – Sonae Sierra18. All centers considered in our application are located in Portugal and Spain. Yearly data are provided on store and mall characteristics and performance, for 3 consecutive years: 2005-2007. It is important to underline that these 35 commercial centers, from which 24 locate in Portugal and the other 11 in Spain, were selected in order to have coherent, homogeneous and complete information during the above mentioned period. It is crucial to set a specific time in data gathering in order to keep data quality for later analysis, since tenant composition will change over time. However, given the stability of data over these three years, we decided to cluster the information for descriptive analysis and only mention the yearly data to substantiate some conclusions.
For each mall, the data include the center name, size, age, number of stores, number of anchor stores, traffic people, sales, on a yearly basis. Variables for each anchor store include: sales, size (trade area), store name, age, type, fixed base rent (defined as the part of the rent that does not depend on sales), rent (fixed plus variable), store brand recognition (defined as the number of times the same store appears in all centers divided
18 There are two main reasons for us to analyze the malls belonging to this Group. First, Sonae Sierra is
Portuguese leader in the development of shopping centers, and has rapidly and somehow surprisingly seen its business expand to six other international markets: Spain, Brazil, Germany, Italy, Greece and Romania. The company‟s upswing in value and its transformation into a highly profitable business have take place just in a few years. On the other hand, there is no reference to the company‟s business in previous studies. We believe that this fact makes the research even more interesting, especially since one cannot talk about the mall phenomenon in Portugal without taking into account Sonae Sierra‟s strategies and models.
by the total number of different anchor stores), lease start date, and fraction of mall space (defined as the size of anchor divided by the total size of the center).Variables for each non-anchor store include sales and rents.
Based on information from about 4,000 stores, this thesis uses and presents results referred to one of the most comprehensive datasets of commercial centers available for systematic analysis.
6.2 Estimation Analysis
The empirical analysis is divided into four steps, in accordance to the above theoretical issues: a) descriptive analysis of the dataset, b) estimate a regression model to explain the sales of non-anchor stores, b) estimate a regression model to explain the rents of non-anchor stores, and based on those insights, c) demonstrate how malls may achieve an efficient space allocation. Therefore, we begin with a clear and sound definition of „anchor store‟, which is crucial to a broad understanding of the conclusions that we present next. Based on the objective characteristics, Sonae Sierra defines „anchor store‟ as a unit integrated in a shopping center mix of tenants with the purpose of significantly increasing the scheme attractiveness to the customer. It comprises all or most of the following features:
Large (commonly above 600m2 Gross Livable Area (GLA));
Multiple (national or international chain – a minimum of 3 stores);
Has a strong brand (high awareness and positive response levels);
Adds significant traffic (specifically generates footfall);
Wide attractiveness: this is taken to mean it would trade successfully as a stand-alone unit;
As an ex-post test, an anchor tenant usually enjoys a privileged position in the rent and service charges.
For each mall, anchor stores are divided into six types: „Large Store‟, „Unit Store‟, „Restaurant‟, „Cinema‟, „Leisure‟, and „Hypermarket‟. To keep the terminology manageable, we refer to them as „Type 1‟, „Type 2‟, „Type 3‟, „Type 4‟, „Type 5‟, „Type 6‟, respectively, in the text that follows.
Distinguishing different types of anchor stores allow us to exploit the heterogeneity across anchors. Besides, it contributes to achieve refined conclusions related to the
efficient allocation of a commercial center space, i.e., beyond simply showing that all anchors together are compensated for the externalities generated, we identify which ones are (more) compensated and are (stronger) externalities generators. Therefore, this analysis sheds light on the connection between the externality-generating abilities of different types of anchors and the rents paid to the developer for anchor and non-anchor stores within the mall.
6.2.1 Descriptive Analysis of the Dataset
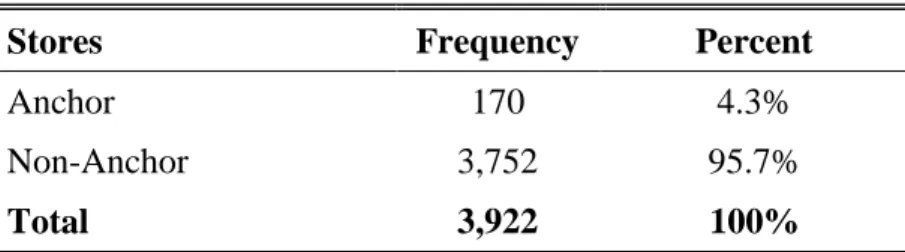
All the 35 commercial centers have, at least, one anchor store with the exception of three small centers in Portugal and one in Spain. Observing the data below (Table 4), it is clear that anchor stores comprise the minority of stores within commercial centers. However, their importance is measured by the total space provided, the volume of sales achieved, and the amount of rent paid.
Table 4. Anchor and Non-Anchor Stores
Stores Frequency Percent
Anchor 170 4.3%
Non-Anchor 3,752 95.7%
Total 3,922 100%
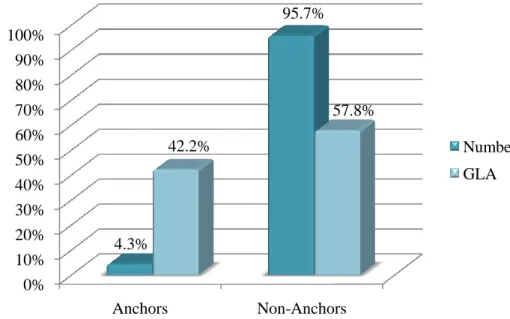
Observing Fig. 3 and Appendix 1, we can conclude that the premise: „stores which confer large external benefits on other stores should receive more space within the center‟ (Miceli et al., 1998) is actually implemented by Sonae Sierra – representing only 4.3% of the total number of stores, anchors occupy about 42% of the overall GLA analyzed.
Fig. 3 – Number and Space of Anchor and Non-Anchor Stores
Fig. 4 and Appendix 2 show that, on average, anchor stores represent 93% from the total sales of the centers, and non-anchor stores only account the remaining 7%. These discrepant level results lead us to conclude that anchors seem to draw customers while „lesser-known‟ stores benefit, for instance, from impulse buying of passing-by traffic since only a small number of customers are swayed to shop at the center by the presence of such stores. Furthermore, we can assume, in line with Wheaton (2000), that not only reputation but also the size of the store may affect its own performance. Such fact may explain why mall developers typically provide more space to anchor stores and, simultaneously, count on them to generate traffic and high volume of sales.
Fig. 4 – Mean Sales of Anchor and Non-Anchor Stores
0% 10% 20% 30% 40% 50% 60% 70% 80% 90% 100% Anchors Non-Anchors 4.3% 95.7% 42.2% 57.8% Number GLA 93% 7% Anchor Non-Anchor
On a yearly basis, we found that anchors are gradually raising their weight in enclosed commercial centers by increasing their proportion of total sales of the centers, as seen in Table 5.
Table 5. Yearly Sales of Anchor and Non-Anchor Stores
Year Anchors Non-Anchors
2005 92.9% 7.1%
2006 93.2% 6.8%
2007 94.1% 5.9%
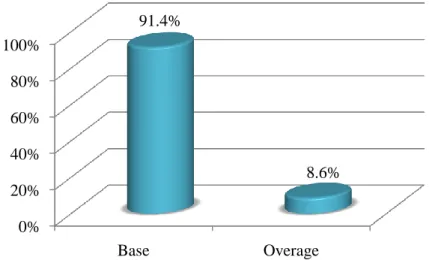
Fig. 5 and Appendix 3 depict the percentage of base and overage rent that is actually paid for anchor stores to mall developer. Accordingly, 91.4% relates to fixed base rent – defined as the part of the rent that does not depend on sales – and 8.6% to overage rent – defined as the part of the rent that depends on sales. Clearly, contracts benefit anchor stores with low rent based on their performance (sales), by increasing threshold and/or lowering sharing percentages19.
Fig. 5 – Base and Overage Rent of Anchor Stores
19 The overage rent consists of two factors: a threshold sales level and a sharing percentage. When sales
are below the threshold level, stores are required to pay only the fixed base rent. Overage rent comes into play when store sales exceed the sales threshold. In this case, the store pays the fixed base rent plus a fraction (the sharing percentage) of the store‟s sales in excess of the threshold level (Gould et al., 2005).
0% 20% 40% 60% 80% 100% Base Overage 91.4% 8.6%
In fact, the more the contract is based on fixed rent, as seems to be the case, the greater the store owners‟ incentives are20. In other words, anchor stores pay a fixed base rent and are encouraged to exert effort to maximize their own store‟s profit and to generate more traffic to other stores by paying a small portion of their sales above one high threshold level – overage rent. So, the more they sell the more they earn as their „pay for performance‟ is reduced.
Analyzing Table 6, allows us to verify that 14.1% of the total anchors do not pay any overage rent either. Besides, 11.2% do not pay any fixed base rent and, surprisingly, 3 anchors actually pay zero rent.
Table 6. Anchor Stores‟ Rent
Number of AS do not pay Percent
Base 19 11.2%
Overage 24 14.1%
Base + Overage 3 1.8%
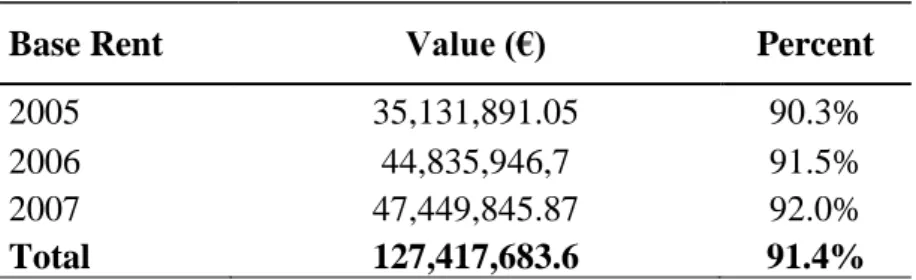
When analyzing the yearly base and overage rent of anchor stores, in Table 7 and 8 (Appendix 4, 5, and 6) we come to the conclusion that beyond the stability is the evidence of a smooth increase of the base rent and, consequently, a smooth decrease of the overage rent, in percentage terms21. This may be connected with information extracted from Table 5 as anchor stores are gaining more importance within commercial centers.
Table 7. Yearly Base Rent of Anchor Stores
Base Rent Value (€) Percent
2005 35,131,891.05 90.3%
2006 44,835,946,7 91.5%
2007 47,449,845.87 92.0%
Total 127,417,683.6 91.4%
20 Conversely, incentives to the developer increase when rents are more contingent on sales performance. 21 2005 to 2006 there was an increase in the amount of overage rent paid, despite the decrease in
Table 8. Yearly Overage Rent of Anchor Stores
Overage Rent Value (€) Percent
2005 3,762,815.25 9.7%
2006 4,157,436,58 8.5%
2007 4,110,285.86 8.0%
Total 12,030,537.69 8.6%
In line with current literature (see, e.g., Ibrahim and Galven, 2007; and Pashigian et al., 1998), our dataset reveals that anchor stores pay lower rents per square meters comparing to non-anchor stores. According to Fig. 6, anchors pay only around 18% of the total rent collected by the developer, on average. The sheer size of the subsidy may be explained by the vast externalities created by these types of stores.
Fig. 6 – Mean Rent of Anchor and Non-Anchor Stores
In addition, non-anchor stores do not have much bargaining power, due to their level results and the degree of benefits acquired from locating near the „well-known‟ stores within commercial center. For that reason, the developer sees no incentive to lower their rentals.
Considering results together, we confidently say that anchor stores, as a whole, play an important role regarding the performance of a commercial center. However, seizing the opportunity of having information grouped into six types of anchors, defined above, we are now going to study the contribution of each type. Thus, we strongly believe that it reveals important information that leads us to refine conclusions regarding to our main objective: the efficient allocation of a commercial center space.
0% 20% 40% 60% 80% 100%
Anchor Non-Anchor
17.8%
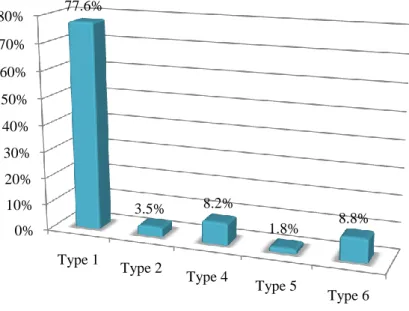
As shown in Fig. 7 and Appendix 7, Type 1 anchors account for about 80% of the total number of the overall sample, followed by Type 6 and Type 4 anchors, with 8.8% and 8.2%, respectively. These results are justified by the greater number of different brands‟ stores considered in those types. (Appendix 8)
Fig. 7 – Types of Anchor Stores
In order to take out relevant information about each type of anchor store we built Table 9. This table shows a statistical resume for all anchors and for each type of anchor defined above22. The Type 2 anchors are noticeably different from the other anchors. To illustrate, the Type 2 anchors have smaller size, later entry into the mall, and a fewer number in malls but they are among the ones that present higher volume of sales per square meter.
In contrast to the Type 1 and Type 2 anchors, the Type 5 and Type 6 anchors tend to be bigger in size and pay low rents. One compelling reason may be that most of the stores defined as Type 5 and Type 6 anchors belong to the mall developer. Thus, it may justify the providing of more space and, simultaneously, the charging of less rent.
Furthermore, the Type 6 anchor is more likely to have been in the mall when the mall was established, as indicated by the lower mean age of the mall when the anchor first arrived in it. These patterns suggest that developers rely more on Type 6 (and 4) anchors
22
Unfortunately, we do not have discriminated information about Type 3 anchors. 0% 10% 20% 30% 40% 50% 60% 70% 80% Type 1 Type 2 Type 4 Type 5 Type 6 77.6% 3.5% 8.2% 1.8% 8.8%
to establish the mall and generate externalities for the other stores. The empirical application will examine these evidences.
Table 9. Mean Values for Anchors
Anchors All Type 1 Type 2 Type 4 Type 5 Type 6
Gross livable area (m2) 2,999.047 1,768.109 471.000 3,001.951 5,764.423 14,286.733 Number of anchors in mall 4.9 3.8 0.2 0.4 0.1 0.4 Lease start date (year) 2002 2002 2003 2001 2001 2000 Age of mall when anchor first arrived (years) 3.96 3.74 12.17 3.29 3.67 3.27 Sales psm (€) 11,636.78 13,744.47 10,566.98 4,529.13 1,831.63 2,111.80 Rent psm (€) 463.85 544.55 235.96 318.41 118.32 49.69
Sample size 170 132 6 14 3 15
In order to evaluate statistically differences among population group means, the analysis of variance test (ANOVA) was performed. ANOVA provides a statistical test of whether the means of several groups are all equal against the alternative hypothesis that at least two of them differ. However, before running the ANOVA test, the Shapiro-Wilk (S-W) normality test and the Levene‟s homogeneity of variance test were applied using SPSS® software tool. The results are summarized in the following tables:
Table 10. Test of Normality
Type Kolmogorov-Smirnova Shapiro-Wilk
Statistic df Sig. Statistic df Sig.
Gross Livable Area 1 ,101 132 ,002 ,882 132 ,000
2 ,248 6 ,200* ,855 6 ,174
4 ,181 14 ,200* ,879 14 ,057
5 ,373 3 . ,779 3 ,066
6 ,144 15 ,200* ,973 15 ,898
Lease Start Date 1 ,128 132 ,000 ,954 132 ,000
2 ,319 6 ,057 ,718 6 ,009
4 ,182 14 ,200* ,956 14 ,655
5 ,175 3 . 1,000 3 1,000
6 ,251 15 ,012 ,916 15 ,165
Age_Mall When Anchor Arrived 1 ,245 132 ,000 ,860 132 ,000
2 ,310 6 ,074 ,805 6 ,065 4 ,393 14 ,000 ,704 14 ,000 5 ,204 3 . ,993 3 ,843 6 ,167 15 ,200* ,936 15 ,332 Sales psm 1 ,194 132 ,000 ,678 132 ,000 2 ,143 6 ,200* ,964 6 ,851 4 ,441 14 ,000 ,511 14 ,000 5 ,191 3 . ,997 3 ,898 6 ,506 15 ,000 ,422 15 ,000 Rent psm 1 ,138 132 ,000 ,892 132 ,000 2 ,474 6 ,000 ,569 6 ,000 4 ,166 14 ,200* ,944 14 ,471 5 ,321 3 . ,882 3 ,330 6 ,514 15 ,000 ,419 15 ,000 a. Lilliefors Significance Correction