Analysis and optimization of RHV maintenance circuits
Anthony Cleto Teixeira
Master Thesis
Supervisor at FEUP: Prof. Carlos Bragança de Oliveira Supervisor at Glintt - Healthcare Solutions, S.A.: Eng. Carlos Beco
ii
iii
Abstract
The fast growth of the companies requires its adaptation to the needs of the current market, facing various challenges in attempt to improve its performance. Responsible for maintenance circuits for more than 20 years, Glintt and its client SPMS noticed that the existing work methodologies did not keep up with the company's exponential growth.
This work was developed in IT Consulting department, consisting in the analysis and optimization of the maintenance circuits, responsible for the processing, remuneration and human resources management in all institutions of Serviço Nacional de Saúde (SNS).
The aim of this dissertation is to replace the company's current methods, by methods capable of providing a faster and more effective response to the client needs. This effective response has triggered an exhaustive study of the company's situation, encountering numerous problems in the organizational and cultural processes.
To overcome the difficulties detected, a methodology was planned, which consisted in the change of management software and the implementation of new work methodologies, updating the processes. This new approach has made it possible to standardize internal communication, to have a more general view of the project, to facilitate employee performance evaluation, to ensure that all employees follow the process outlined, as well as to manage customer requests more effectively.
The employee’s adaptation to the new software ran in conformity and Glintt’s team improved its performance. The whole process of adaptation to the new tool was closely monitored, having foreseen the transformation, to minimize the reaction to the implemented change.
iv
Dedication
First of all, I would like to thank the entire Glintt team, who welcomed me during the internship period and was available to help me at all levels.
I would also thank my supervisor, Professor Carlos Bragança for all the attention, advices and availability provided throughout the project.
A special thanks to the person who accompanied me the most during the internship, Drª Anabela Carvalho and for all the wisdom transmitted with suggestions of undeniable value. To my family, especially my parents, for all the care, support and for always providing the best for me.
v Table of contents 1. Introduction 1 1.1 Context 1 1.2 Problem description 2 1.3 Research Questions 3
1.4 Critical Success Factors 3
1.5 Report Outline 4
2 Literature Review 6
2.1 Project Management 6
2.2 Agile Project Management 7
2.2.1 Agile Project Management Tools 8
2.2.1.1 Scrum 8 2.2.1.2 Kanban 11 2.2.2 Lean 12 2.2.2.1 Lean in services 12 2.3 Kaizen vs Agile 13 3 Diagnosis 15 3.1 Glintt 15 3.2 SPMS as client of Glintt 16 3.2.1 RHV 16
3.3 Planning Life Cycle 17
3.4 Event Management 17 3.4.1 Redmine 19 3.5 Current Situation 19 3.6 Problems Detected 20 4 Methodology 25 4.1 Software migration 25 4.1.1 Jira 26 4.1.2 Confluence 26
4.2 Implementation of new methods 26
4.2.1 Lean vs Agile 27
4.2.2 Kanban vs Scrum 27
5 Results 29
vi
5.1.1 Software 29
5.1.2 The team 30
5.1.3 Key Performance Indicators 31
5.1.4 Dashboard 32
5.1.5 New method 33
5.2 Diagnosis problems vs New method implemented 34
5.3 Future Situation 37
5.4 Reaction to change 37
6 Conclusions and future work 39
Refrences 41
APPENDIX A: Layout of the RHV application 42
APPENDIX B: Fulfilment of performance indicators prior to the implementation 43 APPENDIX C: Indicators created from existing documentation 44
APPENDIX D: Data extracted from Jira 45
vii
List of Tables
Table 1: Comparison of features between the two methodologies, Scrum and Kanban. Table 2: Key performance Indicator.
Table 3: Contrast of the results of some actions taken before and after implementation. Table 4: Number of tickets created by the client SPMS.
Table 5: Indicators created from existing documentation.
Table 6: Number of occurrences received per month vs total of tickets created in Jira an Redmine.
viii
List of Figures
Figure 1: Action-research phases (Yasmeen, 2008) Figure 2: Agile Development Cycle (AltexSoft, 2016) Figure 3: Scrum practices (Rubin, 2012)
Figure 4: Scrum processes
Figure 5: Kanban board (AltexSoft, 2016)
Figure 6: Lean Thinking Approach (Ohno, 2014) Figure 7: RHV time cycle
Figure 8: Example of a Ticket
Figure 9: Event Management Process diagram Figure 10: Different types of input to trigger a task Figure 11: Different procedure to complete the same task Figure 12: Creation of three tickets to solve the same task Figure 13: Software layout of Jira
Figure 14: Software layout of Redmine Figure 15: Dashboard created in Excel
Figure 16: New method followed by the team
Figure 17: Graph of the number of tickets created in Redmine vs Jira
Figure 18: Number of tasks to be solved versus number of tasks resolved during the project Figure 19: Layout of RHV application
Figure 20: Fulfilment of performance indicators (value obtained vs goal value) Figure 21: Number of issues per day (Graph developed in Jira)
ix
List of abbreviations
ACSS – Administração Central do Sistema de Saúde (Central Administration of the Health System)
DGS – Direção Geral da Saúde (General Direction of Health) KPI – Key Performance Indicator
IAS – Internet Authentication Service
RHV - Recursos Humanos e Vencimentos (Human Resources and Salaries) SGPS – Sociedade Gestora de Participações Sociais (Holding Company) SNS – Sistema Nacional de Saúde (National Health System)
SPMS - Serviços Partilhados do Ministério da Saúde (Shared Services of the Ministry of Health)
1
1. Introduction
In recent years, we have seen an increase in the importance of services. This growth has lead to the concern of companies in sustaining the alignment between the services that really meet the needs of the clients and their organizational performance.
The constant concern for the continuous improvement of quality throughout the entire process leads to the constant adoption of management tools that allow the company to pursuit their goals.
With the purpose of suggesting possible improvements in the maintenance process, through the application of tools learned during the master's degree, a thorough analysis of the used processes and methodologies was developed. The work methods performed by the employees, which were learned over the last 20 years of Recursos Humanos e Vencimentos (RHV) existence was also studied.
1.1 Context
The present dissertation was realized in the scope of the curricular internship as the culmination of the master's degree in Engineering Services and Management of the Faculty of Engineering of the University of Porto.
The project was developed in a business environment in the IT Consulting department of Glintt. The main objective consists in the analysis and implementation of new methodologies to optimize the efficiency of the maintenance circuits. The maintenance circuits are responsible for the processing of remunerations and human resources management in all institutions of the Serviço Nacional de Saúde (SNS) and in all entities and services of the Ministry of Health. As it is a consulting service, a form of transaction between businesses, provided by Glintt to SPMS (Serviços Partilhados do Ministério da Saúde), the project fits in a Business to Business strategy.
With about 20 years of existence, Glintt – Global Intelligent Technologies – is a multinational company of Consulting and Technologies of Information, that currently employs 943 employees. It works exclusively for the health market by designing, developing and implementing integrated solutions.
The company is ruled by an Integrated Management System certified by ISO 9001: 2008: definition and implementation of policies for planning, execution, control and continuous
2 improvement. Glintt has defined for this purpose a set of processes for the quality system whose objective is the identification of Customers' requirements and the continuous improvement of their satisfaction.
Throughout the project a way to improve the circuits of one of the integrated solutions was studied, the RHV. The RHV information system manages human resources and salaries, supported by a Web architecture (IAS), having as responsible for its maintenance the SPMS and Glintt. In this way, the present project was developed at the client's premises (SPMS).
1.2 Problem description
Leader in Portugal in healthcare information systems, Glintt invests in research for more effective approaches to project development, continuously re-evaluating their methodologies. With more than 20 years of experience in developing solutions for health services, there is a notable lack of follow-up by some of the methodologies used in comparison to the company's growth. The performance of similar tasks in different ways by very experienced teams can be the cause of the scarcity of information and shared knowledge. The experience accumulated over the years by the same team is undoubtedly a factor of extreme relevance and differentiator in the market. In contrast, teams with more years of experience, usually offer a greater resistance to change, requiring a high degree of caution to plan the implementation. Over time, and with the growing number of institutions being part of the RHV application, the Glintt team was forced to recruit new members to respond to customers needs. With the lack of registration of work methodologies, the new elements created their own methodologies to reach a certain end, leading to a disorganized and heterogeneous process. The management of the entire project is done through free software (Redmine) from which the maximum advantage is not taken.
Glintt's experienced team aims to reduce the costs associated with non-quality service. Once Glintt works as a development team for their SPMS client, non-quality costs cannot be directly felt, and are only sensed when, for example, a problem is solved and reopened in the future by the customer because they feel that they are not complying with the initial requirements. Numerous factors can lead to the incorrect resolution of a task, making it necessary to carry out an in-depth analysis on the methods used and to suggest possible solutions.
3 The main idea of this project is not to completely revolutionize the way teams work. The idea is to create a strong and homogeneous structure in working methods, so that all the workers involved operate in the same way, favouring the quality of the product and the environment experienced by the teams.
1.3 Research Questions
The main objective of the project is to analyze and optimize RHV maintenance circuits. To do so, it will be necessary to analyze in detail the current management circuits of the service in question, identifying the critical points to be mitigated and the strengths to be developed and optimized. It is essential to design new circuits to be implemented in service management, to increase the efficiency of the teams involved (Glintt and SMPS).
The work carried out in this dissertation followed an action-research methodology that, according to O'brien (1998) is “learning by doing”. An action is taken in order, something is done to solve it, see how the efforts were successful and, if not enough, try again. While this is the essence of the approach, there are other key attributes of action research that we all engage daily.
These changes will imply a set of transformations, essentially related to the processes and tools of work, a good change in management is essential in order to minimize possible resistances, thus obtaining a more efficient transformation in the shortest period of time. The implementation of possible improvements in the circuits intends to suppress problems that obstruct the good performance of the organization. In this way we can summarize this problem in a question: Will it be possible to improve the maintenance circuits, to the responsibility of experienced teams, through the implementation of new work methodologies?
1.4 Critical Success Factors
Being a situation of improvement carried out directly in the tasks performed by the workers, one of the main differentiating aspects will be the approval by the employees in the acceptance of new work methodologies.
Changing the status quo is not an easy task, but the team is motivated to change. The team is aware that continuing this way does not guarantee a sustainable growth. On the other hand, we also know that change takes time and it is fundamental throughout this same process to
4 create a sense of urgency and establish short objectives to keep the team motivated. (Kotter, 1996)
However, it is important to mention that most of the improvements made do not have an immediate return on efficiency, which may take a few months to be perceived, depending on the involvement and dedication of the workers and company.
1.5 Report Outline
This work is divided into six chapters, and its structure is based on the previously presented objectives. In the first chapter, an introduction is given where the whole project to be developed is briefly explained.
In the second chapter, the Literature Review describes the project management as well as the methodologies to be approached throughout the work.
In the Diagnosis of chapter three, a small presentation of the company Glintt and its client SPMS is developed, as the identification of problems detected in the ticket management process.
In the fourth chapter, Methodology, a comparative analysis of existing approaches and the adopted approach is made.
The results described in the fifth chapter suggest the improvements implemented, a contrast between the results obtained before and after the implementation of improvements, the development of performance indicators and, finally, the resistance to change felt throughout the project.
Finally, in chapter six, conclusion, a brief explanation is given of how the objectives and the adjacent results have been achieved, and what are the prospects for a future research.
The structure of this report can be compared to the “Detailed action research” (Figure 1) of Susman (1983).
5
Figure 1: Action-research phases (Yasmeen, 2008)
In this scheme the author presents an elaborated list divided into 5 phases, beginning with a diagnostic phase, where the problem is identified. Then a data collection is made and a plan of action is defined. After the action plan put into practice, it is evaluated by looking at the consequences and recording the lessons learned through the implemented strategy. (Yasmeen, 2008)
6
2 Literature Review
In this chapter the review of the state of the art will be represented, focused on the methodologies used throughout the project that supported the defined study objective. It will provide an overview of the knowledge obtained through research of other projects and studies in order to support and conclude which are the techniques that best fit this project.
2.1 Project Management
According to the Project Management Institute, a project is unique, it is not a routine operation, but a specific set of operations designed to accomplish a goal, and temporary, in that it has a defined beginning and end in time. (PMI, 2013)
“Project Management is the application of knowledge, skills, tools and techniques to project
activities to meet the project requirements.” … “All the projects must be expertly managed to deliver the on-time, on-budget results, learning and integration that organizations need.”
(PMI, 2013)
The management of projects requires a continuous effort, motivated by the existence of factors such as: constant negotiation throughout the work involved in the project, putting in conflict aspects such as time, cost, quality, risk and deadline; stakeholders with different expectations and needs; and identification of requirements. It is expected that the processes are of an iterative nature, as we move forward through a life cycle of a project, the better one is able to manage it.
One of the aspects that makes the management of a project with recurrent supports difficult is the constant change of its priority over other projects to develop. It is easy to understand that there may be many factors that can lead to prioritization of a project, for example to avoid remuneration due to a non-responsive option. For this to happen in an effective way it is necessary that all stakeholders stay informed about the changes to be implemented.
To manage the smooth running of a large project, there is a need for a support tool, that streamlines the whole process since the planning until the organization of the resources needed to achieve a task. To guide this operation, there is a project manager in charge of defining the goals and objectives of the project, dividing the tasks by his team and also working as a supervisor in order to ensure quality control by meeting the requirements previously received.
7
2.2 Agile Project Management
With the constant changes in the projects required by customers, the software industry was forced to change its project management styles, adapting them to the needs of its consumers, and could not continue to employ waterfall type methodologies, where the requirements of the client were followed sequentially, and their changes implied large monetary and time losses.
“Product development teams are facing a quiet revolution in which both engineers and managers are struggling to adjust. In industry after industry customer demands for continuous innovation and plunging cost of experimentation are signalling a massive switch from anticipatory adaptive styles of development.” (Highsmith, 2009)
When we talk about Agile software development, this implies that the delivery of a project is divided into parts to smooth its control. Agile is an iterative approach to software delivery, implying incremental creation of the software from the beginning. Through Agile, it is possible to find and correct errors in the project without having to restart the entire procedure, reducing costs associated with time losses in project changes.
Agile Project Management aims at obtaining high quality results through providing customer value and the adaptation of the team to the current business circumstances and it provides more flexibility in error detection throughout the project stages, since the teams work in parallel in the same project, being only focused on small parts of the project having a shared view of the product.
An agile project is usually constituted by a product backlog (list with all the tasks to be developed), a sprint backlog (list of tasks to be performed organized by priorities), a sprint cycle (includes the planning, release, development and design of the tasks) and finally the final product (Figure 2).
8
Figure 2: Agile Development Cycle (AltexSoft, 2016)
A key aspect of an agile framework is the ability to adapt to different situations through a balance between structure and flexibility. It is essential to maintain throughout the emergence of new projects a common framework, some common guidelines, a few standard practices, and, of course, a set of common values.
2.2.1 Agile Project Management Tools
Agile has at its disposal a vast amount of methodologies and techniques that follow the principles discussed above, but only the two most used will be mentioned in this dissertation, Scrum and Kanban. Each technique has its own distinct area and characteristics, existing some project, cultural and governance factors that will indicate which practice fits better in each organization
“In a large organization, not every project will be agile. Determining what projects do fit in an agile profile, and how agile practices should be adapted for different types of projects, is an important portfolio management topic.” (Highsmith, 2009)
Regardless of the tool that is used, an agile project intends to homogenize its activities in order to achieve the same results. According to Jim Highsmith, a repeatable process is one in which doing the same thing in the same way produces the same result. One that is reliable delivers regardless of the impediments thrown in the way – reliability means constantly adapting to meet a goal.
2.2.1.1 Scrum
Scrum is one of the well-known agile approaches for developing innovative products and services, focused on the empirical feedback loops to adapt to the complexity and unpredictability typically found in software development.
9
“Scrum is not a standardized process where you methodically follow a series of sequential steps that are guaranteed to produce, on time and on budget, a high-quality product that delights customers. Instead, scrum is a framework for organizing and managing work. The scrum framework is based on a set of values, principles, and practices that provide the foundation to which your organization will add its unique implementation of relevant engineering practices and your specific approaches for realizing the scrum practices. The result will be a version of scrum that is uniquely yours.” (Rubin, 2012)
The origin of the name Scrum was borrowed from the sport of Rugby, where it refers to a way of restarting a game after an accidental infringement. According to Kenneth S. the history of Scrum can be traced to a 1986 Harvard business review article, “the new new product
development game” (Takeuchi, 1986) where the authors describes how companies such
Honda produced world-class results using a scalable team-based approach to all-at-one product development.
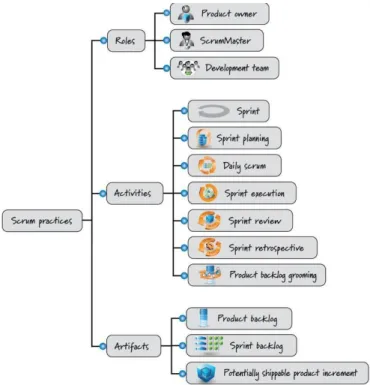
As a whole, a scrum is a set of roles, activities and artifacts, with feedback that remains consistent throughout the project (Figure 3).
As roles we have the product owner, usually a customer or stakeholder responsible for a global vision of the product and providing timely feedback on the job done; the development team, is a self-organized group that is responsible for meeting the goals of each sprint; working with both, the product owner and the development team, the scrum master facilitates the completion of goals eliminating obstacles that might prevent the team from working efficiently. The main artifacts are the product backlog, Sprint Backlog and the product increment. The process is formalized through a number of activities such as the sprint execution, sprint retrospective, sprint review and others. The type of activities carried out in Scrum varies according to the company's philosophy.
10
Figure 3: Scrum practices (Rubin, 2012)
This methodology begins with the creation of a prioritized list of features and other capabilities needed to develop a successful product, the product Backlog. Next some features are selected from the Product backlog, which the Scrum master wants to see fulfilled in the next project. After selecting the features and set some priorities of the requests acquired and the supports that are coming, begins the sprint backlog. In this phase the sprint cycle begins, where the team starts to execute the requests. It is important to update the plan as time goes by, removing predictable errors in the process, achieving the desired product increment (Figure 4).
Figure 4: Scrum processes
This methodology is generally used by teams that have a deadline for the output of the product, giving more importance to meeting the deadline with defined tasks than what is in it.
11
2.2.1.2 Kanban
The origins of Kanban are derived from the Toyota production system, as a simple visualization-based card system used as a production control method. It is a methodology quite similar to Scrum, but doesn’t have a target date that the team is working towards. This methodology fits essentially small support teams and services that usually have a list of work that is constantly updated with new items, which can be prioritized, for which, the team works as quickly as possible. In software maintenance it is very usual that teams constantly receive new orders, being important to reduce multitasking, which is seen as a cause for the decrease in efficiency. It is important to say that this methodology can be controversial in some companies because it eliminates fixed-length iterations, may eliminate estimation time and can minimize planning.
“Kanban introduces a signalling system into the scheduling process in which a limit is set on WIP (depending on resources), and new work (stories or other work items) is introduced as in-process work completes. Work is “pulled” through the system (as an item is completed it pulls the next item of the backlog).” (Highsmith, 2009)
Therefore, the development process offers a faster turnaround, more flexibility and clear objectives.
During the process, a task can go through different phases, such as testing or development, having variable time periods according to the work required by each task. The visualization of a Kanban board can be represented by sticky notes, in a whiteboard or in online tools like Jira, as we will talk later. In a Kanban board (Figure 5), the issues with the highest priority should be easy to identify.
12 The Kanban tickets are similar to user stories from Scrum, so they are work items. Normally the bigger work items are progressively divided in small ones, more independent, in order to be more easily manageable and have an estimate time to achieve the sprint.
It is important to note that in Kanban, there is no well-defined plan for what will be ready next month. Instead of that, it is more relevant that all the Kanban tickets (requests) are organized according to their priority and teams work as quickly as possible in its resolution.
2.2.2 Lean
This methodology had its first appearance in the Japanese market in the 1980s keeping in
mind the improvement of efficiency of Toyota manufacturing processes.
“In the summer of 1982 we had a revelation. We were visiting a series of companies in japan, trying to understand why they were winning in global competition. Then we encountered Toyota. We quickly realized that this company was quite different from the others we had seen. Toyota’s success lay in brilliant management of its core processes: the series of actions conducted properly in the correct sequence at the right time to create value for customers.”
(Womack and Jones, 2015)
Lean methodology focuses on the continuous improvement of core processes through elimination of waste, which is the root of unprofitable activity. Implementing this type of philosophy in a company can be a very time consuming and demanding process, however, companies that have applied this philosophy correctly have obtained quite satisfactory results. Lean is seen, nowadays, as a huge competitive advantage for companies as it is surprisingly difficult to copy.
The application of Lean principles in this type of project, that englobes software development, was introduced by Mary and Tom Poppendieck (2003) where they refer eight basic principles: Eliminate waste; Amplify learning and create knowledge; Decide as late as possible; Deliver as fast as possible; Empower the team; Build integrity/quality in and See the whole. As such, a lean Agile software development is an iterative and incremental methodology.
2.2.2.1 Lean in services
To introduce the concept of lean into services it is necessary first to realize what a service is. A service is something intangible, something that is usually produced and consumed at the
13 same time, it is something heterogeneous in the sense of being complicated to create two equal services and it is something that cannot be stored to be sold or consumed in the future. So sometimes applying Lean methodologies in services may seem contradictory but it is not how it will be seen later.
In theory, lean methodologies are governed by the same principles, but in practice there are no two equal situations, and there is a need to adapt the methodology to the existing scenario as it happens in service or manufacturing firms. Applying this type of methodologies does not always cause the desired impact in companies, because to obtain the expected result it is sometimes necessary to have a cultural and organizational change of the company. The organizational changes imply continuously improve, which is also classified as Kaizen. This methodology has gained many fans, ensuring the continuous improvement of processes through small increments.
2.3 Kaizen vs Agile
It is no surprise that continuous improvement is at the core of Agile.
According to Shiba (1997), continuous improvement implies the involvement of all stakeholders in the organization so that there is a constant and systematic search for improvement of products and business processes, thus presupposing constant changes in the organization's habits.
Like Shiba, the agile manifesto talks about the change saying that “both responding to it
instead of blindly following the existing plan and embracing changing requirements. it talks about empowerment and motivation-creating self-organizing teams and trusting them to get the job done. It talks about continuous attention to excellence and about removing waste-maximizing the amount of work not done. And of course, it talks about meeting at regular intervals and reflecting on how to become more effective (improve, kaizen) and then tuning and adjusting behaviours accordingly”. (Apke, 2015) These values that incorporate Agile
principles meet the previously mentioned in Kaizen philosophy.
In addition to the focus in change of the existing methodologies, there is also a relationship between them in the delivery of the products. In the same way that agile constantly delivers product increments, Kaizen philosophy does a constant delivery of small, cumulative, evolutionary improvements.
14
“In both cases, product increments and small improvements are delivered by a cross-functional, self-organizing team that measures progress as value delivered- meaning that, in kaizen, it is important that we measure actual improvement beyond the effort, test or even failures that we might incur during improvement process.” (Medinilla, 2014)
Another example of the relationship existing in Kaizen vs. Agile is the retrospective made in agile environments. Retrospective consists in the identification of impediments by a team, and how to remove them. Impediments are understood to be anything that prevents a team from achieving its objective, and the removal of those impediments is directly related to the team's ability to identify the impediments root cause, suggest correction plans and commit to the execution of those improvement plans.
Kaizen shows us that all the work activities are processes and that all the processes can be improved, and is therefore often associated with lean methodologies, but Kaizen philosophy is more focused on developing people’s capability to take the right decisions.
15
3 Diagnosis
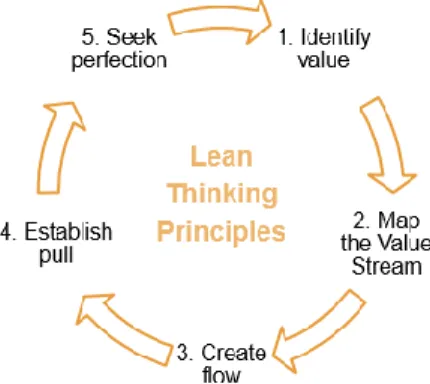
As previously mentioned, the main objective of this project is the analysis and optimization of the maintenance circuits of RHV. This chapter undertakes to carry out an analysis of the current situation of the company, to be able to verify in the future the techniques referred to in literature review which best fit the context of the problem. For this, we will follow the lean thinking approach (Figure 6), starting by identify the value of our service for the client. After recognizing our value to the customer, a design of the entire process is done, in order to identify failures. Then an execution plan is developed, so as to culminate the existing faults, aiming at perfection.
Figure 6: Lean Thinking Approach (Ohno, 2014)
“In lean thinking, minimizing the wastes of handoff, waiting, WIP, information scatter, and underutilized people is critical; cross-functional, cross-component feature teams are a powerful lean solution to reduce these wastes.” (Larman, 2009)
3.1 Glintt
Founded in 2008, Glintt - Global Intelligent Technologies is the result of the merger of two large companies, ParaRede - Tecnologias de Comunicação S.A. and Consiste, that acted in health area having a lot of accumulated experience. In 2015, Farminveste (SGPS controlled by the National Association of Pharmacies) launches a takeover bid for Glintt of which it already held 49%. With all the background of the company's formation it can be said that it is a company with more than 20 years of experience in the health area.
Nowadays Glintt has at its disposal around 943 employees working in three different continents such as Europe, Africa and America in the sectors of Health, Banking, Telecommunications, Commerce, Industry and Public Administration.
16 The activity of Glintt is based on three fundamental areas, namely the area of pharma, Glintt Farma, which acts exclusively for pharmacies providing all kinds of solutions; the consulting area, Glintt ITC, which presents technological consulting solutions in the financial, telecommunications and public sector; and in the area of health, Healthcare Solutions, which works with health care providers, hospital pharmacies and bodies of the Ministry of Health.
3.2 SPMS as client of Glintt
Glintt has committed to its SPMS client to provide RHV corrective, preventive and evolutionary maintenance services, as well as application support staying in the premises of SPMS.
In addition, Glintt also committed itself to the passage of system knowledge to the SPMS internal teams, and the planning of the developments to be executed within the estimated and validated periods of SPMS delivering and registering the updated documentation.
3.2.1 RHV
RHV is an application tailor-made by Glintt, for its client SPMS. Responsible for the processing of remunerations and human resources management, RHV maintenance is in charge of Glintt and SPMS, as previously mentioned (Appendix A). This application has as main functions the following:
• Management of personal, academic and professional data of all workers under the Ministry of Health;
• Processing of salaries;
• Interfaces with various applications that allow the import and export of data; • Audit Module;
• Alerts of non-conformities, such as registry errors.
RHV, developed in 2000, underwent several technological improvements in 2012, with the intention of improving the maintenance circuits.
17
3.3 Planning Life Cycle
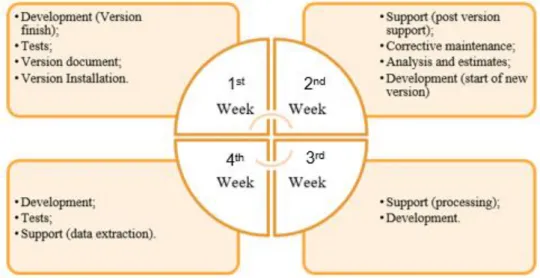
Responsible for delivering a monthly version and monthly processing, the "Month" is defined as the RHV cycle time (Figure 7). Cycle time is a time measure, that starts when a featured is open, in the Backlog, and ends when the feature is accomplished and goes to the column "done".
However, despite the existence of planned monthly tasks, their dominance changes according to the associated priorities, also changing the distribution of effort and focus by the Glintt team.
Figure 7: RHV time cycle
It should be noted that in the initial phase of each cycle, in the 2nd week, there is a lot of support from the institutions. This is normal since the new version was installed the previous week and the institutions are not yet familiar with the new version.
3.4 Event Management
The project management methodology, adopted by Glintt, is based on the set of practices recommended by the Project Management Institute (PMI). The PMBOK is an internationally recognized standard and includes five basic Project Management processes: Initiating, Planning, Executing, Monitoring and Controlling, and Closing.
According to the characteristics of each project, the processes are defined to allow and ensure its good performance and to control the quality of the results achieved, according to the standards defined by the client and by the Quality Management System of Glintt.
18 The process of event management is composed of the following phases: Register, Analyse, Decide, Formalize and Inform. Whenever there is a change request, corrective, preventive or improvement actions resulting from these activities must be recorded in Redmine, Event Management Tool, for further analysis and processing by the project team.
One aspect that must be taken into account is that the management of the project should be flexible in order to facilitate adaptation to different situations, since what makes it so difficult to manage this type of processes is the constant change of priorities of the tasks to be developed.
Throughout the project and according to the control points defined in the planning, each delivery must be validated and accepted by the customer.
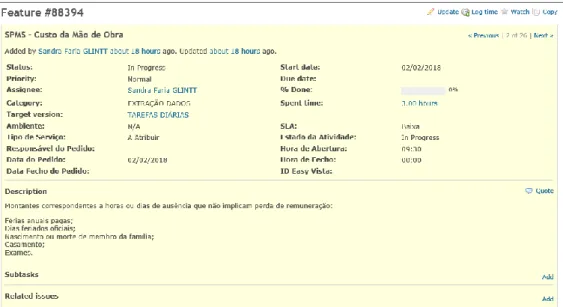
According to the functions previously seen, performed by the RHV, can be generated orders of different types: • Clarifications; • Support; • Errors; • New features; • Data Extractions.
These orders will always trigger the creation of a ticket that will indicate the current state of the order (Figure 8).
19
3.4.1 Redmine
Redmine is a free and open source software that allows to carry out all the management of a software project. Through this application it is possible to manage projects and subprojects that can be associated, create documentation of what is relevant, manage deadlines through a Gantt chart and also use a forum where discussions can be held on how to improve the project in question.
Having a software development project in hand, it is crucial to have a software that allows to manage all stages of development, whether it is to control deadlines or manage documentation. Currently there are numerous applications with the same purpose in the market. Glintt opted for the application of Redmine when it began to manage a large number of projects, considering it the best approach.
After interviewing employees, analysing the tool and exchanging opinions with users of the same tool in other contexts, some disadvantages were detected. For the project team the most notorious disadvantages were: the difficulty of searching for filters, outdated look, poor visualization of a project in general, the difficult handling of management documentation, not very intuitive, not possible to start an issue from project and select subproject to which issue is related and the building of reports was limited to filtering options.
3.5 Current Situation
To support the entire process involving the management of an order, Glintt provides to SPMS client support team, a web access tool, the Redmine. There is also a client tool available to Glintt that can also be used to articulate the communication of requests.
“This is the sequence of actions (the process) needed to bring a good or service from concept to launch (through the development process) and from an order into the hands of the customer (through the fulfillment process). Challenge every step in these processes to see if they really create value for the customer. Eliminate steps that don’t.” (Womack and Jones,
2015)
To demonstrate in a clear and detailed manner all the activities performed in the event management process, a diagram was created (Figure 9). This will be a useful tool for applying lean concepts. This type of diagram always begins and ends with customer involvement.
20
Figure 9: Event Management Process diagram
In a first phase (Register) the client registers the request in the support tool the request, indicating the category, severity and additional information that he thinks relevant. Then the team reviews the request and measures the impact of its resolution (Analyse). In the decision phase the client typifies the issue according to its nature: error, change or request for new functionality. According to this classification, a decision is made on the actions to be taken on the request: accept, reject or defer the request. If the decision is not accepted then it will be discussed at the next meeting with the client. If the decision is accepted then we go to the formalization phase where the project manager is in charge of adding elements to accomplish the task. In a final phase, regardless of the decision made on the request, the stakeholders are informed about their resolution / situation.
3.6 Problems Detected
Having completed the process design identifying all its activities, a detailed analysis of each activity was followed in order to identify problems and critical points that do not add value to the service. This analysis was developed through interviews with employees and observation of the work performed, having detected the following problems:
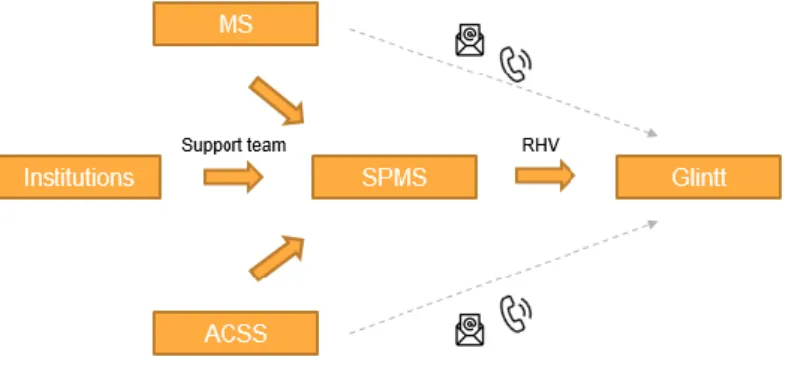
- Different triggering of the process;
One of the problems noticed, is immediately triggered in the creation of the process, the way the requirements for a new task are requested. There are 4 different types of
21 input to trigger a task, as shown in the Figure 10, and can be created by different entities: Institutions (hospitals, etc), MS (Ministério da Saúde), ACSS (Administração
Central do Sistema de Saúde) and the SPMS team itself, responsible for maintaining
RHV. Generally, requests are made via web to the support team who creates and forwards the request to SPMS. However, throughout the project it was noticed that the requests that were made by the ACSS and the MS were made directly to the SPMS per call or mail, causing a certain inconstancy in the normal course of the process. The fact that there are poorly defined channels to perform the same task makes the process not homogeneous, where the occurrence of errors becomes more likely.
Figure 10: Different types of input to trigger a task
- Lack of a monthly meeting;
The team does not have a clear date to hold a monthly meeting. For each released version, a date must be defined to do the version planning and to put the whole team abreast of the situation, setting goals and deadlines to be met.
- Different channels of communication throughout the process;
Unfortunately, communication failures are a very present reality in companies. It was noted that when there was a very basic support to be solved, the customer would say directly (speaking in the room) to an employee to perform the task as soon as possible without first registering the request. The use of different channels as a mean of communication leads not only to the deconcentration of the team in question but also to faults in the recording of information.
- Late requirements made by the customer;
As soon as a feedback of a task is given to a customer, he will know his own request better, realizing that he can improve it, thus taking advantage of small orders. An example of this problem is when the client wants a new requirement for the version to
22 be upgraded. Ideally this type of requirement should be defined in the monthly objectives (objectives defined at the beginning of the month). These requests will be delivered late, leaving the company with no time to conduct final tests. This can lead to new supports to solve small problems that were not detected in tests.
- Different procedures to carry out the same activity;
Another problem detected was the different methods performed to achieve the same task, as we can see in the figure 11. When some data, such as the hours spent on a particular activity by different employees, were analysed it was noted that the values did not make sense. Some team members were asked how they performed a given task, getting different answers to that question resulted in worthless documented information. In this way some of the existing indicators were verified and it was concluded that these indicators did not measure anything (Appendix B), since for them to be viable the information would have to be correct.
Figure 11: Different procedure to complete the same task
- Customer requests that are not explicit;
Probably one of the most recurring and costly problems, the traditional history of customer orders that are not properly stated. Sometimes even the customer cannot know what they want, making it difficult to solve the task. Resolving a task that is not properly explained may lead to an incorrect solution leading to a recurrence of the problem, inducing to a successive loss of time.
- Omission of information;
Certainly, the most difficult problem to solve, since this is not a change at the organizational level but a change at the cultural level. When dealing with teams that belong to the same project for more than 20 years ago, the cultural issue is always present. Sometimes a kind of competitiveness between the companies (SPMS and Glintt) was noticed, omitting certain information, which harmed the good performance of the organization as well as the good functioning of the company (which can generate a bad atmosphere in the room).
23 Also associated with customer culture, some elements have a high responsibility for decision making, sometimes not sharing their opinion with the rest of the team, causing loss of knowledge and centralized information, therefore creating another cultural level problem.
- Interruption to the resolution of tasks by the appearance of supports;
As previously mentioned, the communication channels are not well defined and there is sometimes direct communication (speaking) which disturbs the good functioning of the room. It was noted that sometimes when the team members were working and there was urgent support, their work was immediately interrupted, hampering the smooth operation and valuing the multitasking that as previously seen is an enemy of the software industry. This problem can lead to the poor performance of the team as the constant interruptions deconcentrate the workers.
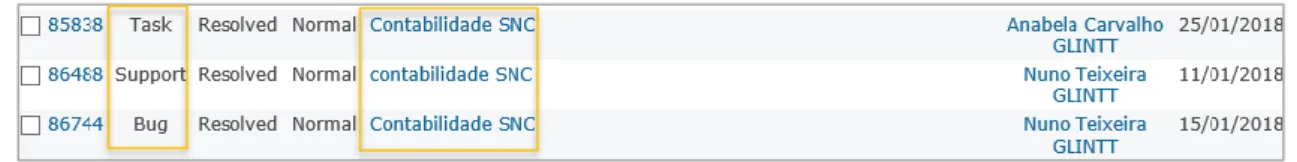
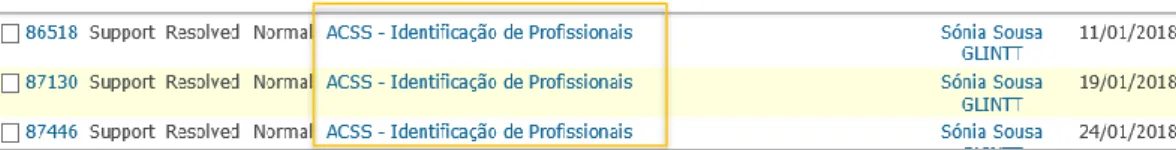
- Creation of different tickets for the same incident;
The performance of a task may involve its division into different parts and may pass through different team members. As seen in the agile methodology, projects are often fragmented into smaller parts so that there is greater involvement of the team and favouring good performance. This strategy triggered in the team some disorganization as it can be seen through the following example: when a task is associated to an employee, he creates the ticket and begins to solve. It is normal that the employee to whom the task was assigned does not complete it alone by transferring the same task to another employee (who will, for example, conduct the tests). What happens in these situations is often that the employee who will continue the task previously started, creates a new ticket. This will result in a high number of tickets, as shown in the Figure 12, disorganizing the management of the documentation and making it difficult to analyse the performance of the team.
Figure 12: Creation of three tickets to solve the same task
- Mismanagement of documentation;
Document management must be accompanied from the beginning of a project and can serve as a knowledge base or a history. This problem does not arise alone, the
24 mismanagement of documentation comes from other problems explained earlier such as the creation of different tickets. This problem will have the effect of a snowball, as the project moves forward with disorganized documentation the situation will get considerably worse over time, affecting other types of processes such as performance indicators.
- Limited project management tool;
Not directly linked to activities, another problem is the tool used by the team for project management, Redmine. This tool, as previously seen, has some disadvantages, being the most notorious the difficulty of searching for filters, poor visualization of a project in general, and the difficult handling of management documentation.
After identifying the existing problems, the diagnosis phase is finished, ending the collection and analysis of data about the company's processes. Given that it is necessary to find the methodologies that best fit the problems detected, to solve them in the most effective way.
25
4 Methodology
In this section the different possible approaches were analyzed, justifying their choice. Once the situation is analyzed, it heads towards the practical part, the phase of change.
Before implementing any change in the organization, it is essential to demonstrate the operational changes that will be imposed on the workers, as well as explaining them exactly how they can optimize their performance.
4.1 Software migration
Having developed the study of all the data collected during the diagnostic phase, and of all the problems detected, we proceed to a possible solution to improve team performance. Over the years, and without documentation previously kept, the know-how of each was passed by spontaneous explanations. This passage of knowledge, in a long term, resulted in the resolution of similar tasks in different manners, leading, for example, to the classification of different tickets in solving the same type of problem.
To solve this problem, it was suggested to install a new application for project management, to "re-teach" working methods to all team members, having a well-structured knowledge base (documentation management). With this solution it was understood that it might be good to solve most of the problems, and a driver for the resolution of many others.
Achieve the migration of the software triggered a study of the possible solutions available in the application market for project management, using interviews with employees of Glintt. Implement the new software in a smooth way, implied a preparation plan for the change. With the introduction of the new tool, there was a need to migrate data from one software to the other.
The data migration would be done quickly and outside the working hours so as not to disturb the proper functioning of the institution. After the data transition, the collaborators will perform some tasks in the new tool to adapt to it. Naturally there would be collaborators who had an instant adaptation, and others who will need more follow-up. It is important to note that throughout the phase of change the workload has remained, to see the team’s adaptation.
26
4.1.1 Jira
After the suggestion of improvement through the implementation of a new tool, a more in-depth research was developed, having found the software Jira. Created by the Australian company Atlassian, Jira is a commercial software that allows the monitoring of tasks and monitoring of projects ensuring the management of all its activities in one place.
This Software development tool is widely used by agile teams since it supports the Kanban or Scrum methodology, helping the teams to plan (create issues, plan sprints, and distribute tasks across the software team) and track (prioritize team’s work with complete visibility) the project.
In this way the Jira tool was considered to be ideal to drive a Kanban project, prioritize the work, visualize the workflow, and minimize work-in-progress to prevent the team from being overloaded.
In addition to the management, this software facilitates the creation of performance reports making it easier to choose the desired filters. Jira also allows association with other tools that a user may find important. As we have seen throughout the project there is a notable lack of documentation management. Wanting to get the most out of the tools, the team agreed to associate the software Confluence with Jira.
4.1.2 Confluence
The software confluence allows the management of documentation in one place. Connected with Jira, Confluence allows access to information about the development work with automatic linkage, allowing the fast creation of reports, graphs and estimates.
Confluence gives the power to create meeting notes, project plans, product requirements, and more. Knowledge management thus becomes easy to access and organized, guaranteeing the entire team a well-defined knowledge base and history.
4.2 Implementation of new methods
Once the appropriate software has been chosen, it is vital to begin using it properly to ensure the elimination of errors that have occurred in the past. After choosing the software, we followed a more detailed analysis of the methods to be developed throughout the project, comparing them.
27 This work implied observation of the work done by the workers, interview of operators, consultation of documentary support and participation in meetings of improvement of standards.
To ensure a good learning of the team, it is important to emphasize the cooperation of all the employees, as well as the commitment of the company that lost part of their time to participate in a lecture about Jira and Confluence.
4.2.1 Lean vs Agile
Many of the ideas of the agile movement first arose within lean manufacturing, which began in the automotive industry in Japan in the 1980s. One of the fundamental tenets of lean manufacturing is the systematic elimination of waste; that is, any activity that doesn’t deliver value to the customer. One way to streamline projects (doing fewer things, doing the right things, eliminating the bottlenecks) involves differentiating between delivery activities and compliance activities and applying appropriate strategies to each. (Highsmith, 2009)
One of the fundamental tenets of lean methodologies is the reduction of the existing timeline from the arrival of a requirement to the delivery of a solution, by removing activities that do not add value to the product. For this, different strategies are used in order to make the process more efficient, as agile methodologies.
In addition to use the agile methodologies, the team will always keep in mind the philosophies of lean thinking to guarantee the reduction of the risk of failures in the project as well as its good performance.
4.2.2 Kanban vs Scrum
Keeping in mind the continuous improvement of the work performed by the teams, it was contrasted which of the Scrum or Kanban methodologies best suited the project. Kanban and Scrum share some of the same concepts but with very different approaches. In order to achieve the desired result, a study was made of both methodologies comparing some characteristics (Table 1) relevant to this project, of which: delivery frequency, launch methodology, planning, roles and requirements changes.
28 Table 1: Comparison of features between the two methodologies, Scrum and Kanban.
Having developed a more in-depth comparison of the methodologies, it was obtained as conclusion that for this type of project only the Kanban methodology fits. When constant support appears, the scheduling of tasks necessarily has to be flexible. Therefore, there was a focus on the Kanban methodology for future implementations. However not forgetting some of the concepts followed in Scrum such as holding small daily meetings to see the state of play, that we will try to implement as well. In this way we will try to associate in a philosophy the best of both approaches creating in a certain way a “Scrumban” methodology.
By implementing new work methods coupled with the use of a new management tool, the team thinks they have discovered the best way to solve the company's problems. Having thus taken the decisions, we follow for their respective implementation and training.
Feature Scrum Kanban
Delivery frequency
Regular fixed length sprints Continuous flow
Release methodology
At the end of each sprint if approved by the product owner
Continuous delivery or at the team's discretion
Planning Robust and strict Flexible
Roles Product owner, Scrum master, development team
No existing roles. Some teams enlist the help of an agile coach.
Change of requirements
Teams should strive to not make changes to the sprint forecast during the sprint.
29
5 Results
The main purpose of this project aims to create a successful methodology, which satisfies the company’s goals, and a cultural change of the whole team, breaking traditional habits long rooted. All the changes or decisions made throughout this chapter were made jointly with the team and the project manager.
Realizing that the core processes could be positively differentiating to achieve satisfactory results, it was given more emphasis to them, perceiving which methodologies were underlying them. Once the adjacent methodologies were understood, the processes were rethought in order to reduce costs and work times.
Throughout this chapter will be demonstrated the results achieved, comparing with the methods / processes used before the implementation of improvements.
5.1 Improvements implemented
After analysing the problems detected the most viable solution to be taken, together with the team responsible for development, was the implementation of a new application for the tickets management. In this way we will be able to eradicate the different know-how of the collaborators, standardizing all the existing processes, as well as eliminating the limitations that the previous software presented.
The improvements of management processes involve the monitoring, measurement and analysis of the processes developed to control and make the necessary adjustments.
An aspect that would reflect the continuous success or not of the implementation, is the uniformity and standardization of the processes. Once the strategy is implemented, it is necessary to eliminate the appearance of new practical approaches of the processes. to avoid the occurrence of failures.
The improvements made during these five months were implemented at different levels of the company from the teams to the software used.
5.1.1 Software
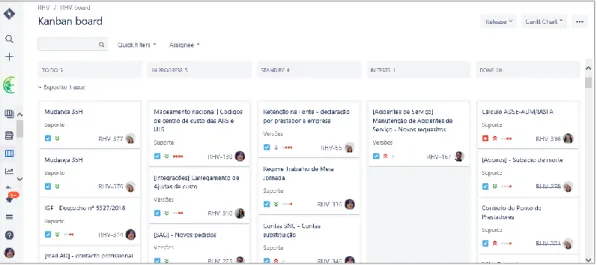
At the software level there was a radical change, and perhaps the most relevant to the success of the improvement implemented.
30 All the ticket management started to be developed in Jira, allowing an instant visualization of the course of all the activities to be developed, as shown in Figure 13. On the other hand, the entire knowledge base previously used in Redmine (Figure 14) was transferred to Confluence, allowing access to the entire history in a single database shared with all elements. With the appearance of new software, all processes have been redesigned in order to standardize all the activities to be performed.
Figure 13: Software layout of Jira.
Figure 14: Software layout of Redmine.
5.1.2 The team
All these improvements were implemented in a single team of Glintt, the team responsible for the maintenance of RHV. This team is characterized by its huge experience in IT consulting in heath area.
31 Throughout the project were implemented different strategies that improved the performance of some activities. For about 2 months, the team worked with less one element, who was absent. Bridging the exit of the element implied an adjustment of the activities developed. The performance achieved by the team remained in relation to previous months, which was only possible due to the good adaptation of the team to the new improvements implemented.
It is important to emphasize the cooperation of all the employees, as well as the commitment of the company that lost part of their time to participate in a lecture about Jira and Confluence. To ensure a good learning of the team, an ongoing dialogue with employees was made. A task that was facilitated once we shared the same room. Throughout the dialogues with the employees, an increasing appreciation could be felt towards the job at hand. Nevertheless, this is an extremely gradual stage of the process and runs until the date of writing this document.
5.1.3 Key Performance Indicators
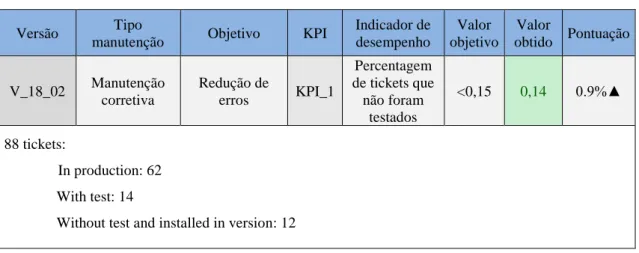
After an in-depth analysis of the existing indicators, it was obvious that some results of the indicators presented did not correspond to the performance of the team. This happens to the poor management of the documentation. For this, new indicators were created (Appendix C), together with the project manager. An example of a created indicator is shown in Table 2, which would be presented in a dashboard in the future, accompanied by a justification of the result achieved in the indicator against the target value.
Table 2: Key performance Indicator.
Versão Tipo
manutenção Objetivo KPI
Indicador de desempenho Valor objetivo Valor obtido Pontuação V_18_02 Manutenção corretiva Redução de erros KPI_1 Percentagem de tickets que não foram testados <0,15 0,14 0.9%▲ 88 tickets: In production: 62 With test: 14
Without test and installed in version: 12
The tickets fixed in the non-test version can have a counter-productive impact. Errors can be generated, which will only be detected after the version implementation and may lead to a joint discontent among institutions.
32 This is an example of a performance KPI, along with a brief explanation of what it might entail if it is negative.
To ensure maximum efficiency in the performance evaluation process, an association was made between the tools, extracting the data from Jira to Excel with the desired filters (Appendix D), nourishing a symbiotic relationship. Through the new tool it is possible to have a more focus view of indicators of the project. But to have an overview of the whole process it is necessary to extract the data to the existing dashboard in Excel. The indicators created in Excel started to play a supporting role, serving to develop reports and allow a more detailed visualization of each indicator.
5.1.4 Dashboard
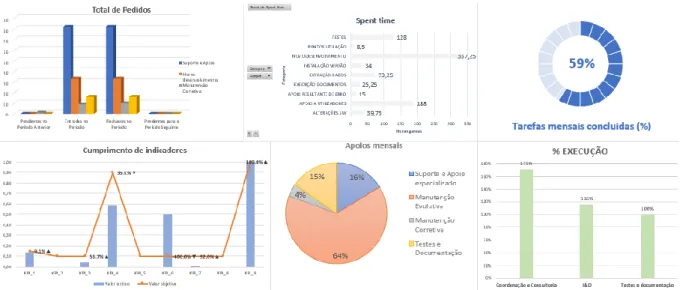
Prior to the implementation of the new software, the team manager asked for an improvement of her files, made in Excel, to make it easy to view the entire state of the current process. For this was created a dashboard, which consists of a panel that shows the desired metrics and indicators visually, facilitating the understanding of generated information. Through an association of all the existing pages in Excel and creation of graphics, a dashboard was developed. As changes were created in the document, it automatically updated the dashboard, which always had current information. The dashboard is created according to the performance indicators to be controlled, as we can see in the figure 15.
33 In the figure it can be observed a dashboard developed with different indicators such as: the total of requests, time to complete a sprint, monthly tasks completed, fulfilment of indicators, number of monthly supports and finally the percentage of execution.
As mentioned in the previous topic, one tool allows a more detailed view while the other allows a more general view, being necessary to combine the Excel and Jira tools.
5.1.5 New method
As we saw in the methodology, the method that best fits the philosophy of the company is the Kanban, a method that was already employed by it. However, with a comparison developed in the methodology chapter it was decided to create a new process (Figure 16) that is based on the Kanban method but also involves some of the philosophies used in Scrum.
Figure 16: New method followed by the team
In the image we can see the process that we consider to be the best way to approach the development of tasks. This process starts with the prioritized product Backlog that is in a list on the Jira. Then we move on to the preparation of the iteration, which consists of preparing the monthly tasks to be accomplished, leaving time available for the possible emergence of support. We then proceed to its execution and finally to its deployment. To support these phases, we will have confluence software that will serve as a history and knowledge base. Along with the activities developed, a daily meeting will also take place to check the situation. This process will allow the updating of priorities and frequent planning, being directly associated with reducing the risk of failure.
34
5.2 Diagnosis problems vs New method implemented
To understand some of the improvements implemented, a contrast between the problems previously felt and the results obtained after the implementation of the new methodologies were represented in the following table 3.
Table 3: Contrast of the results of some actions taken before and after implementation.
Before Implementation After Implementation
Different triggering of the process. All the requests began on the support team, where the ticket is created.
Monthly version released without previous meetings.
Monthly meeting, one week before the monthly version was released.
Different channels of communication throughout the process.
All the information must be registered in the management tool or email.
Late requirements made by the customer. 48h before the version is released, the client could not add requirements or make requests for the same version.
Different procedures to carry out the same activity.
Same procedures and successive registration to carry out the same activity.
Customer requests that are not explicit. Meeting with the customer to understand the requirements.
Omission of information. Information shared and accessible to the whole team.
High responsibility assigned. Decisions are taken as a team. Interruption to the resolution of tasks by the
appearance of supports.
When an urgent support appears, the team receives a warning, not disturbing the wellbeing of the room.
Creation of different tickets for the same incident.
Each incident is associated to a ticket that may be associated with more sub incidents.
Mismanagement of documentation. Organized and reliable information on a single platform (Confluence).
Limited project management tool. Maximum advantage of management tools to manage projects and documentation.
35 The high number of tickets is directly related to the high number of occurrences registered (Appendix E). However, a clear difference in total records is visible between the Redmine and Jira tools. This disparity is due to the new methodology implemented, where only one ticket is created for each task to be developed, decreasing the total number of tickets created, as it can be seen in Figure 17.
Figure 17: Graph of the number of tickets created in Redmine vs Jira.
The creation of tickets for all events causes the total number of tickets registered to increase. On the other hand, the fact that only one ticket is now registered for each occurrence causes a decrease in the total ticket number. This counterproductive effect implies that it is not expected that the total number of tickets created will change drastically over time.
When analysing in more detail the last point of the table its relevance is understood. Previously the tickets were created by both parties, SPMS and Glintt causing a loss of information and disorganization in the development processes. After introducing the new methodology, where the customer creates the tickets, we see through the indicators an increase in the number of tickets created, visible in the table 4.
209 183 167 109 50 103 140 0 50 100 150 200 250
Jan Feb Mar Apr May June
Ti ck ets c re ate d Month
Number of tickets created by the client in Redmine vs Jira