Correspondence: (a)M.J. Pereira; Email: [email protected]; Telephone: +351-275319703; Fax: +351-275319719. Other author information: (b) P.T. Fiadeiro; Email: [email protected]; Telephone: +351-275319746; Fax: +351-275319830. (c)J. Silvy; Email: [email protected]; Telephone: +351-275319819; Fax: +351-275319740.
Paper surface diffraction to characterise the fibre
orientation distribution
M.J. Pereira
*a, P.T. Fiadeiro
*b, J. Silvy
**c *Remote Sensing Unit-Dept. of Physics, Optical Centre;
**Dept. of Paper Science and Technology
University of Beira Interior, 6201-001 Covilhã – Portugal
ABSTRACT
Many paper mills use ultrasonic techniques to measure the Tensile Stiffness Index, TSI, of the paper sheet. They then assume that the TSI value is the same as the fibre orientation anisotropy. This is true if the paper is allowed to dry without any internal tension or elongation, but does not apply to paper manufactured in a paper machine. The paper machine introduces tension and elongation as soon as the fibre is placed on the forming fabric. These factors increase through the press section and are accentuated in the drying section. In order to uniquely measure the fibre orientation anisotropy on the surfaces, the proposed method uses replicas of both paper surfaces to produce a laser diffraction pattern. The obtained pattern reveals an elliptical shape, which is related to the fibre orientation anisotropy of the paper surface. By measuring the ellipticity of the diffraction pattern and the deviation with respect to the machine direction, one can quantify the fibre orientation distribution. Different papers from the bench market have been successfully tested with the developed system. This article describes the new developed optical system and its innovative capabilities in the field to produce maps of the fibre orientation of a complete paper sheet surface. A selection of the obtained results to prove its feasibility is also presented.
Keywords: Optical diffraction, fibre orientation anisotropy, paper surface replicas, paper sheet formation and paper
structure.
1. INTRODUCTION
Due to the manufacturing process paper has an anisotropic structure [1-3]. Most of this anisotropy comes from fibre orientation distribution in the plane of the sheet. The mechanical strength of paper products is strongly dependent of this orientation distribution [4]. Variation in fibre orientation in paper sheet contributes to dimensional instabilities, optical differences, porosity and smoothness differences, and diminished mechanical properties in the finished paper sheet [5]. Problems like curl, twist warp, down warp are a direct result of improper fibre orientation [6]. Due to the importance of fibre orientation distribution in paper [7-9], quantitative methods for measuring fibre orientation are of most importance for the paper industry [9-14].
The ultrasonic technique to measure the Tensile Stiffness Index (TSI index ratio) [14, 15], has received wide acceptance in the paper industry as a tool for assessing machine and product performances. The traditional application involves the
determination of the orientation and anisotropy of the paper sheet by measuring the elastic stiffness in several directions. The principal stiffness orientation is commonly interpreted as an indirect measurement of the preferential fibre orientation. However, with this method, machine process variables after the forming section are not considered, and the principal stiffness orientation does not agree with the preferential fibre orientation [14-16]. The paper machine introduces tension and elongation in the fibres and these factors increase through the press section and are accentuated in the drying section. The TSI value is equal to the fibre orientation only when the paper is allowed to dry without any internal tension or elongation, but does not apply to paper manufactured in a paper machine.
The ultrasonic method can identify the directions of maximum and minimum elastic stiffnesses as well as the angle that the principal axis makes with the machine direction, MD. This orientation angle is referred as TSO angle.
In order to uniquely measure the geometrical fibre orientation the new proposed method uses replicas of the paper surfaces to produce a laser diffraction pattern. The obtained pattern reveals an elliptical shape, which is related to the fibre orientation anisotropy of the paper surface. By measuring the ellipticity of the diffraction pattern and the deviation with respect to the machine direction, one can quantify the fibre orientation anisotropy distribution. A set of known papers has been successfully tested with the developed system [17].
2. PRINCIPLE OF THE PROPOSED METHOD
The proposed method is based on the analysis of laser diffraction patterns produced by transparent replicas of the paper sheet surfaces. If a plane parallel beam of laser light illuminates a transparent surface replica one can create a Fraunhoffer diffraction pattern by focusing the diffracted light using a lens. The diffraction pattern obtained reveals an elliptical shape with a specific ellipticity and orientation with the major axis perpendicular to the main orientation of the fibres.
The density of orientation of straight fibre segments in a fibre web can be expressed by a radius of curvature of an equivalent contour involved by fibres in the texture plane. This technique of modellisation is called Equivalent Pore Model where an elliptical contour fits the feature structure [18-20]. In such way, only two parameters are sufficient to represent the fibre distribution anisotropy: the ellipticity a/b ratio of the elliptical contour (anisotropy) and the direction of its major axis (fibre orientation).
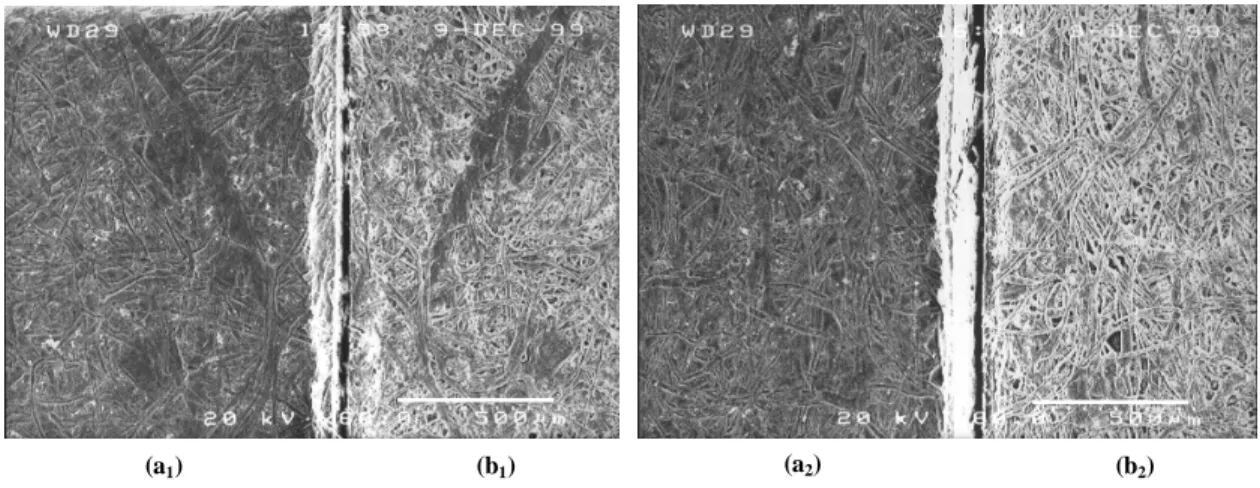
High quality surface replicas of paper fibres can be obtained using a thermoplastic film. The negative replica of the surface can be registered by pressing the film against the web surface using a pressure in the range 300-350 kPa @115 ºC, during 20 minutes. One can produce simultaneously replicas of both surfaces in the same conditions. The quality of the replica is evaluated and controlled by microscopic observations (optical microscopy or electronic microscopy). Figure 1 shows the surfaces of a common paper sheet (right) and the corresponding surface replica (left) for both top and bottom sides. The image of the replica in Fig. 1 is a mirror image of the paper surface and it is very difficult to distinguish the paper surface from the replica.
Figure 1: Scanning Electron Micrography of the surface of a common paper sheet b1, b2 and the corresponding surface replica a1, a2, magnification x60, 20 kV, scale 500 µm. (a1, b1) Top side, and (a2, b2) bottom side.
3. EXPERIMENTAL OPTICAL APPARATUS
In order to register the Fraunhofer diffraction patterns of surface replicas, for latter processing on a computer, an experimental optical apparatus have been developed and implemented in our laboratory as shown schematically in Fig. 2. Laser
Q
L1 L2 CCD SPy
x
Figure 2: Experimental optical apparatus for diffraction analysis.
It uses a He-Ne laser beam (λ=632.8 nm), a spatial filter SP and a collimating lens L1 to produce a plane-parallel beam of light to illuminate the replica surface Q. All the light passing through and deviated by the replica is collected by a large aperture Fourier lens L2. This lens creates a diffraction pattern in the focal point where a solid state sensor CCD is placed for digital image acquisition purposes. The solid state sensor is connected to a frame grabber, who is installed on a digital
computer, in order to record the diffraction pattern intensity distributions as digital images with 512 x 512 pixels and 256 grey levels (8 bit per pixel).
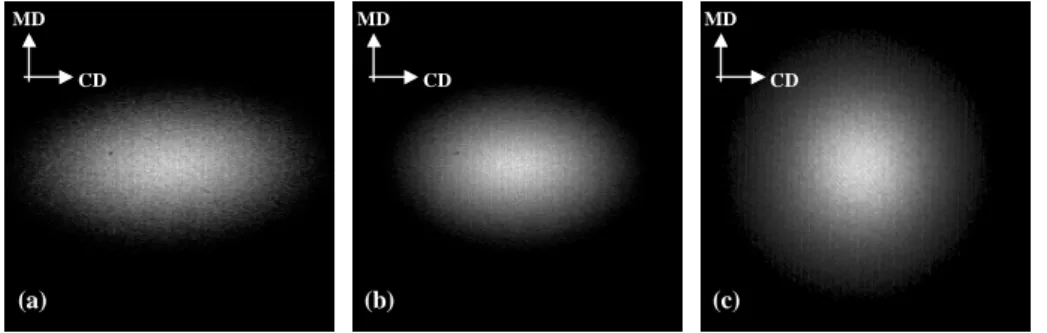
As an example, the typical images of the diffraction intensity distributions that have been obtained with the described apparatus are shown in Figs. 3(a), and 3(b) for two anisotropic paper samples (top side and bottom side), and in Fig. 3(c) for one quasi-isotropic paper sample.
Figure 3: Typical diffraction intensity distributions. Anisotropic paper (a) bottom side, (b) top side, and (c) quasi-isotropic paper.
A specific computer application program, that have also been implemented to control the acquisition and the recording processes, performs all the necessary processing on the recorded data.
In terms of acquisition, and for each surface replica, the experimental optical apparatus was design to perform a controlled scan through a motorised XY table, which holds the replica. The diameter of the collimated laser beam can be adjusted in the range 4.0 – 30.0 mm. The scanned area goes up to 200.0 x 200.0 mm2 and the scan steps can be adjusted between 26 µm and 20.0 mm in a continuous and sequential scan. Random scans are also possible within a predetermined area of scan.
Simultaneously, the application program saves all the acquired data corresponding to the performed scan for processing. Concerning the data processing, several algorithms specifically implemented to evaluate the anisotropy and the fibre orientation can be selected and applied to the recorded data.
In general, the basic algorithm applied to analyse each diffraction pattern intensity distribution finds the best equi-intensity contour to compute in a few seconds the ellipticity ratio a/b and the orientation of its major axis with respect to the cross direction, CD. The first approach gives a set of possible contours which is automatically refined in order to give minimal root mean square error of the differences between the contours, and an angle difference between the major and minor axis of the contour nearest to 90º.
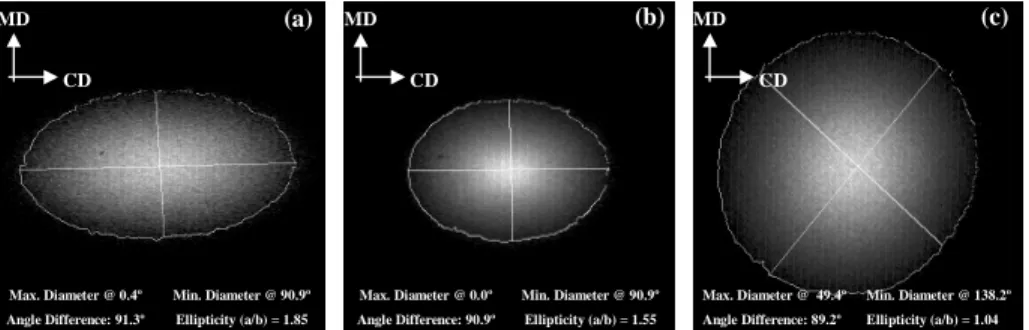
Using the diffraction patterns images shown in Figs. 3(a), 3(b), and 3(c) the results obtained with the described algorithm, are shown in Figs. 4(a), 4(b), and 4(c). The best contour found was superimposed to the pattern for display purposes. For the
(a) (c) (b) MD CD MD CD MD CD
anisotropic paper sample surfaces the computed ellipticity ratio has a value of 1.55@ 0.0º (top side), whilst the bottom side reveals an ellipticity ratio of 1.85@ -0.4º. It is clear from these results the differences of anisotropy on both sides of the same paper sample. Concerning the fibre orientation one can conclude that the fibres are, as mentioned, very well aligned with respect to the MD direction. For a quasi-isotropic paper sample surface (only one side shown) the computed ellipticity ratio has a value of 1.04. The calculated angle of orientation, 49.4º, is not a relevant parameter to be considered in this particular case.
Figure 4: Results of the diffraction analysis. For anisotropic paper surface (a) bottom side, (b) top side, and (c) quasi-isotropic paper surface.
Figure 5 shows a map of the results of a complete scan on other paper surface replica over an area of 78.0 x 78.0 mm2. The map displays a segment for each scanned point where its length is proportional to the anisotropy and its direction determines the local fibre orientation. The header of the map states the scan conditions and the global computed results. All the results presented have been obtained using the laser beam diameter set to 6.0 mm and the scan steps set to 6.0 mm.
4. EXPERIMENTAL RESULTS
A set of five paper samples have been used with the described experimental optical apparatus to measure the anisotropy and the fibre orientation on both surfaces in order to establish a comparison with the results obtained by the ultrasonic method on the same set of samples.
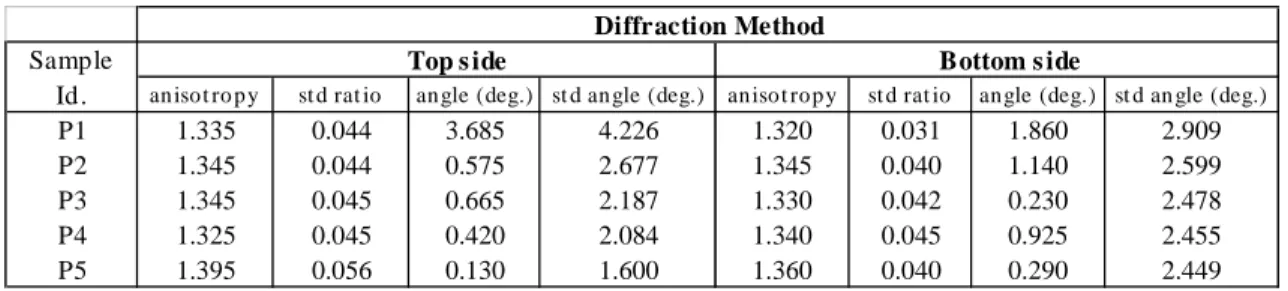
Replicas for both surfaces of these paper sheet samples have been produced using the described procedure. Each replica covers a total area of 200.0 x 200.0 mm2. The experimental optical apparatus have been set for a XY continuous and sequential scanning over the predefined area. The laser beam diameter and the scan step were set to 6.0 mm. For each surface replica (two per paper sheet sample) where carried out four scans to evaluated the mean ellipticity ratio and the corresponding fibre orientation for each scanned point, and to compute the total average ellipticity ratio and the fibre orientation for the entire sample. Table 1 compiles the anisotropy, orientation angles, and the corresponding standard deviation measurements using the laser diffraction method. Table 2 compiles the results of the anisotropy, and orientation angles measurements using the ultrasonic method.
Max. Diameter @ 0.4º Min. Diameter @ 90.9º Angle Difference: 91.3º Ellipticity (a/b) = 1.85
(a) (b) (c) MD CD MD CD MD CD
Max. Diameter @ 0.0º Min. Diameter @ 90.9º Angle Difference: 90.9º Ellipticity (a/b) = 1.55
Max. Diameter @ 49.4º Min. Diameter @ 138.2º Angle Difference: 89.2º Ellipticity (a/b) = 1.04
Figure 5: Result map of XY continuous and sequential scan.
Table 1: Results of diffraction analysis for the paper samples - top side, and bottom side.
Sample
Id. anisot ro py st d rat io angle (deg.) st d angle (deg.) anisot ropy st d rat io angle (deg.) st d an gle (deg.)
P1 1.335 0.044 3.685 4.226 1.320 0.031 1.860 2.909 P2 1.345 0.044 0.575 2.677 1.345 0.040 1.140 2.599 P3 1.345 0.045 0.665 2.187 1.330 0.042 0.230 2.478 P4 1.325 0.045 0.420 2.084 1.340 0.045 0.925 2.455 P5 1.395 0.056 0.130 1.600 1.360 0.040 0.290 2.449 Diffraction Method
Top s ide Bottom s ide
Table 2: Results of ultrasonic method for the paper samples – in the bulk. Samp le
Id . T SI M D/CD st d rat io T SO Angle (deg.) st d angle (deg.)
P1 2.250 0.025 7.070 1.093
P2 2.479 0.027 2.861 0.669
P3 2.293 0.036 1.041 0.728
P4 2.254 0.031 0.678 0.573
P5 2.366 0.011 1.781 0.601
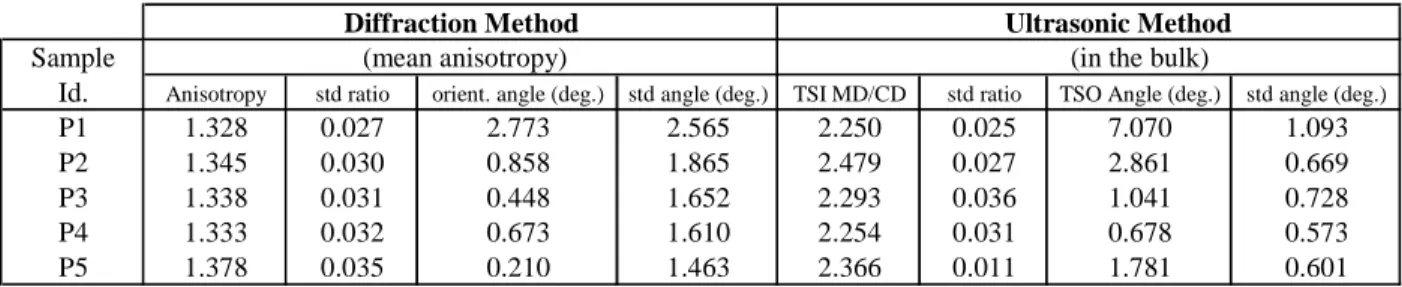
These tables enable a correlation study between the two methods. This correlation study comprises a linear regression to compute the correlation factor, R2. The results obtained by the ultrasonic method correspond to a bulk analysis of the paper sheets. In order to compare them with results of the diffraction analysis, the mean value of the measured anisotropy for the top and bottom sides of the sheets have been computed to represent the anisotropy of the whole paper sample (see table 3).
Table 3: Compilation of the anisotropy measurement results for ultrasonic and diffraction methods.
Sample
Id. Anisotropy std ratio orient. angle (deg.) std angle (deg.) TSI MD/CD std ratio TSO Angle (deg.) std angle (deg.)
P1 1.328 0.027 2.773 2.565 2.250 0.025 7.070 1.093 P2 1.345 0.030 0.858 1.865 2.479 0.027 2.861 0.669 P3 1.338 0.031 0.448 1.652 2.293 0.036 1.041 0.728 P4 1.333 0.032 0.673 1.610 2.254 0.031 0.678 0.573 P5 1.378 0.035 0.210 1.463 2.366 0.011 1.781 0.601 Diffraction Method (mean anisotropy) Ultrasonic Method
(in the bulk)
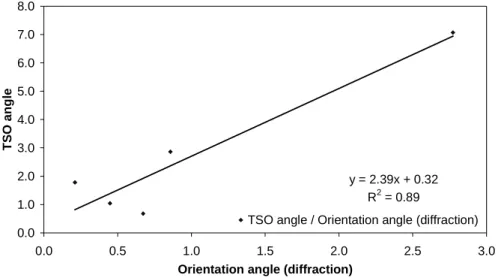
Figure 6 shows the correlation between the TSI index ratio and the anisotropy. Figure 7 shows the correlation between the misalignment angle results for the two methods of measurement: the ultrasonic method and the diffraction method.
There is not a strong correlation between the results obtained in these measurements, but the tendency of the TSI index ratio, in respect to the fibre orientation distribution, looks to be more significant when the range of TSI variations is large [17]. y = 2.42x - 0.93 R2 = 0.25 2.20 2.25 2.30 2.35 2.40 2.45 2.50 1.32 1.33 1.34 1.35 1.36 1.37 1.38 Anisotropy (diffraction) TS I i ndex r a ti o
TSI index ratio / Anisotropy (diffraction)
y = 2.39x + 0.32 R2 = 0.89 0.0 1.0 2.0 3.0 4.0 5.0 6.0 7.0 8.0 0.0 0.5 1.0 1.5 2.0 2.5 3.0
Orientation angle (diffraction)
TS
O
angl
e
TSO angle / Orientation angle (diffraction)
Figure 7 - Correlation graph between equivalent angle measurements.
5. CONCLUSIONS
One can conclude that replicas give an accurate representation of paper fibre web surfaces, as show in Fig.1, and replicas for both surfaces of the paper sheet can be produced simultaneously in the same conditions.
Laser diffraction analysis of transparent replicas enables the measurement of the anisotropy and the geometrical fibre orientation on the surfaces of paper. The diffraction patterns obtained with the proposed method reveals an elliptical shape in which the ratio between the length of major and minor axis corresponds to the anisotropy, being the orientation of the major axis perpendicular to the fibre orientation.
The results for the fibre orientation obtained with this method shown, like expected, that the main fibre orientation is near to the machine direction - MD. The results for the anisotropy and fibre orientation, presented in the form of a map, enable us to observe and identify local variations of the fibre orientation anisotropy. The proposed method is precise and very sensible to changes in the fibre orientation and is easy to proceed.
Good correlation factors between the laser diffraction method and several other methods for anisotropy measurement have been found [17]. The ultrasonic measurements are influenced by fibre tension and fibre elongation that exists in the paper structure, always giving anisotropy values above the average. For paper sheets with similar geometrical anisotropy values, the ultrasonic method can gives different TSI index ratios. Nevertheless, if the range of the TSI variation is large the correlation factor between methods when compared with the ultrasonic method becomes better, even with a high dispersion in the results [17].
The feasibility achieved with the laser diffraction method to carry out surface measurements of the geometrical anisotropy of the fibre orientation, the accuracy of the results obtained, and its reproducibility makes it a good contribution for research and development of fibre web structures.
REFERENCES
[1] C. Schaffnit, J. Silvy, C. T. J. Dodson, “Orientation density distributions of fibres in paper,” Nordic Pulp and Paper Research Journal, 3, pp.121-128 (1992).
[2] B. Drouin, R. Gagnon, A. Schroder, M Butel, J. Silvy, “L’Orientation des Fibres et les Propriétés Mécaniques du Papier: Méthodes de Contrôle de l’Anisotropy de la Feuille,” Revue A.T.I.P. 2, vol. 49, pp. 66-72 (1995).
[3] Drouin, gagnon, “Optical measurement of paper fibre orientation,
[4] K. J. Niskanen, J. W. Sadowski, “Evaluation of some Fibre Orientation Measurements,” Journal of Pulp and Paper Science, 15, 6, pp. J220-J224 (1989).
[5] J. L. Thorpe, “Exploring Fibre Orientation Within Copy Paper,” 1999 TAPPI International Paper Physics Conference, pp. 447-458 (1999).
[6] J. W. Sadowsky, “Measurement of Fibre Orientation in Paper by Optical Fourier Transform,” Paperi já Puu, 9, pp. 588-595 (1979).
[7] C. T. J. Dodson, K. Fekih, “The Effect of Fibre Orientation on Paper Formation,” Journal of Pulp and Paper Science
6, vol. 17, pp. J203-J206 (1991).
[8] C. T. J. Dodson, C. Schaffnit, “Flocculation and Orientation Effects on Paper-formation Statistics,” Tappi Journal, pp. 167-171, January (1992).
[9] Z. Koran, R. Prud’homme, “A study on Orientation and Curl,” Tappi 8, vol. 65, pp. 88-91 (1982)
[10] J. Silvy, Ph. Herve, “Formation de la Feuille: Influence de la Floculation de la Longueur et da la Courbure des Fibres sur la Repartition Orientationnelle des Fibres et les Propriétés Physiques des Papiers,” Revue A.T.I.P. 6-7, vol. 36, pp. 343-357 (1982).
[11] R. Danielsen, B. Sttenberg, “Quantitative Determination of Fibre Orientation,” Svensk Papperstidning 13, vol. 50, pp. 301-305 (1947).
[12] L. Mignot, “Effect de l’ Orientation Fibreuse au Niveau Microscopique sur les Proprietes du Papier au Niveau Macroscopique: Developpment de Methods de Mesure de l’Orientation Fibreuse par Analyse d’Image,” Diplome de Recherche Technologique, Institut National Polytechnique de Grenoble, Nippon Paper Industries Ltd., Central Research Laboratory (1998).
[13] P. G. Mercer, “On-line Instrumentation for Wet-End Control,” Appita 4, vol. 41, pp. 308-312 (1988).
[14] G. Lindblad, “Ultrasonic Measurement – A Reliable Method for the Quality Control of Paper,” Lorentzen &Wettre Handbook, Paper Testing and Process Optimization, pp. 13-19 (1999).
[15] M. L. Zumeren, D. J. Young, C. C. Habeger, G. A. Baum, R. Treleven, “Automatic Determination of Ultrasound Velocities in Planar Materials,” Ultrasonics, vol. 25, pp. 288-294 (1987).
[16] Hess, Brodeur, “Effects of Wet Straining and Drying on Fibre Orientation and Elastic Stiffness Orientation,” Journal of Pulp and Paper Science, 22, 5, pp. J160-J164 (1996).
[17] P.T. Fiadeiro, M.J. Pereira, J. Silvy, “Laser diffraction to measure the anisotropy and the fibre orientation in fibre webs”, for publication in Journal of Pulp and Paper Science.
[18] J. Silvy, “Etude Structurale des Milieux Fibreux: Cas des Fibres Cellulosiques,” Thése de Doctorat d’ Etat, Université Scientifique et Medicale et Institut National Polythecnique de Grenoble (1980).
[19] J. Silvy, “La Transformation Conforme du Pore Equivalent, Methode d’Homogeneisation de la Texture des Milieux Polyphasés,” Recents Progrés en Genie des Procédes 7, vol. 3, pp. 484-494, (1989).
[20] Z. Koran, J. Silvy, R. Prud’homme, “Network Structure and Fibre Orientation in Paper,” Tappi Journal 5, vol. 69, pp. 126-128 (1986).