www.scielo.br/rbg
PHOSPHATE PROSPECTION IN THE ALKALINE PROVINCE OF ALTO DO PARANA´IBA,
BRAZIL, BASED ON AIRBORNE GEOPHYSICAL DATA
Leila M´arcia Mendes Carvalho
1, Augusto C´esar Bittencourt Pires
1and Roberta Mary Vidotti
2ABSTRACT.This paper aims to identify, differentiate and characterize geophysically phosphate deposits in metasedimentary rocks and carbonatite for standard geophysical set to facilitate the exploration of this mineral, using processing techniques and integration aerial magnetometric and aerial gamma spectrometric data. The area is located in the Upper Parana´ıba Alkaline Province (PAAP), Minas Gerais State, Brazil, characterized by Cretaceous alkaline rocks that intrude Neoproterozoic rocks of the Bras´ılia Belt. They include kimberlites, olivine lamproites madup´ıticos, kamafugites, alkaline-carbonatite complexes and dykes of phlogopite picrito, hosting carbonatite complex. These phosphate deposits are found in the region metasediments. Phosphates in metasedimentary rocks show high levels of uranium and reason eU/eTh and similar smaller bodies of these deposits have been identified through the RGB and CMY. Phosphates in carbonatites occur in the outer edges of the body and high concentrations of eTh and eU, with different internal standards and influenced by tropical weathering. The main lineaments are NW-SE, E-W and NE-SW, where NE-SW is cut by NW-SE representing first event in the area, while E-W is assigned to subsequent event or reactivated during this phase. The geological and geophysical correlation shows that magnetic fields have a direct correspondence with the geology of carbonatites, because present a high concentration of magnetic minerals.
Keywords: aerial gamma spectrometry, aerial magnetometry, mineral prospecting, phosphate.
RESUMO.O presente trabalho objetiva identificar, diferenciar e caracterizar geofisicamente dep´ositos de fosfato em rochas metassedimentares e carbonat´ıticas para definir um padr˜ao geof´ısico que facilite a prospecc¸˜ao deste mineral, utilizando t´ecnicas de processamento e integrac¸˜ao de dados aeromagnetom´etrico e aeroga-maespectrom´etrico. A ´area situa-se na Prov´ıncia Alcalina do Alto do Parana´ıba (PAAP), Minas Gerais, caracterizada por rochas alcalinas cret´aceas, que intrudem rochas neoproteroz´oicas da Faixa Bras´ılia. Elas incluem kimberlitos, olivina lamproitos madup´ıticos, kamafugitos, complexos alcalino-carbonat´ıticos e diques de flogopita picrito, que alojam complexos carbonat´ıticos. Nesta regi˜ao encontram-se dep´ositos de fosfatos em rochas metassedimentares. Os fosfatos em rochas metassedi-mentares mostram teores elevados de urˆanio e da raz˜ao eU/eTh; al´em disso, corpos menores similares a esses dep´ositos foram identificados atrav´es do RGB e CMY. Os fosfatos em carbonatitos ocorrem nas bordas externas do corpo e concentrac¸˜oes elevadas de eTh e eU, al´em de padr˜oes internos diferenciados e influenciados pelo intemperismo tropical. Os principais lineamentos s˜ao NW-SE, E-W e NE-SW, onde NE-SW ´e cortada por NW-SE representando primeiro evento na ´area, enquanto E-W ´e atribu´ıdo a evento posterior ou reativado nessa fase. A correlac¸˜ao geol´ogico-geof´ısica mostra que os dom´ınios magn´eticos tˆem uma correspondˆencia direta com a geologia dos carbonatitos, devido a estes apresentarem uma concentrac¸˜ao elevada de minerais magn´eticos.
Palavras-chave: gamaespectrometria a´erea, magnetometria a´erea, prospecc¸˜ao mineral, fosfato.
1Universidade de Bras´ılia, Instituto de Geociˆencias, Asa Norte, 70910-900 Bras´ılia, DF, Brazil. Phone: +55(61) 8678-1531; Fax: +55(61) 3340-4759 – E-mails: geocriador@gmail.com/lmmc@unb.br; acbpires@unb.br
2Universidade de Bras´ılia, Instituto de Geociˆencias, Campus Universit´ario Darcy Ribeiro, Caixa Postal 04465, 70919-970 Bras´ılia, DF, Brazil. Phone: +55(61) 3107-6985; Fax: +55(61) 3340-4759 – E-mail: roberta@unb.br
INTRODUCTION
Phosphate, Sulfur and Potassium make up the group called Agrominerals, these minerals are the main raw material used in the NPK chemical fertilizers and are considered basic inputs in agriculture (Fernandes et al., 2010). Globally, the phosphate rock is the only viable source of phosphorus while the sedimentary and igneous origin deposits are the most important from the economic viewpoint, of less economic importance, the biogenetic deposits display organic nitrogen concentrations that result from bird fe-ces. Deposits of sedimentary origins constitute about 85% of the world supply, while the igneous and biogenetic deposits consti-tute about 15% and 1%, respectively (Fernandes et al., 2010). About 80% of Brazilian natural phosphate deposits, found espe-cially as P2O5, are of igneous origin with marked presence of
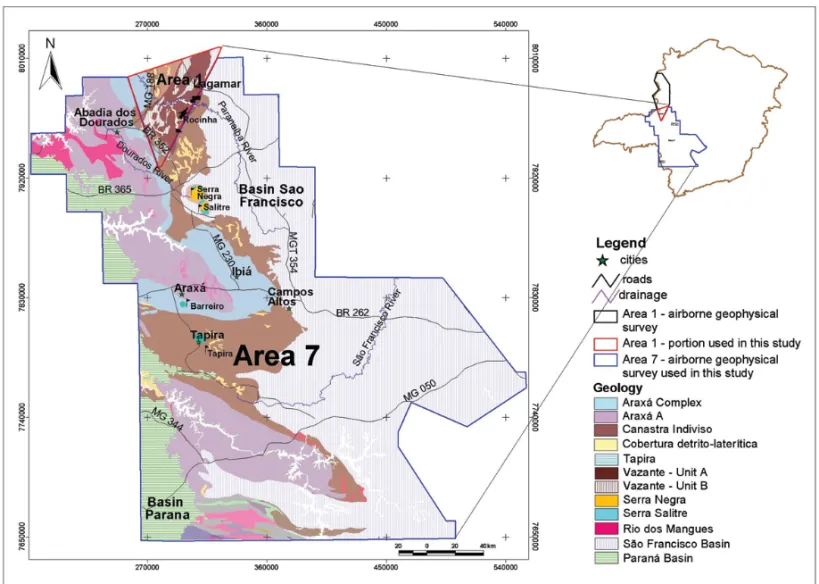
car-bonatite rocks and micaceous minerals (Fernandes et al., 2010). Phosphate fertilizers display relatively high solubility in wa-ter while the predominantly tropical climate in Brazil favor their rapid dissolution, making P highly available to the environment, following the model adopted in temperate countries (Sant’anna et al., 1999). The resulting great phosphorus loss requires con-stant addition of P to the soil to ensure adequate supply to crops, therefore, this study aims to identify, differentiate and character-ize geophysically the phosphate deposits present in carbonatite rocks and metasedimentary units in the southwest region of Mi-nas Gerais and the proposed geophysical patterns aim to facilitate the exploration of this mineral. The airborne geophysical, mag-netometric and gamma spectrometric data were processed and integrated in order to generate products that allow better identi-fication of geophysical patterns associated with the two types of phosphate occurrences in this region. The study site, located in the southwestern region of Minas Gerais, is covered by Area 7 and Area 1 projects of the airborne geophysical survey of Mi-nas Gerais and encompasses five counties, Arax´a, Lagamar, Ibi´a, Tapira and Campos Altos (Fig. 1).
METHODS AND DATA PROCESSING
The methods applied, airborne magnetometric and gamma spectrometric, sought to establish comparative parameters, from the geophysical and geological points of view, between the ar-eas already producing phosphate, in the Alkaline Province of Alto do Parana´ıba, Minas Gerais, and nearby areas. The work area includes the project areas 7 (Patos de Minas-Arax´a-Divin´opolis) and 1 (Una´ı-Paracatu-Vazante-Coromandel) of the Airborne Geo-physical Survey Program of Minas Gerais (Fig. 1). Area 7 con-sists of 185.3 km2covered with magnetometric and gamma ray
spectrometric high resolution data, with flight and control lines
spaced 0.4 km and 8.0 km, towards N-S and E-W, respectively, at 100 m flying height. Area 1 was divided into North and South, the southern portion, used in this work, covered an area of 8.5 km2with N30W production and N60E control lines and the
spacing between production and control lines was 0.25 km and 2.5 km, respectively, at 100 m flying height. The two data sets were processed separately and then integrated and data integra-tion was supported by the statistical analysis of the data at the junction of the two surveys and the tools available in the software used for processing.
The airborne magnetometric and gamma spectrometric data were treated using the Oasis Montaj™ 7.0 software, data incon-sistencies were removed, subsequently, the data were interpolated in regular grid using the bidirectional splines method for magne-tometry and minimum curvature for gamma ray spectrometric, in a 100 m×100 m square cell. The process generated images that were used to facilitate the qualitative interpretation of geophysical units and structures and all interpretations and integrations used the Geographic Information System (GIS) to facilitate the analysis and presentation of final results.
PHOSPHATE DEPOSITS IN BRAZIL
Currently, Brazil is the largest producer of phosphate in South America and among the top 10 producers in the world (DNPM, 2008), this prominent position is mainly due to production orig-inating from the magmatic deposits associated with alkaline-carbonatite complexes, there are currently three known natural sources of phosphate.
The igneous deposits derived from alkaline rocks (carbon-atite) that occur in the regions of Catal˜ao, Goi´as, Arax´a and Pa-troc´ınio, in Minas Gerais; Jacupiranga, in S˜ao Paulo; and Ani-t´apolis, in Santa Catarina, among others. These sources found in the alkaline-carbonatite complexes, also contain the kimberlite provinces, and occur in arched and fault areas on the edges of the Paran´a, Parna´ıba (Almeida, 1976) and Amazon basins. The Brazilian alkaline provinces are controlled by at least three major structural lineaments; the most important has the general direc-tion given by the 125◦azimuth, 125◦AZ (Biondi, 2003). This lin-eament, known as Alto do Parana´ıba Lineament in the Triˆangulo Mineiro and southeast Goi´as, borders on the northeast, the Para-n´a Basin and on the southeastern part, the San Francisco cra-ton. This relatively narrow band, which consists of metamor-phite of the Bras´ılia Belt, comprises the most economically im-portant alkaline-carbonatite complexes and the largest kimberlite-lamproite province known in the country, and phosphate meta-sedimentary units, as well (Fig. 1). The Alkaline Province of Alto
Figure 1 – Geological map of Alto do Parana´ıba Province (Bizzi et al., 2003) showing the project areas 1 and 7 of the Airborne Geophysical Survey Program of Minas
Gerais. The northern region concentrates the phosphate deposits in metasedimentary rocks, whereas the carbonatite rocks are in the central up to the east/southeast end region.
do Parana´ıba includes occurrences of kimberlite, lamproite, ka-mafugite and carbonatite. Generally, magnetic surveys in the re-gion show that these bodies have characteristic expression repre-sented by circular or dipolar anomalies.
Marine sediment – certainly, the largest source of phosphate
found on every continent (except Antarctica), from the Archean to the Recent. It accounts for over 80% of the production of phosphate rock in the world, and thus has enormous economic importance.
GEOLOGICAL CONTEXT
The site is located on the southwestern edge of the Craton. Its rocks belong to the Bras´ılia Fold Belt, which forms the basement of the Phanerozoic units of the S˜ao Francisco and Paran´a basins, this region has a large number of alkaline ultramafic intrusions inserted in the Alkaline Province of Alto do Parana´ıba (APAP) (Fig. 1). The Bras´ılia Fold Belt has generally NW-SE direction,
with increasing metamorphic grade from east to west, with incip-ient facies until granulite and the varied intensity of this meta-morphism allowed dividing the metamorphic zones into Cra-tonic, External and Internal (Fuck, 1994). On the other hand, the Mega-inflexion at parallel 16◦S called Syntax or Mega-inflection of the Pirineus, identified in the region of Piren´opolis and Co-rumb´a, Goi´as, by Costa et al. (1970), also allows the subdivision of the range into North and South segments (Fonseca & Dard-enne, 1996). This is justified by the difference in tectonic evo-lution, to the north and south of this structure called Syntax or Mega-inflection of the Pirineus and the main feature of the north-ern segment is the preservation of the unique features of their units and their contact relationships, is formed by Ara´ı, Parano´a, Serra da Mesa groups, in addition to the volcanic-sedimentary sequences of Juscelˆandia, Indaian´opolis and Palmeir´opolis (Dardenne, 2000).
The great structural and stratigraphic complexity of the southern segment prevents, sometimes, stacking its units and
defining sedimentary environments, the segment is composed by the Vazante and Canastra groups, Ibi´a Formation, and Arax´a Group. This work emphasizes the south segment, where the study area is inserted.
The Vazante Group occupies an elongated N-S strip, ap-proximately 250 km long, located in northwestern Minas Gerais, between the cities of Una´ı and Coromandel (Dardenne, 1978) and its geology has been defined as interbedded carbonate and pelitic units. The carbonate units are characterized by bioherms, dolomitic breccias and limestone, the pelitic units are mainly slates and phyllites, intensely folded, with kinks and chevrons, two folding directions are printed in this group and their interfer-ence generates a pattern identified as the dome-basin type (Dard-enne, 1978). This group was divided, from bottom to top, in seven formations: Santo Antonio do Bonito, Rocinha, Lagamar, Serra do Garrote, Serra do Poc¸o Verde, Morro do Calc´areo and Lapa (Dardenne et al., 1997) and important mineralization of Pb and Zn associated with the carbonates of Morro do Calc´areo Forma-tion and Zn in Serra do Poc¸o Verde FormaForma-tion are present, the phosphate deposits of Rocinha and Lagamar are located in the basal portion of this group (S´anchez et al., 2007).
In the Lagamar region, this formation consists of three units: (I) the lower psamo-pelitic sequence, called Rocinha mem-ber, is the basis of the formation and consists of sandy-silty-clayey meta-rhythmites, housing the Rocinha and Lagamar deposits;
(II) the sequence called Arrependido branch, composed of medium clay-carbonate conglomerates, is followed by a predominantly clayey sequence, interspersed with large carbonate lenses, included in the Lagamar branch; (III) upper clay sequence composed mainly of laminated slates,
named Serra do Garrote branch.
The Canasta Group, identified as part of a passive margin basin open at the end of the Mesoproterozoic, predominates south of Bras´ılia and presents conspicuous contact relationships with the Arax´a Group. Its rocks outcrop over a 650-km range, from the southwestern Minas Gerais to the southeast of Goi´as and the Federal District, at the base there is a sequence of shales that gradually rises to the top with a sandy contribution, from quartz-phyllites, micaceous quartzite, quarzite and finally to ortho-quartzite underpinning the slopes of the mountains and plateaus. The entire sequence of this group shows a lateral and vertical gra-dation between phyllite and quartzite packages. Internally, each package has the same gradation on a smaller scale, showing the rhythmicity of the entire set.
Barbosa et al. (1970) characterized the Ibi´a Formation as a band of calco-schists that occurs along the Quebra-Anzol River, near the city of Ibi´a. It is composed of calco-sericite and chlorite schists invariably micro-folded and crenulated, presenting neo-formation of beds and quartz cores with calcite always present in non-weathered outcrops (Rio Verde formation). Braun & Bap-tista (1978) highlighted the occurrence of this formation around the quartzitic ring of Barreiro alkaline massif (Arax´a) and in the interbedded quartzite of Serra de Pirapetinga. According to Fer-rari (1989), the Ibi´a Formation belongs to the Arax´a Group and because it is near the granite-gneissic basement is likely to con-stitute the basal portion thereof. The Arax´a Group is tectonically placed over the Ibi´a Formation and covered by the sandstones of the Botucatu Formation, of the Paran´a Basin and its units have both sedimentary (schists and quartzite), and magmatic (amphi-bolites) origin, their structural complexity makes it difficult to separate into formations. This group was metamorphosed in am-phibolite facies of 630 Ma age (Seer, 1999) and the S˜ao Francisco Basin is represented in the area by the Santa Fe, Areado, Mata da Corda and Urucuia groups that developed during the Cretaceous and in this basin, the phosphates are concentrated in the Mata da Corda Group.
The Alto do Parana´ıba Alkaline Province (APAP), located on the NE border of the Paran´a Basin, is characterized by magmatic manifestations of the Cretaceous period (Barbosa et al., 1970), during the uplift of an arch that separated the Paran´a and S˜ao Francisco basins (Campos & Dardenne, 1977). Kimberlite, car-bonatite and kamafugite are the main representatives of this man-ifestation, while the latter group represents the most signifi-cant known spill of this kind in the world, with approximately 23,000 km2 (Gibson et al., 1995). According to the same
au-thors, this province and the surrounding alkaline provinces orig-inated from the rise of the Trindade Mantle Plume, which was also related to the basaltic spill of the Paran´a Basin and the APAP has important mineral deposits associated with intrusions, mainly carbonatite (Catal˜ao I and II, Serra Negra, Salitre I and II, Arax´a and Tapira) from which phosphate ore, niobium, titanium and rare earth minerals are extracted and phlogopite picrite dykes (Dardenne & Schobbenhaus, 2003).
RESULTS
Gamma ray spectrometric
The gamma ray spectrometric maps were generated for interpre-tation: Potassium (K), Thorium (eTh), Uranium (eU), Total Count (TC); the ratios, eU/eTh, eU/K and eTh/K; RGB (K:eTh:eU) and CMY (K:eTh:eU) composite images. The image of the total count
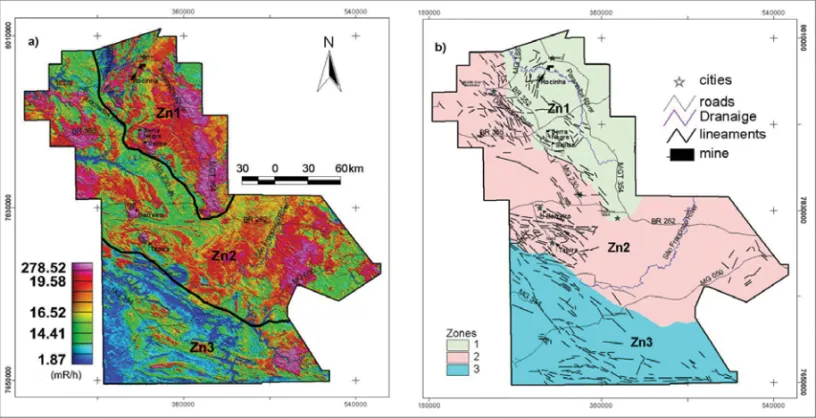
of channel represents a measure of the total radiation present in the energy spectrum of gamma rays, which are contained in the photopeaks and the energies related to K, eU and eTh. The in-terpretation of the total count of image enabled the definition of a framework with gamma spectrometric domains and structures for the entire area. It was also possible to study the lineaments, which, in general, depict the contact area between the large units (see Fig. 5d), this allows also a joint analysis of discrimination made in order to have an idea of what actually contributes to the formation of gamma spectrometric relief portrayed in this chan-nel and the gamma spectrometric framework defined for the area resulted in three major large areas as follows (Fig. 2b).
The zone 1 domain (Zn1, Figs. 2a and 2b) contains the main metasedimentary phosphate units in the region, located in northeast portion of the area, the gamma spectrometric to-tal count varies from low (blue) to high (magenta). The areas of high gamma ray spectrometric total count represent a wide zone, trending NNW-SSE, varying from high to very high (magenta) (Fig. 2a), the individual channel maps, eTh, K and eU, show pri-marily a high concentration of eTh and eU (Figs. 3a and 3c), while potassium presents very low values (Fig. 3b).
The Digital Terrain Model (DTM, Fig. 3d) shows a relief above 1100 meters, with the presence of mountain chains, on the other hand, the northern area is generally along the
NE-SW direction the three elements are present in varying pro-portions, predominantly thorium. Potassium occurs in relatively high amounts; however, this element is largely of hydrothermal enrichment, the Digital Terrain Model (DTM, Fig. 3d) shows a moderate topography, typically the higher relief features of the area, such as hills and plateaus, tend to concentrate thorium be-cause of its low mobility, on the other hand, potassium and ura-nium concentrate on the slopes, valleys and riverbeds due to higher mobility.
The zone 2 (Zn2, Figs. 2a and 2b) is defined by the central area, a large band from NW to east, trending mainly NW-SE, it is the pink area in the map (Fig. 2b), which is characterized by medium to low total count, varying from yellow-reddish to green-ish. There are some plateaus with high to very high gamma ray spectrometric levels in the center of the area and at the eastern edge, in general, these round bodies contain especially thorium and uranium.
Two circular features (Figs. 3a and 3c) that concentrate large amounts of thorium and uranium can be seen in the center-north of this area (Fig. 2a), potassium occurs as a thin halo surround-ing these bodies, indicatsurround-ing a high degree of leachsurround-ing, on the other hand, the center of the area shows a high concentration of potas-sium (Fig. 3b). The topography in this area is higher than 1000 meters, at the eastern edge, there is a feature with NE direction
Figure 2 – Total Count Maps (2a) of the Integrated Areas 1 and 7 and the regional gamma spectrometric framework (TC, 2b), divided into three major zones based
on their gamma spectrometric characteristics (TC, 2b). It is observed that phosphate areas occur in carbonatites and metasediments, which are concentrated in high gamma ray spectrometric zones 1 and 2 (Zn1 and Zn2).
Figure 3 – (a) Thorium (eTh); (b) Potassium (K); (c) Uranium (eU); and (d) Digital Terrain Model (DTM).
that cuts the entire area where no potassium is observed (Fig. 3b) and all carbonatite bodies that host phosphate deposits are within this area.
The zone 3 (Zn3, Figs. 2a and 2b) is represented by the blue color on the map (Fig. 2b), occupies the southern part of the region, its main structures trend NW-SE, varying to E-W toward the southern end of the area, very low gamma spectrometric count, topography ranging between 600 and 800 meters. In this area, there is very low concentration of the three elements (K, eTh, eU), higher concentrations of thorium and uranium are found only in a few isolated areas in the south and southeast end (Figs. 3a and 3c). In the east-central portion, the concentration of the three elements varies, potassium concentrates in lower re-lief and drainage areas, while thorium and uranium are found in higher relief regions (Fig. 3d).
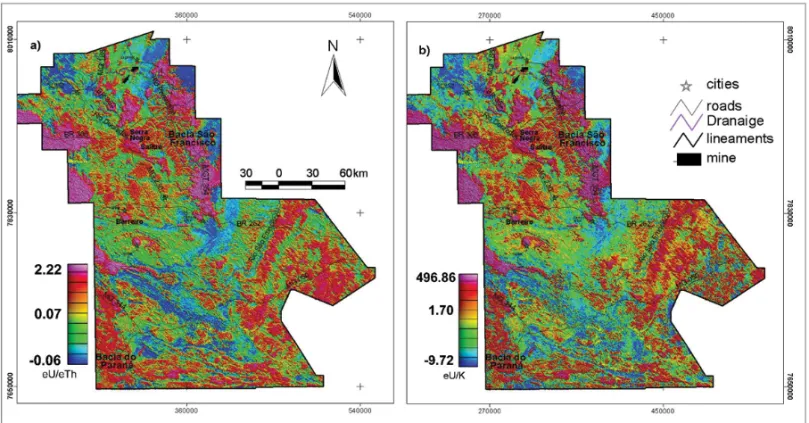
The eU/K (Fig. 4b) image shows good discrimination of rock types, including internal composition variations of some
units and the higher topography areas, such as plateaus, are shown in this picture. Comparing this ratio with the CMY image (Fig. 5b), one can see a very similar correlation with the units found in this composition, the eTh/K ratio (Fig. 4c) allowed in-terpreting the distribution of potassium related to possible alter-ation zones. The extreme east and northeast and far western areas are characterized by high values of this ratio, this ratio displays lower values in areas where potassium is concentrated, which are mostly associated with lower topography regions like valleys and drainage areas, the areas with high eTh/K ratios are associated with plateaus in the entire region. Moderate values are observed in the far south while moderate to low (green) and low (blue) concentrations occur over the remaining area.
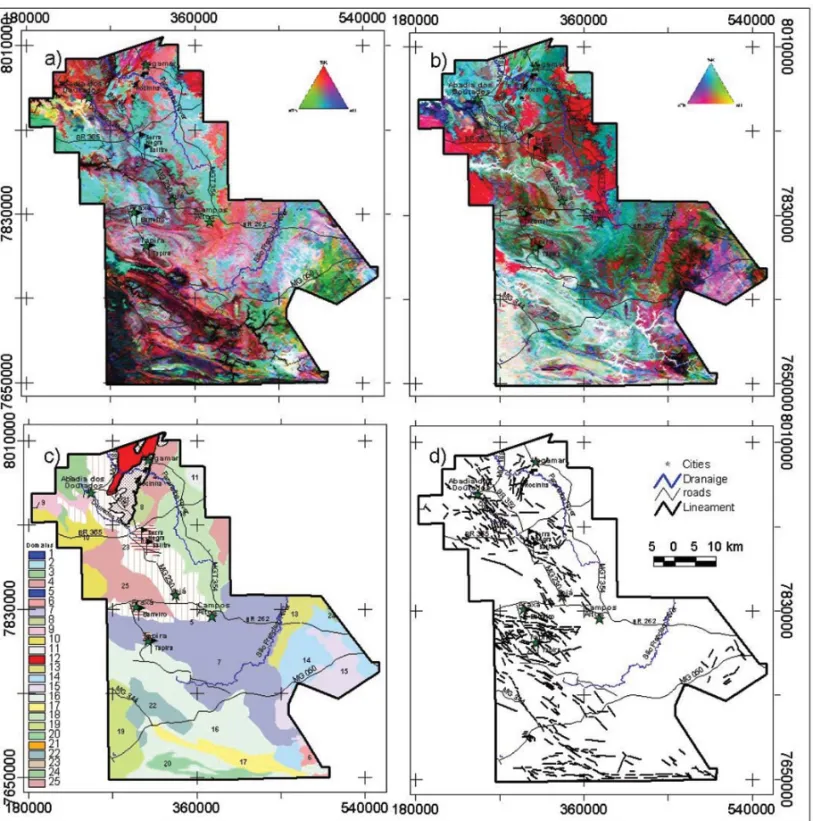
Two types of ternary images, RGB and CMY compositions (Figs. 5a and 5b) were prepared, in both cases, the three gamma ray spectrometric channels, K, eU and eTh were assigned to a pri-mary color channel. In resulting product, each pixel reproduces
Figure 4 – Maps of (a) eTh/K and (b) eU/K ratios.
the color that reflects the relative intensity values of gamma radi-ation between the three components channels, in RGB composi-tions, the amounts of the primary colors, red, green and blue, are added so that the most saturated colors (whitish) of ternary image reflect higher intensities in the three forming elements. The oppo-site occurs with less saturated portions (dark). For CMY compo-sition, the figures for the primary colors cyan, magenta and yel-low, are subtracted so that the most saturated regions are distin-guished by low expression gamma spectrometric on all channels (more saturated colors), while lower saturation brand more serv-ings gamma radiation in significant for all three channels.
In the RGB composite, red was attributed to potassium; green, to thorium; and, blue to uranium. Furthermore, in the CMY composite, cyan corresponds to potassium, magenta to thorium, and yellow to uranium. These images were used to separate the gamma spectrometric units in the study site, the RGB composi-tion is more efficient to reveal variacomposi-tions when the concentracomposi-tions are high, while the CMY composite performs better when concen-trations are lower. Ternary images proved to be excellent gamma ray spectrometric discriminators due to the variety of colors that delineate the units very effectively (Fig. 5c) and these images were overlaid on a TDM because such superimposition results in better definition of the gamma spectrometric areas and more resources to separate the units that map different soil types.
The RGB and CMY images associated with the DTM were used to assess the behavior of radioelements with respect to
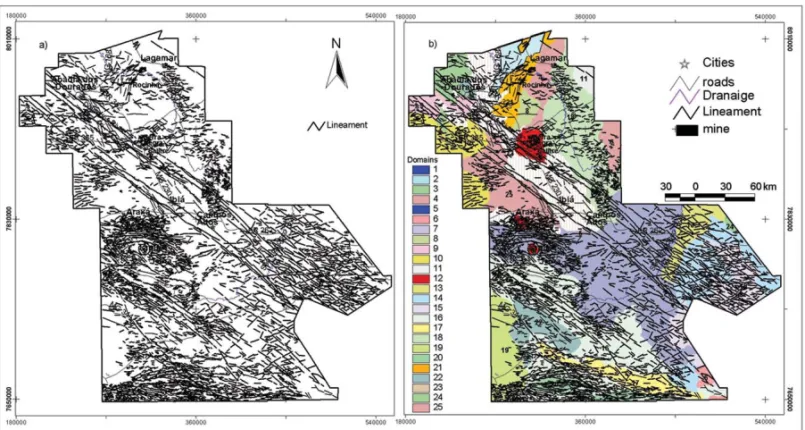
terrain topography, the interpretation consisted of visual analy-sis of the images and combining the three elements in one map to differentiate internal variations of major domains defined from the total count map. The regional map (Fig. 2b) yielded a new detailed classification (Fig. 5c) where it became possible to iden-tify new gamma spectrometric units, in addition, the regional map was integrated with the lineaments map of the area (Fig. 5d), it is noted that some units appear in more than one zone.
Zone 1 (Zn1, Fig. 2b) was subdivided into six (06) different domains using the gamma ray espectrometric maps, adding geo-logical information to the area which is not mapped in Geogeo-logical map of Alto do Parana´ıba Province (Bizzi et al., 2003) in Figure 1. The domain 2 (U2) is an important part of this area because it contains a large amount of uranium in its south-central portion (U2A, Fig. 5c), moreover, Zone 2 (Zn2) contains the highest va-riety of radio-elements and behaviors that were quite different from the other domains, as seen in Figure 5c and it was divided into twelve (12) domains. Zone 3 (Zn3) was divided into six (06) domains.
Lineaments were interpreted from all gamma ray spectro-metric images on the 1:100,000 and 1:50,000 scales (Fig. 5d), the majority represents the geological contacts between domains, the Figure 5d shows the predominance of NW-SE structures, along the central and southern extension of the area, trending from 10◦to 30◦Az and represents the main event in the area. A second set of structures, in the approximate N-S direction, can be
Figure 5 – Maps of (a) RGB composite for (K-eTh-eU); (b) CMY composite for (K-eTh-eU); (c) gamma ray spectrometric domains; and (d) lineaments obtained from
gamma RGB and CMY composite.
seen especially in the east-central and northeastern portions and a third set of linear lineaments trend NE-SW.
Magnetometry
Several techniques were applied to the magnetic data in order to enhance the structures and facilitate the differentiation of mag-netic signatures to better understand the different units domains and the following discussion shows the analysis and interpreta-tion of the results of such data. This step served to define
linea-ments, anomalies of large wavelengths, the magnetic fields, re-lationship with the structural framework, geological correlation, identification of anomalous zones and the definition of phosphate mineralization in the region, the main transformations included the anomalous magnetic field (AMF); vertical derivative (VD); Analytic Signal Amplitude (ASA); and, Analytic Signal Inclination (ASI). The analysis of this information delineated the structures and important magnetic features and the objective of interpreting the anomalous magnetic field (Fig. 6a) is to determine the pat-terns capable of individualizing the units with distinct behavior
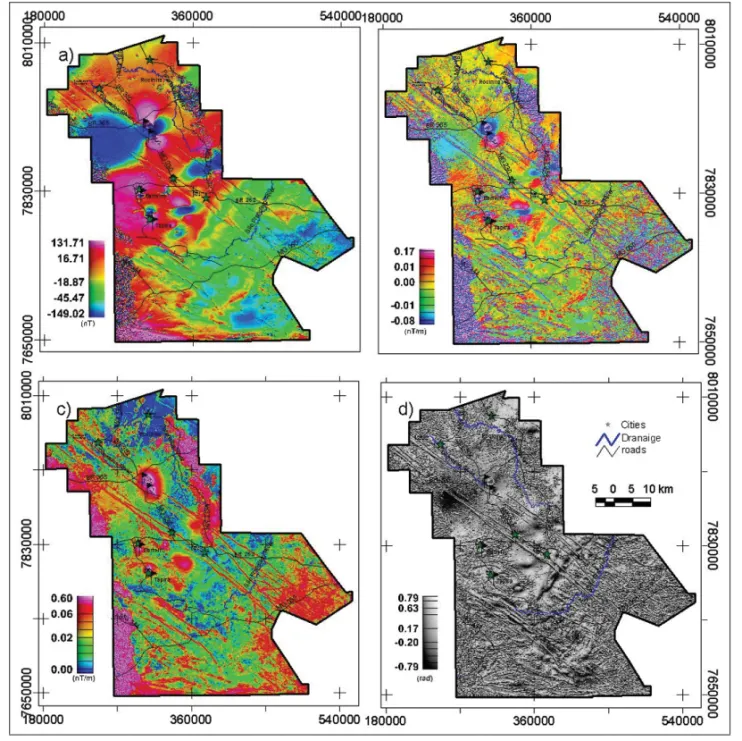
Figure 6 – Maps of (a) anomalous magnetic field (AMF); (b) first vertical derivative (VD); (c) Analytic Signal Amplitude (ASA); and, (d) Analytic
Signal Inclination (ASI), showing anomalies of short and medium wavelength trending NW-SE, mainly AMF (6a) and ASA (6c).
and signature patterns that can translate important features (linear or nonlinear) and to correlate them with mineralizations.
Overall, the analysis shows alternating bands with low val-ues (blue) and top (red) wavelengths, NW-SE trending with quite irregular behavior (Fig. 6a), where low values (blue-greenish) wavelengths are observed from center to east and from southeast to south, on the other hand, high values wavelengths are observed in parts of central and north-central, as well as in the western area (red to magenta, Fig. 6a), both domains display the general NW-SE trend and quite irregular behavior.
The northern portion, moderate values (red-yellow) predom-inate while the relief is relatively monotonous, on the other hand,
the center of the area displays different features, in this region, dipolar anomalies range between 241 nT and 2900 nT, sev-eral dipolar anomalies are observed throughout this region, with smaller dimensions wherein it is noteworthy also a number of anomalous magnetic signatures with preferential NW-SE direc-tions. This region is cut by several features that cross the entire region from NW to SE, a signature that resembles rocks in brittle deformation and this area is cut by NW-SE trending linear features (Fig. 6a).
In the southern part, the magnetic relief shows two distinct behaviors, the further south/southeast is marked by signatures with negative values (–149.02), showing WSW-ENE oriented
valleys (shades vary from blue to green), on the other hand, in the south/southwest edge, the relief is formed by a series of strongly marked peaks that stand out from the whole area and these fea-tures behave as scars well marked by valleys and ridges of high wavelengths (dark red) with 200 nT intensity, and with shallow characteristic (Fig. 6a).
The comparison between gamma spectrometric and magnetic data (Fig. 7a) shows that some features are common to both geo-physical data and the bodies that host phosphate mineralization are the areas with the highest magnetization, and it becomes evi-dent that they are the magnetization sources, as seen in the images of VD and ASA (Figs. 6b and 6c, respectively). The interpreta-tion of magnetic lineaments (Fig. 7b) allowed observing different magnetic and structural events, those that could be translated into signatures due to deformations that affected the region and rocks are marked and The main NW-SE system, located in the central region, cuts others less abundant, chiefly in the NE-SW direction (Fig. 7).
It can be said that these three systems dominate the orien-tations of linear features observed: one with NW-SE orientation (D1) that seems to pair with the second in the NE-SW direction (D2) and a third, in the E-W direction (D3) that is well represented and appears to be the last event of the three (Figs. 6 and 7). The linear features in the central area (D2) probably represent shear
zones, is cut by NW-SE lineaments, and is marked by features with approximate N40◦E direction, configuring, probably a sys-tem of sinistral strike-slip fault movement since some D2 ments are displaced by D1, this can be seen in the large linea-ment that crosses the area in the central portion, as well as other regions.
DISCUSSION AND CONCLUSIONS
The processing, integration and analysis of geophysical data yielded products that are suitable to differentiate rock types, continuity of lineaments and geophysical domains with distinct characteristics and these differences are based on the responses due to the contrasting physical properties, the characteristics of the research method and the enhancements obtained with processing.
The gamma ray spectrometric data contributed the most to separate the bodies that house phosphates in metasedimentary rocks, even the responses of these rock types to geophysical data, the best images to delineate the rocks that host sedimentary phosphate deposits are eU (Fig. 3c), U/Th (Fig. 4c), RGB and CMY (Figs. 5a and 5b). On the other hand, potassium forms a thin halo around these bodies while some portion of this element has been probably leached into the basement in the lower parts of the area (Fig. 3b).
Figure 7 – Maps of (7a) magnetic structures interpreted from the magnetic images; (7b) magnetic structures interpreted from superimposing the gamma spectrometric
Based on the geophysical data, it is observed that the phos-phate hosting bodies in the metasedimentary rocks are charac-terized as elongated, NE-SW trending, approximately 30 km long and 2 km wide, with high values of eU, eU/eTh (Fig. 8). Mag-netometry shows that these sedimentary bodies have predomi-nantly average values (0.01-0.10) and a relatively monotonous relief. The prevailing NE-SW trending structures are slightly dis-placed to the east, with the exception of the areas with circular bodies, in these areas, the lineaments display E-W trend. Small bodies with geophysical characteristics very similar to those that host the phosphates can be identified west of Rocinha. These data associated with geological data mapped for the region can be as-sociated with the sedimentary units A and B of Vazante Group and represent the Lagamar and Rocinha facies, respectively, while mineralization is observed in the whole body (Fig. 8), several
round bodies, which are very common in the area, are identified as kimberlite/kamafugites diamond carriers occurring in this region. For the phosphate hosted in carbonatites, the geophysical shows anomalies associated, the AMF image and its derivatives, vertical gradient (VD, Fig. 6b), amplitude (ASA, Fig. 6c) and phase of the Analytic Signal Inclination (ASI, Fig. 6d) were very useful to characterize the lineaments, domains and magnetic sources. On the other hand, in gamma spectrometry, the best responses were obtained from the eTh (Fig. 3a), eU (Fig. 3c), RGB and CMY (Figs. 5a and 5b) maps, potassium occurs as a thin halo around bodies that host phosphate (Fig. 3b) was totally leached into the basement rocks. In general, round carbonatite bodies are housed on the edges of lineaments, but presenting stretches and breaks at the ends probably due to structural movements, they have a high concentration of eTh and eU and concentrated potassium as
Figure 8 – Map showing the integration of chosen targets for follow up and the main NW-SE and E-W trending lineaments that control this mineralization are included
in this map. The areas in red have been identified and mapped by the geophysics as carbonatite bodies. Some regions were identified only by magnetometry. It is observed that the areas mapped to the carbonatites of Arax´a (Barreiro) and Tapira are larger than the currently known.
halos around these bodies. Generally, in the regions with phate concentration, potassium is more concentrated and phos-phate mineralization occurs at the outer edges of these bodies.
The Analytic Signal Inclination (ASI) determined the linea-ments with NW-SE, E-W and NE-SW directions, according to the structural framework known in the literature, the NW-SE linea-ments are assigned to an older event, probably from the Early Cretaceous, marked by the opening of the rift process in the re-gion and intensified in the Late Cretaceous. E-W lineaments are assigned to a later cycle or even reactivated at this stage, but it is observed that the NE-SW structures occurring in east-central area are cut by NW-SE structures, which were interpreted as the first event in the area.
Figure 8 shows the areas with known mineralization and phosphate exploitation process, and also the bodies identified through such geophysical and geological contrasts showing sub-surface bodies that may be promising areas for future phosphate abstractions in the region. Between the cities of Tapira and Cam-pos Altos, a body somewhat similar to the bodies of Serra Negra is observed and and their characteristics can be identified by the potassium, where halos surround it and magnetometry shows the characteristic aspects in other carbonatite bodies (Fig. 8). There is another body to the south/east of Tapira, which presents the geophysical characteristics of carbonatite, only identified with the magnetometric data. To the N/NE of Campos Altos, another char-acteristics signature is observed, indicating the occurrence of car-bonatites, which it might be covered up by the Bambu´ı rocks (Fig. 8). Geophysical analysis shows several carbonatite bodies in the area, some are exploited while other are still not identified and are observed only in magnetometry (Fig. 8).
They are located at the faults borders, do not exhibit regu-lar patterns, display varying shapes, some are elongated, others rounded and even flattened. The internal patterns are different, re-sulting from the influences of mineralogical variations and tropi-cal weathering that the phosphate mineralization undergoes. The carbonatite complex of Serra Negra, Salitre and Tapira belong to bebedouritic series, which are rocks produced by fractional crys-tallization of ultrapotassic silicate magma (picrite phlogopite) and modal variations in the amounts of olivine, clinopyroxene, apatite, magnetite and phlogopite, on the other hand, the Barreiro complex (Arax´a) belongs to phosphoritic series derived from phosphatic magmas with modal variations in apatite, magnetite and olivine and this differentiation is recorded by geophysics.
The integrated geological-geophysical correlation shows that magnetic fields have a direct correspondence with the geology of carbonatite due to the high content of magnetic minerals in its
composition and according to the literature the carbonatite com-plex of Alto do Parana´ıba belongs to the carbonatite-kamafugite association. Petrography states that it belongs to three different series of differentiation (bebedouritic, phosphoritic and carbon-atitic) whose evolution is closely related to processes such as fractional crystallization and/or immiscible liquids, from primitive magmas of kamafugitic affinity.
Alkali metasomatism of varying intensity transformed the pri-mary ultramafic rocks into phlogopitites in varying degree the Neoproterozoic host rocks (Gibson et al., 1995; Brod et al., 2000), the strong anomalies that cut across the central region have been interpreted as the Alto do Parana´ıba structure (Campos & Dar-denne, 1997). According to these authors, this arc divides the Paran´a and S˜ao Francisco basins whose uplift began in the Early Cretaceous, intensified in the Late Cretaceous, thus influencing the tectonic-stratigraphic evolution of the two basins. Its strong magnetization is related to the dyke swarms.
ACKNOWLEDGEMENTS
The authors are thankful to CNPq for the financial support, CODEMIG for providing the data, and Universidade de Bras´ılia for allowing the use the Laboratory of Applied Geophysics (LGA). ESRI for providing the ArcGIS 10 software, under contract no. 2011 MKL8733 and IMAGEM for the support to the software and for making the IG-UNB and ESRI contract work.
REFERENCES
ALMEIDA, FFM. 1976. O Cr´aton do S˜ao Francisco e suas faixas marginais de dobramentos. In: Congresso Brasileiro de Geologia, 29., Resumos Expandidos, Ouro Preto, Minas Gerais, Brazil: SBG, 241–215. BARBOSA O, BRAUN OPG, DYER CR & CUNHA CABR. 1970. Geologia da regi˜ao do Triˆangulo Mineiro. Rio de Janeiro, DNPM/DFPM, 140 pp. (Boletim 136).
BIONDI JC. 2003. Processos metalogen´eticos e dep´ositos minerais brasileiros. Oficina de Textos: S˜ao Paulo, Brazil, 528 pp.
BIZZI LA, SCHOBBENHAUS C, VIDOTTI RM & GONC¸ALVES JH. 2003. Geologia, Tectˆonica e Recursos Minerais do Brasil. Texto, Mapas & SIG. Servic¸o Geol´ogico do Brasil – CPRM. 642 pp.
BRAUN OPG & BAPTISTA MB. 1978. Considerac¸˜oes sobre a geologia pr´e-cambriana da regi˜ao sudeste e parte da regi˜ao centro-oeste do Brasil. Salvador. SBG/N´ucleo Bahia. Boletim Especial, 3: 225–231.
BROD JA, GIBSON SA, THOMPSON RN, JUNQUEIRA-BROD TC, SEER HJ, MORAES LC & BOAVENTURA GR. 2000. The Kamafugite-Carbonatite Association in the Alto Parana´ıba Igneous Province (APIP) Southeastern Brazil. Rev. Bras. Geociˆencias, 30(3): 408–412.
CAMPOS JEG & DARDENNE MA. 1997. Origin and tectonic evolution of the basin Sanfranciscana[in Portuguese]. Rev. Bras. Geociˆencias, 27(3): 283–294.
COSTA LAM, ANGEIRAS AG, VALENC¸A JG & STEVENAZZI V. 1970. Novos conceitos sobre o Grupo Bambu´ı e sua divis˜ao em tectonogru-pos. Rio de Janeiro. Bol. Geoc. Inst. Geociˆencias, 5: 3–34.
DARDENNE MA. 1978. Zonac¸˜ao tectˆonica na borda ocidental do Cr´aton S˜ao Francisco. In: Congresso Brasileiro de Geologia, 30., Proceedings... Recife, Brazil: SBG, I: 299–308.
DARDENNE MA. 2000. The Bras´ılia Fold Belt. In: CORDANI UG, MILANI EJ, THOMAZ FILHO A & Campos DA (Eds.). Tectonic Evolution of South America. 31st International Geological Congress, pp. 231–263. DARDENNE MA & SCHOBBENHAUS C. 2003. Dep´ositos Minerais no Tempo Geol´ogico e ´Epocas Metalogen´eticas. In: BIZZI LA, SCHOBBEN-HAUS C, VIDOTTI RM & GONC¸ALVES JH. (Eds). Geologia, Tectˆonica e Recursos Minerais do Brasil. Texto, Mapas & SIG. Servic¸o Geol´ogico do Brasil – CPRM. pp. 365–448.
DARDENNE MA, FREITAS-SILVA FH, DOS SANTOS GM & SOUZA JFC. 1997. Dep´ositos de Fosfato de Rocinha e Lagamar, Minas Gerais. In: SCHOBBENHAUS C, QUEIROZ ET & COELHO CES (Eds.). Principais dep´ositos minerais do Brasil – Rochas e minerais industriais, 4v (v. 4c). Bras´ılia, Brazil: DNPM, pp. 113–122.
DNPM – Departamento Nacional de Produc¸˜ao Mineral. 2008. Sum´ario Mineral – Edic¸˜oes 1996-2008 – Texto Fertilizantes Fosfatados Naturais. FERNANDES FRC, AD˜AO B. DA LUZ & CASTILHOS ZC. 2010. Agro-minerais para o Brasil. Centro de Tecnologia Mineral. Rio de Janeiro: CETEM/MCT.
FERRARI PG. 1989. A Formac¸˜ao Ibi´a e sua pertinˆencia ao Grupo Arax´a. In: Simp. Geol. Minas Gerais, 5., Anais, SBG Belo Horizonte, Brazil, pp. 257–261.
FONSECA MA & DARDENNE MA. 1996. Arcabouc¸o estrutural e evolu-c¸˜ao cinem´atica da faixa Bras´ılia em seu segmento setentrional. In: Con-gresso Brasileiro de Geologia, 34., Salvador. Resumos Expandidos, 6: 98–100.
FUCK RA. 1994. A Faixa Bras´ılia e a Compartimentac¸˜ao Tectˆonica da Prov´ıncia Tocantins. In: Simp´osio de Geologia do Centro-Oeste, 4., Pro-ceedings... Bras´ılia, Brazil: SBG, 1: 184–187.
GIBSON SA, THOMPSON RN, LEONARDOS OH, DICK AP & MITCHELL JG. 1995. The Late Cretaceous impact of the Trindade Mantle Plume – evidence from large-volume, mafic, potassic magmatism in SE Brazil. J. Petrol., 36: 189–229.
S´ANCHEZ E, YAG ¨UE C & GAERTNER MA. 2007. Planetary boundary layer energetics simulated from a regional climate model over Europe for present climate and climate change conditions. Geophysical Research Letters, 34: 1–6.
SANT’ANNA LG, RICCOMINI C & VALARELLI JV. 1999. Ocorrˆencia de fosfato de terras raras na Formac¸˜ao Resende, Pale´ogeno do Rift Con-tinental do Sudeste do Brasil. Revista do Instituto Geol´ogico, 20(1/2): 37–47.
SEER HJ. 1999. Evoluc¸˜ao Tectˆonica dos Grupos Arax´a, Ibi´a e Canas-tra na Sinforma de Arax´a, Minas Gerais. Doctorate thesis, Instituto de Geociˆencias, Universidade de Bras´ılia, Bras´ılia, Brazil, 267 pp. Recebido em 2 abril, 2014 / Aceito em 13 julho, 2014
Received on April 2, 2014 / Accepted on July 13, 2014
NOTES ABOUT THE AUTHORS
Leila M ´arcia Mendes Carvalho. Graduated in Geology at Universidade Federal do Par´a (1996), specialized in Geology at Universidade Federal do Par´a (1997).
M.Sc., in Geology at Universidade Federal de Ouro Preto (1999), Ph.D. in Geology and Applied Geophysics at Universidade de Bras´ılia (2006) and Post-Ph.D. in Applied Geophysics at Universidade de Bras´ılia (2014). Has experience in Geophysics with emphasis on gamma spectrometry, magnetometry and gravimetry methods applied geological mapping and mineral prospecting.
Augusto C´esar Bittencourt Pires. Graduated in Geology at Universidade Federal do Rio de Janeiro (1968). Ph.D. in Geophysics from Colorado School of Mines
(1975). Was head of the Department of Geophysics of ENCAL SA; Head of the Department of Geophysics of the National Observatory. In CNPq was Supervisor, Coordinator and Superintendent of Exact and Earth Sciences and Director. Was Program Director of CAPES and Coordinator of Policy and Plans of the MCT. Was selected as Senate Legislative Consultant. Specialized in the application of geophysical methods in geological mapping, mineral exploration and the environmental analysis. Retired Professor of Geosciences Institute, is currently Senior Researcher at Universidade de Bras´ılia.
Roberta Mary Vidotti. Associate Professor at the Instituto de Geociˆencias of Universidade de Bras´ılia. Graduated in Geology at Universidade Federal Rural do Rio de
Janeiro (1987), specialized in Geology and Marine Geophysics at Universidade Federal Fluminense (1987). M.Sc. in Geophysics from Observat´orio Nacional (1992) and Ph.D. in Geophysics at the University of Leeds (1997). Has experience in Applied Geophysics, with emphasis on gravity, magnetic and gamma ray spectrometry methods applied to regional geology, geotectonic, sedimentary basins and mineral prospecting.