Vol. 52, Special Number: pp. 259-267, November 2009
ISSN 1516-8913 Printed in Brazil BRAZILIAN ARCHIVES OF
BIOLOGY AND TECHNOLOGY
A N I N T E R N A T I O N A L J O U R N A L
Replacement of Corn Silage with Cassava Foliage Silage in
the Diet of Lactating Dairy Cows: Milk Composition and
Economic Evaluation
Geraldo Tadeu dos Santos
1*, Elisa Cristina Modesto
2, Nilson Evelázio de Souza
3, Luís
Carlos Vinhas Ítavo
4, Clóves Cabreira Jobim
1, Daniele Cristina da Silva-Kazama
5, Altair
AntônioValloto
6and Ely Mitie Massuda
7 1Departamendo de Zootecnia; Universidade Estadual de Maringá; Av. Colombo, 5790; 87020-900; Maringá – PR – Brasil. 2Departamento de Zootecnia; Universidade Federal Rural do Rio de Janeiro; Seropedica - RJ - Brasil.
3Departamento de Química; Universidade Estadual de Maringá; Maringá – PR – Brasil. 4Departamento de
Zootecnia; Universidade Católica Dom Bosco; Campo Grande - MS – Brasil; 5Universidade Estadual de Maringá; Maringá – PR – Brasil. 6Associação Paranaense dos Criadores de Bovinos da Raça Holandesa; Curitiba - PR – Brasil. 7Centro Universitário de Maringá; Maringa - PR - Brasil
ABSTRACT
This study aimed to evaluate the effect of corn silage (CS) replacement by cassava’s foliage silage (CFS) on the production and quality of milk. Twelve lactating dairy cows were used in a randomized block experimental design with four treatments and three repetitions per block. CS was replaced by CFS at the levels of 0, 20, 40, and 60%. The replacement of CS by different levels of CFS had very low effect on the variables studied. Milk density decreased when the replacement level was increased. Fatty acids 4:0 and 6:0 presented a quadratic behavior, while fat acids 8:0, 10:0, and 15:0 presented a linear behavior as their concentrations fell when CFS diet content was increased. The CS replacement by 20% until 60% CFS resulted a significant decrease in the feeding costs. The results suggested that CFS was a good replacement of CS for dairy cows.
Key words: Animal production, economic evaluation, fatty acid profile, milk production, milk quality
*
Author for correspondence: [email protected]
INTRODUCTION
One of the problems of cattle raising in Brazil is the seasonability of the forage production along the year. Thus, to avoid the shortage of roughages during the dry weather period, conservation methods are recomended, among which silage is the most used (Evangelista and Lima, 2001). A large variety of gramineae and leguminosae can be
sugarcane (Valvasori et al., 1998; Andrade et al., 2001; Magalhães et al., 2004); citrus pulp silage (Ítavo et al., 2000), cassava foliage (Modesto et al., 2004 and 2006) and manihot silage (Matos et al., 2005).
The cassava foliage is much useable as it has more leaves, and consequently, is nutritionally richer. It may be used in animal and/or human diet (Carvalho and Kato, 1987). The cassava foliage is usually lost in the field during the root crop (Euclides et al., 1988), so it could be used to feed ruminants due its high value as a forage (Normanha, 1962). Cassava may be cropped all along the year. However, in regions with predominant seasonal rains, it is cropped in the dry season or during the plant rest period, while in regions with rains all over the year, it may be cropped any time of the year (Grace, 1971). The aim of this work was to study the effects of the replacement of corn silage by cassava foliage silage on the intake of nutrients, production, and quality, fatty acid profile of milk, and its economic impact in Holstein dairy cows.
MATERIALS AND METHODS
The replacement of corn silage (CS) by cassava (Manihot esculenta Crantz) foliage silage (CFS) at
levels of 0, 20, 40, and 60% dry matter (DM) was evaluated. The total mixed feed was used to offer
an isoproteic diet (15.5% crude protein) and total digestibles nutrients (TDN) (72.5%). Twelve multiparous Holstein dairy cows with an average of 100±20 days in lactation kept in “Tie-Stall”
system were used. The cows were fed twice a day
ad libitum at 8:00 am and 4:00 pm, soon after the
morning and the afternoon milking so that there was 10% leftover feed. The animals were adapted during seven days and the data were collected in the following 14 days. The experimental period lasted for 21 days and it was repeted twice. The animals had free access to a shaded area and were allowed ingestion of complete mineral mixture ad libitum.
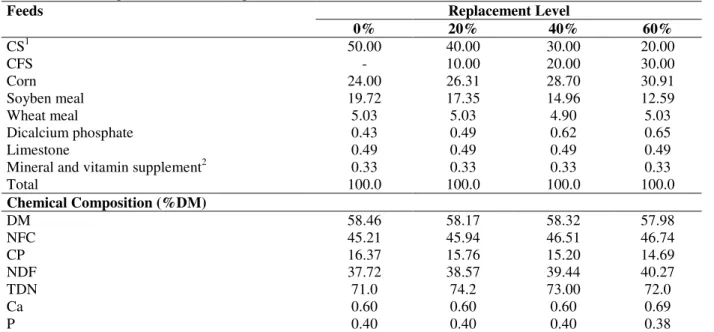
The roughage:concentrate relationship was 50:50 on dry matter basis. The following treatments were evaluated (T): T0: 50 % corn silage (CS) + 50 % concentrate; T20: 40% (CS) and 10% CFS + 50% concentrate; T40: 30% CS and 20% CFS + 50% concentrate and T60: 20% (CS) and 30% CFS+ 50% concentrate. The ingredients proportion of diets and the feeds’ chemical composition are given in Table 1.
The CS and CFS amount, concentrate fed and leftovers were recorded daily. From the 7th day of
the experimental period, the feeds were sampled and freeze-stored in plastic bags at -20 °C for later laboratory analysis. The samples were processed in Willey-type mill (1 mm) per animal/period and stored in polyethylene bottles for later analysis.
Table 1 –Percentage and chemical composition of diets (%DM)
Feeds Replacement Level
0% 20% 40% 60%
CS1 50.00 40.00 30.00 20.00
CFS - 10.00 20.00 30.00
Corn 24.00 26.31 28.70 30.91
Soyben meal 19.72 17.35 14.96 12.59
Wheat meal 5.03 5.03 4.90 5.03
Dicalcium phosphate 0.43 0.49 0.62 0.65
Limestone 0.49 0.49 0.49 0.49
Mineral and vitamin supplement2 0.33 0.33 0.33 0.33
Total 100.0 100.0 100.0 100.0
Chemical Composition (%DM)
DM 58.46 58.17 58.32 57.98
NFC 45.21 45.94 46.51 46.74
CP 16.37 15.76 15.20 14.69
NDF 37.72 38.57 39.44 40.27
TDN 71.0 74.2 73.00 72.0
Ca 0.60 0.60 0.60 0.69
P 0.40 0.40 0.40 0.38
1CS- Corn Silage; CFS – Cassava Foliage Silage; DM – Dry Matter; NFC – Non Fiber Carbohydrate; CP – Crude Protein; NDF –
Neutral Detergent Fibre; TDN – Total Digestible Nutrients; Ca – Calcium; P – Phosphore. 2Mineral Supplemen in 1,000 g: Ca,
The feed samples (CS, CFS, and concentrate) were evaluated for dry matter (DM), mineral matter (MM), crude protein (CP), and ether extract (EE) content according to Silva (1990). The neutral
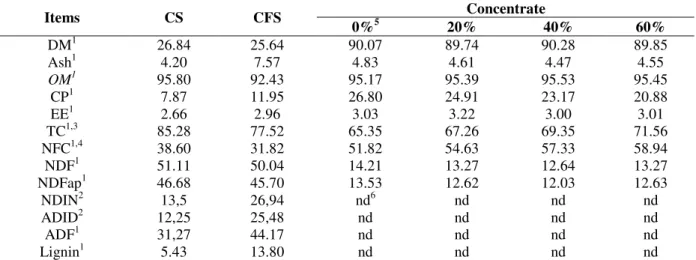
detergent fiber (NDF) and acid detergent fiber (ADF) according to the method described by Van Soest et al. (1991). The chemical compositions of feeds are shown in Table 2.
Table 2 – Chemical composition of corn silage (CS), cassava foliage silage (CFS), and concentrates based on dry matter.
Concentrate
Items CS CFS 0%5 20% 40% 60%
DM1 26.84 25.64 90.07 89.74 90.28 89.85
Ash1 4.20 7.57 4.83 4.61 4.47 4.55
OM1 95.80 92.43 95.17 95.39 95.53 95.45
CP1 7.87 11.95 26.80 24.91 23.17 20.88
EE1 2.66 2.96 3.03 3.22 3.00 3.01
TC1,3 85.28 77.52 65.35 67.26 69.35 71.56
NFC1,4 38.60 31.82 51.82 54.63 57.33 58.94
NDF1 51.11 50.04 14.21 13.27 12.64 13.27
NDFap1 46.68 45.70 13.53 12.62 12.03 12.63
NDIN2 13,5 26,94 nd6 nd nd nd
ADID2 12,25 25,48 nd nd nd nd
ADF1 31,27 44.17 nd nd nd nd
Lignin1 5.43 13.80 nd nd nd nd
1% DM – Dry matter; OM – Organic matter; CP – Crude protein; EE – Ether extract; TC – Total carbohydrates; NFC –
Non-fibrous carbohydrates; NDF – Neutral detergent fiber; NDFap – Neutral detergent fiber free of ashes and proteins; NDIN – Neutral detergent insoluble nitrogen; ADIN – Acid detergent insoluble nitrogen; ADF – Acid detergent fiber. 2% Total
nitrogenated compounds. 3TC = 100 – (CP + EE + Ashes). 4NFC = OM – (CP + EE + NDFap). 5Repleacement levels. 6nd = not
determined.
Experimental Procedure
The daily production of cows (milk yield control) was measured from the 7th to the 21st day. The
cows were milked at 6:30 am and 3:30 pm. The milk composition and quality analyses was carried out in the all samples which were stored in the containers with Bronopol (2-bromo-2-nitro-1,3-propanediol). The total solids, crude protein, fat, and lactose content of the milk samples were analyzed in a Bently 2000 infrared analyzer. Milk acidity was determined immediately after milking with Dornik solution and density was measured with a thermolactodensitometer (AOAC, 1984). The milk samples obtained on the 16th and 19th
days were stored in the containers with Bronopol and used for N-urea analysis.
Chemical analysis
The dry matter of the diets was determined in a forced-air oven according to procedure 934.01 of AOAC (1990). Total mixed diets were ground to 1 mm using a Willey mill before the analyses of N, ether extract, acid detergent fiber (ADF), and neutral detergent fiber (NDF). Total N was measured in a Tecnal TE-036/1 (Piracicaba, São Paulo, Brazil) following procedure 990.03 of
AOAC (1990). NDF and ADF concentrations, including the residual ash were measured according to the non-sequential procedures of Van Soest et al. (1991) with amylase but without sodium sulfite. Diet ether extraction was conducted with Tecnal TE-044/1 (Piracicaba, São Paulo, Brazil) according to method No. 7.060 of AOAC (1990). N, fat, and lactose concentrations in milk were determined by infrared spectroscopy (Bentley 2000; Bentley Instrument Inc., Chaska, MN, USA).
Milk fatty acids were separated by centrifugation as described by Murphy et al. (1995) and methylated according to ISO method 5509 (1978) using KOH/methanol (Synth®, São Paulo, Brazil)
and n-heptane (Vetec®, Rio de Janeiro, Brazil).
Fatty acid methyl ester profiles were measured by gas chromatography in a Shimadzu 14A chromatograph (Tokyo, Japan) with a G1315A autosampler equipped with a flame ionization detector and a CP CP-Sil-88 fused silica capillary column (50 m and 0.25 mm i.d., 0.20 µm Carbowax 20M). H2 was used as a carrier at 1.2
were identified using pure methyl ester standards (Sigma, São Paulo, SP, Brazil).
Economic analysis
For the economic analysis, the operational costs of roughage and concentrated was determined to obtain the total operational cost (CO). The roughage cost was estimated based on the ratio of corn silage and cassava foliage silage in the diet and the cost/kg of DM was multiplied by the intake. The concentrate cost was calculated based on the cost of each ingredient in the diet multiplied by the intake. Milk Gross revenue (GR) was calculated multipling the 4% fat milk corrected production by the price per litre of milk (Conseleite, 2008). The GR/CO ratio was estimated divising the GR by CO.
Statistical analysis
A randomized block experimental design with four treatments and three repetitions per block (Campos, 1984) were used. The data obtained were submitted to variance and regression analysis with SAEG 8.1 Statistics package (Statistical and Genetic Analysis System) of Federal University of Viçosa (UFV, 2001). The choice of the model took into consideration the level of significance of 5% (P< .05) by Tukey’s test and the determination coefficient (R2). The averages were compared using Tukey’s tes
t.
RESULTS AND DISCUSSION
The daily milk yield and composition and are presented in Table 3.
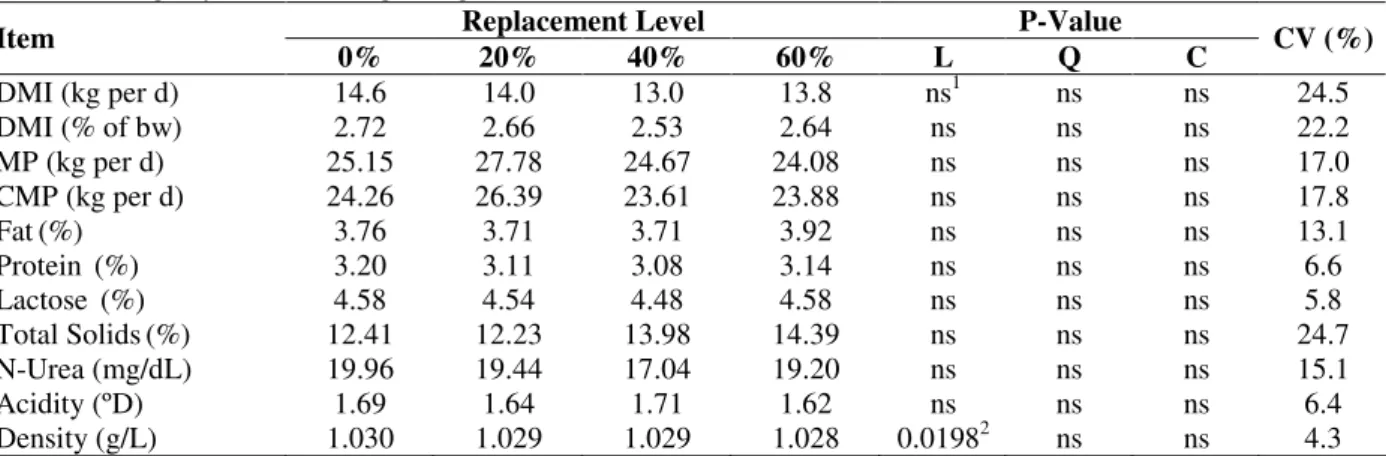
No significant effect (P>.05) was observed for the levels of replacement of CS with CFS for the variables: dry matter intake (kg/day and %BW), milk yield, 4% fat corrected milk production, fat, protein, lactose, total solids, N-urea, and acidity, which had average values of 25.42 L/day, 24.54 L/day, 3.78%, 3.13%, 4.55%, 13.25%, 18.91 mg/dL, and 1.67, respectively. Nevertheless, a decreasing effect (P<.02) was observed on milk density with the increase in replacement level. The levels of degradable nitrogen in the rumen can be obtained by dosing N-urea in milk (Jobim and Santos, 2000). The average values of N-urea in milk usually range from 12-18 mg/dL. High N-urea values in milk suggest the consumption of protein over the necessary levels or the non-uniform ingestion of dry matter (Torrent, 2000). The N-urea concentration in milk can be used to monitor the ingestion of crude protein in diet as the ingestion of excess N that may result in high N-urea concentrations in the urogenital tract and affect the reproductive performance. Additionally, the excessive consumption of crude protein increases the energy requirements and the protein supplement is a major cost component of the feeds (Broderick and Clayton, 1997).
Table 3 – Averages, descriptive levels of probability for linear (L), quadratic (Q), and cubic (C) effects and coefficient of variation (CV - %) for the dry matter intake, milk production (MP), 4% fat corrected milk production (CMP), fat, protein, lactose, total solids, N-urea, acidity, and density as a function of the different replacement levels of of corn silage by cassava foliage silage.
Replacement Level P-Value
Item 0% 20% 40% 60% L Q C CV (%)
DMI (kg per d) 14.6 14.0 13.0 13.8 ns1 ns ns 24.5
DMI (% of bw) 2.72 2.66 2.53 2.64 ns ns ns 22.2
MP (kg per d) 25.15 27.78 24.67 24.08 ns ns ns 17.0
CMP (kg per d) 24.26 26.39 23.61 23.88 ns ns ns 17.8
Fat(%) 3.76 3.71 3.71 3.92 ns ns ns 13.1
Protein (%) 3.20 3.11 3.08 3.14 ns ns ns 6.6
Lactose (%) 4.58 4.54 4.48 4.58 ns ns ns 5.8
Total Solids(%) 12.41 12.23 13.98 14.39 ns ns ns 24.7
N-Urea (mg/dL) 19.96 19.44 17.04 19.20 ns ns ns 15.1
Acidity (ºD) 1.69 1.64 1.71 1.62 ns ns ns 6.4
Density (g/L) 1.030 1.029 1.029 1.028 0.01982 ns ns 4.3
The average concentration of N-urea in milk (N/dL) in the present experiment was 18.91 mg of N/dL, which was higher than that obtained by Broderick and Clayton (1997), who reported an average value of 14.8 mg of N/dL, ranging from 3 to 28 mg of N/dL, but close to those obtanied by Da Silva et al. (2007), i.e. 17 to 18.5 mg of N/dL. The data of the present experiment was also higher than those reported by Melendez et al. (2000), whose values averaged 16 mg of N/dL. The average slightly higher than 18 mg of N/dL in the present experiment was probably due to the large participation of fraction A (protein) relative to the total nitrogenated compounds of both sources of roughages used.
Milk protein is produced using amino acids derived from the proteins digested in the small intestine. The increase of the milk protein concentration is very important to determine its value for cheese production. The milk protein content depends on the feed energy level and the availability of propionic acid. Thus, the use of silage with high content of corn grains will favors protein content in milk (Jobim and Santos, 2000). The average protein concentration in milk in this experiment was 3.13% with no significant difference (P>.05) between CS/CFS replacement levels. However, it was observed that the treatment with the highest protein concentration was the one with higher CS content, with 3.20% milk protein. The average milk production, 4% fat corrected milk production, and total solids in the present experiment were higher than those found by Deresz (2001), who worked with elephantgrass either supplemented or not during the rain season.
The average values found by this author were 112.65 L/day, 12.0 L/day, and 12.4%. In contrast, the fat and protein values were close to those of this experiment (Table 3).
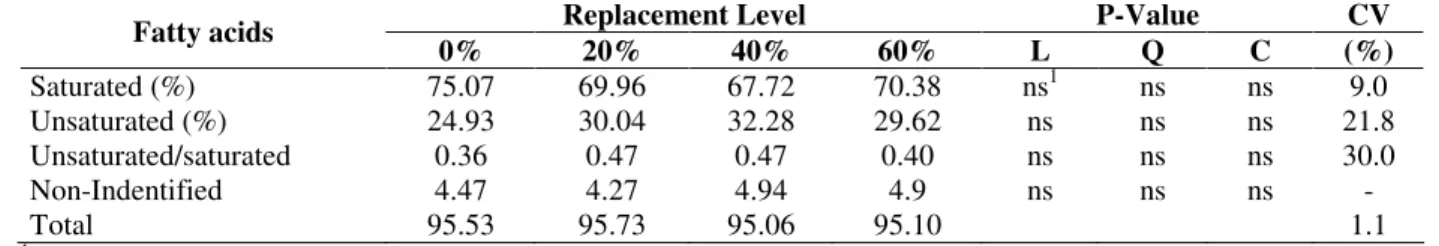
The saturation and fatty acid results are shown in Table 4. The study of the fatty acid profile of milk fat is important due to its relation with the body metabolism of lipid compounds. Experimental evidences have suggested that increasing the unsaturated fatty acids in human is associated with a reduction in the levels of cholesterol and triglycerides and an increase in the HDL concentration (Mazier and Jones, 1997).
Milk fat is constituted by medium and long chain (16 or 18 C) and short chain fatty acids (less than 14 C). Short chain fatty acids are synthesized mainly by the epithelial cells of the mammal glands (Lin and Kumar, 1971) from acetate and beta-hydroxybutyrate of the rumen. Milk fat has high contents of short chain fatty acids comparatively to those of other foods. Fatty acids, such as acetic and butyric acids, are volatile, which provide flavor and aroma to many dairy products, mainly butter and cheeses (Medeiros et al., 2001; Santos et al., 2001).
Long chain fatty acids derive directly from the feed or the body reserves, while short chain fatty acids derive from fermentation in the rumen. These fatty acids are produced in the rumen through fermentation of cellulose, which is the main source of acetic acid (Jobim and Santos, 2000). Beauchemin et al. (1994) observed about 25-28% NDF was necessary from forage to keep the milk fat content at 3.5%. The average NDF content in the ingested diets was 30.14% DM.
Table 4 – Averages, descriptive levels of probability for linear (L), quadratic (Q), and cubic (C) effects and coefficient of variation (CV - %) for the amounts of saturated and unsaturated fatty acids in milk fat (g/100 g fat) as a function of the different replacement levels of of corn silage by cassava foliage silage.
Replacement Level P-Value CV Fatty acids
0% 20% 40% 60% L Q C (%)
Saturated (%) 75.07 69.96 67.72 70.38 ns1 ns ns 9.0
Unsaturated (%) 24.93 30.04 32.28 29.62 ns ns ns 21.8
Unsaturated/saturated 0.36 0.47 0.47 0.40 ns ns ns 30.0
Non-Indentified 4.47 4.27 4.94 4.9 ns ns ns -
Total 95.53 95.73 95.06 95.10 1.1
1 ns = (P>.05).
The average concentration of unsaturated and saturated fatty acids and their ratio in milk were 29.22%, 70.78%, and .42, respectively. There was no influence on saturation level (P<0.05) of the
unsaturation levels of 51.5 and 32.8%,
respectively. Nevertheless, the
unsaturation/saturation ratio recorded was 0.63%, which was higher due to the addition of oil to the animal feed.
The fatty acid profiles can be seen in Table 5. Myristic (C14:00), palmitic (C16:00), stearic (C18:00), and oleic (C18:1 ω 9) acids were
responsible for 75.68% of the total acids, with
values of 10.07, 31.68, 11.06, and 19.36%, respectively. Stearic acid is not associated to cholesterol as it is metabolized to oleic acid by digestion, but the concentrations were lower those observed for milk goat, 20,5% (Torri et al., 2004). Lauric, myristic, and palmitic acids are undesirable as they induce an increase in blood cholesterol (Griinari et al., 1996; 1997).
Table 5 – Averages, descriptive levels of probability for linear (L), quadratic (Q), and cubic (C) effects and coefficient of variation (CV - %) for milk fatty acid profile (g/100 of total fatty acids) as a function of the different replacement levels of corn silage by cassava foliage silage.
Repleacement Level P-Value CV Fatty Acid 0 % 20 % 40 % 60 % L Q C (%)
04:00 4.002 3.202 3.362 3.660 ns 0.015 ns 13.80
06:00 3.271 2.582 2.375 2.555 ns 0.046 ns 18.05
08:00 2.018 1.596 1.372 1.481 0.012 ns ns 23.07
10:00 4.152 3.328 2.638 3.035 0.043 ns ns 29.80
12:00 3.897 3.286 2.557 2.987 ns ns ns 32.19
14:00 11.209 10.249 9.195 9.642 ns ns ns 20.21
14:1(9) ω 5 0.761 0.680 0.588 0.644 ns ns ns 49.52
15:00 0.440 0.373 0.346 0.288 0.024 ns ns 29.62
15:1 n5 0.927 0.848 0.721 0.721 ns ns ns 35.55
16:00 33.547 31.022 30.208 31.927 ns ns ns 35.26
16:1(9) ω 7 1.314 1.447 1.512 1.679 ns ns ns 32.49
17:00 0.330 0.378 0.406 0.451 ns ns ns 37.14
17:01 0.375 0.449 0.401 0.396 ns ns ns 36.21
18:00 10.761 10.869 11.795 10.814 ns ns ns 28.31
18:1n9 15.867 19.971 22.058 19.541 ns ns ns 28.09
18:1n7 1.251 1.765 1.605 1.616 ns ns ns 51.75
18:1n5 0.562 0.604 0.806 0.547 ns ns ns 46.87
18:2n6 1.792 1.998 1.749 1.926 ns ns ns 36.59
18:2n3 0.173 0.038 0.035 0.190 ns ns ns 187.0
18:3n3 0.371 0.395 0.771 0.444 ns ns ns 115.1
18:3n6 0.332 0.443 0.421 0.394 ns ns ns 33.87
20:00 0.011 0.011 0.012 0.015 ns ns ns 341.2
20:1n9 0.076 0.105 0.081 0.0803 ns ns ns 81.11
20:3n3 0.029 0.017 0.020 0.009 ns ns ns 108.66
20:4n6 0.061 0.070 0.044 0.059 ns ns ns 86.07
Non-Indentified 4.47 4.27 4.94 4.9
Total 100.0 100.0 100.0 100.0
1ns: non significant. 2Ŷ = 1.89–0.0092x, R2 70.06. 3Ŷ = 3.89-0.0202x, R2 66.17. 4Ŷ = 0.43-0.0024x, R2 97.57. 5Ŷ =
3.96-0.46x+0.0007x2, R2 90.93. 6Ŷ = 3.27-0.44x+0.0005x2,R2 99.55.
In the present experiment, the lauric, myristic, and palmitic acid profiles were not affected (P>0.05) by the addition of CFS. However, 40% replacement level of CS with CFS resulted the lowest level of these acids (2.56, 9.20, and 30.21% respectively). Saturated fatty acids (C8 - P<0.01, C10 - P<0.04, and C15 - P<0.02) decreased linearly with the increase in CFS in cow diet, while butyric (C4 - P<0.01) and caproic acids (C6 - P<0.04) presented a quadratic behavior.
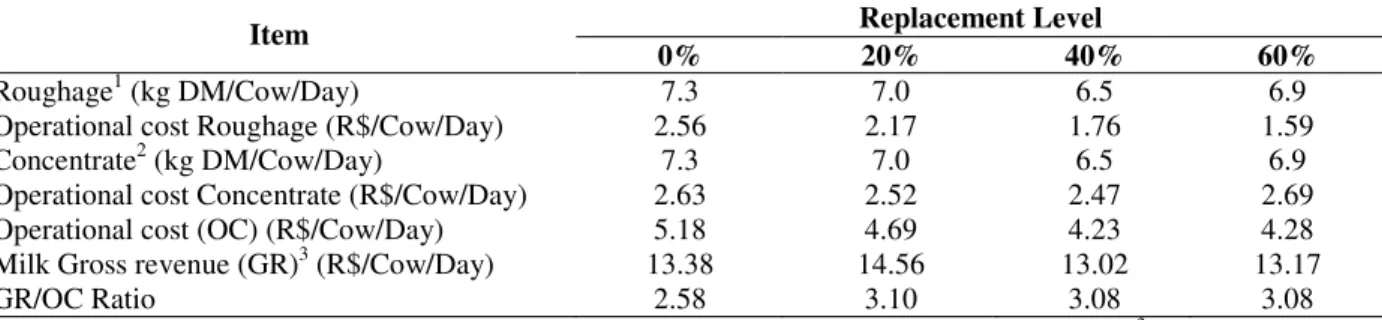
Although this economic evaluation index is not absolute, it represents quite accurately the economic variations due to the replacement of CS with CFS. These was general economic superiority of the treatments that included CFS with the great advantage of the 20% level replacement. The results as CFS showed that the profitability of the milk production system hinged on the search for
alternative sources of roughages that were economically more efficient and that allowed the maintenance of an adequate level of productivity. Considered that millions of tons of fresh cassava foliage material are left on the fields, these usage could meet the feed deficiency for cattle at a compatible cost.
Table 6 - Economic evaluation of milk yield as a function of roughage operational cost and gross milk revenue according to the different treatments.
Replacement Level Item
0% 20% 40% 60%
Roughage1 (kg DM/Cow/Day) 7.3 7.0 6.5 6.9
Operational cost Roughage (R$/Cow/Day) 2.56 2.17 1.76 1.59
Concentrate2 (kg DM/Cow/Day) 7.3 7.0 6.5 6.9
Operational cost Concentrate (R$/Cow/Day) 2.63 2.52 2.47 2.69
Operational cost (OC) (R$/Cow/Day) 5.18 4.69 4.23 4.28
Milk Gross revenue (GR)3 (R$/Cow/Day) 13.38 14.56 13.02 13.17
GR/OC Ratio 2.58 3.10 3.08 3.08
1Corn silage production cost: R$ 0.35/kg DM, Cassava foliage production cost: R$ 0.15/kg DM. 2Concentrate cost 0%
replacement: R$0.36/kg DM, 20% replacement: R$0.36/kg DM, 40% replacement: R$0.38/kg DM, 60% replacement: R$0.39/kg DM. 34% fat corrected milk production * R$0.55/milk litre (Source: Conseleite (2008).
CONCLUSION
The replacement levels observed did not lead to changes in milk production, quality and fatty acid profile, excepet some short chain saturated fatty acids (caprylic-4:0 and capric-6:0) that presented a quadratic behavior, and medium chain fatty acid (8:0, 10:0 and 15:0) that presented a linear behavior as their concentrations decreased with the increase in CFS diet content. The ratio of gross milk revenue and operational costs showed that 20 to 60% replacement was better economically than to use only corn silage. Therefore, this residue could be used in milk production to make it more economically viable.
ACKNOWLEDGEMENTS
The authors gratefully acknowledge Mr. J.A. Horst from APCBRH PARLPR Laboratory, Curitiba, PR, Brazil and Ms. C. Volpato from the Animal Nutrition and Alimentation Laboratory, UEM, PR., Brazil for assistance in laboratory analyses; and V.M. Faleiros, A.S. Sobrinho, H.A. Camargo Neto and L. Cazare for aid in cattle management in UEM Iguatemi Experimental Farm. This study was sponsored by Universidade Estadual de
Maringá, Conselho Nacional de Desenvolvimento Científico e Tecnológico (CNPq), and CAPES.
RESUMO
Objetivou-se avaliar o efeito da substituição da silagem de milho pela silagem a rama da mandioca na produção e do leite. Foram utilizadas doze vacas em lactação em delineamento experimental inteiramente casualizado em bloco com quatro tratamentos e três repetições por bloco. A silagem de milho (SM) foi substituída pela silagem de rama de mandioca (SRM) em níveis 0, 20, 40 e 60%. A substituição da silagem de milho em diferentes níveis de SRM teve pouco efeito nos parâmetros estudados. A densidade do leite diminuiu com o aumento dos níveis de substituição. Os ácidos graxos 4:0 e 6:0
apresentaram comportamento quadrático,
REFERENCES
Andrade, J. B.; Ferrari Jr. E.; Braun, G. (2001), Valor nutritivo da silagem de cana-de-açúcar tratada com uréia e acrescida de rolão-de-milho. Pesq. Agrop. Bras., 36, 1169-1174.
Association Of Official Agricultural Chemists (AOAC), (1990),Official Methods of Analysis.. 15th ed. AOAC,
Washington, DC, USA.
Beauchemin, K. A., Rode, L. M., Eliason, M. V. (1994), Chewing activities and milk production of dairy cows fed alfalfa as hay, silage, or dried cubes of hay or silage. J. Dairy Sci., 80, 324-333.
Broderick, G. A., Clayton, M. K. (1997), A statistical evaluation of animal and nutritional factors influencing concentrations of milk urea nitrogen. J. Dairy Sci.,80, 2964-2971.
Campos, H. (1984), Estatística aplicada à experimentação com cana-de-açúcar. Piracicaba:
FEALQ. 292p.
Carvalho, V. D., Kato, M. S. A. (1987), Potencial de utilização da parte aérea da mandioca. Inf. Agropec.,
13, 23-28.
Conseleite 2008. Disponível em:
www.faep.com.br/conseleite. Acesso em: 22 de julho de 2008.
Da Silva, D. C., Dos Santos, G. T., Branco,A. F. Damasceno, J. C., Kazama, K., Matsushita,M., Horst, J. A., Santos, W. B. R., Petit, H., (2007), Production Performance and Milk Composition of Dairy Cows Fed Whole or Ground Flaxseed With or Without Monensin. J. Dairy Sci., 90, 2928–2936.
Deresz, F. (2001), Produção de leite de vacas mestiças holandês x zebu em pastagem de capim-elefante, manejada em sistema rotativo com e sem suplementação durante a época das chuvas. R. Bras. Zoot., 30, 197-204.
Euclides, V. P. B., S’Thiago, L. R. L., Silva, J. M., O’Donovan, P. B. (1988), Efeito da suplementação de rama de mandioca e grão de sorgo sobre a utilização da palha de arroz por novilhos. Pesq. Agropec.Bras.,
23,.631-643.
Evangelista, A. R., Lima, J. A. (2001), Utilização de silagem de girassol na alimentação animal. In: Anais do Simpósio sobre produção e utilização de forragens conservadas. 2001, Maringá. Anais... Maringá, PR.
p.177-217.
Grace, M. (1971), Cassava processing. Rome: FAO.
124p. (Agricultural Service Bulletin, 8).
Griinari, J. M., Dwyer, D. A., Mcguire, M. A., Bauman, D.E., (1996), Partially hydrogenated fatty acid and milk fat depression. J. Dairy Sci.,79, 177(abstract).
Griinari, J. M., McGuire, D. A., Dwyer, D. A., Bauman, D. E., Palmquist, D. L. (1997), Role of insulin in the regulation of milk fat synthesis in dairy cows. J. Dairy Sci., 80, 1076-1084.
ISO, (1978), Animal and vegetable fats and oils – Preparation of methyl esters of fatty acids. 1st ed.
International Organization For Standardization, Geneva, Switzerland, pp. 1-6.
Ítavo, L. C. V., Dos Santos. G. T., Jobim, C. C., Voltolini, T. V., Ferreira, C. C. B. (2000), Substituição da silagem de milho pela silagem do bagaço de laranja na alimentação de vacas leiteiras. Consumo, produção e qualidade do leite. R. Bras. Zoot., 29, 1498-1503.
Jobim, C. C., Santos, G. T. (2000), Influência da qualidade de forragens conservadas sobre a qualidade do leite de vacas. In: II Workshop sobre produção e qualidade do leite. 2000. Maringá. Anais... Maringá,
PR. p. 1-9.
Jobim, C. C.; Sarti, L. L.; Santos, G. T.; Branco, A. F.; Cecato, U. (2006), Desempenho animal e viabilidade econômica do uso da silagem de capim elefante em substituição a silagem de milho, para vacas em lactação. Acta Scient. Animal Sci.,28, 137-144.
Lin, C. Y., Kumar, S. (1971), Primer specificity of mammary fatty acid syntheses and the role of the soluble b-oxidative enzymes. J. Biol. Chemistry, 246,
3284-3287.
Magalhães, A. L. R.; Campos, J. M. S.; Valadares Filho, S. C.; Torres, R. A.; Mendes Neto, J.; Assis, A.J. (2004), Cana-de-açúcar em substituição à silagem de milho em dietas para vacas em lactação: Desempenho e viabilidade econômica. R. Bras. Zootec., 33, 1292-1302.
Matos, D. S., Guim, A.; Batista, A. M. V.; Pereira, O. G.; Martins, V. (2005), Composição química e valor nutritivo da silagem de maniçoba (Manihot epruinosa). Arch. Zootecnia, 54, 619-629.
Mazier, P. M. J., Jones, P. J. H. (1997), Diet fat saturation and feeding state modulate rates of cholesterol synthesis in normolipidemic men. J. Nutrition,127, 332-330.
Medeiros, S. R., Gama, M. A. S., Lanna, D. P. (2001), Influência da nutrição animal na qualidade do leite e de produtos lácteos. In: Sustentabilidade da pecuária de leite no Brasil: qualidade e segurança alimentar.
Ed.: Vilela, D., Martins C. E., Bressan, M., Carvalho, L. A. Juiz de Fora, MG. p. 17-36.
Melendez, P., Donovan, A., Hernandez, J., (2000), Milk urea nitrogen and infertility in Florida Holstein cows.
Modesto, E. C.; Dos Santos, G. T.; Duarte, V.; Silva, D. C.; Faustino, J. O.; Jobim, C. C.; Detmann, E.; Zambom, M. A.; Marques, J. A. (2004), Caracterização químico-bromatológica da silagem do terço superior da rama de mandioca. Acta Scient. Animal Sc.,26, 137-146.
Modesto, E. C.; Dos Santos, G. T.; Jobim, C. C.; Cecato, U.; Silva, D. C.; Zambom, M. A. (2006), Inclusão de silagem de mandioca na alimentação de vacas em lactação, mantidas em pasto de Cynodon: consumo e digestibilidade. Acta Scient. Animal Sc.,
28, 127-135.
Murphy, J. J.; Connolly, J. F.; McNeill, G. P. (1995). Effects on milk fat composition and cow performance of feeding concentrates containing full fat rapeseed and maize distillers grains on grass-silage based diets.
Livest. Prod. Sci., 44, 1–11.
Normanha, E. S. (1962), Farelo de ramas e folhas de mandioca. O agronômico,. 14, 16-9.
Ruiz, R. L., Munari, D. P., (1992), Microbiologia da silagem In: RUIZ, R.L. (Ed.) Microbiologia Zootécnica, São Paulo: Ed. Roca, p.97-122.
Santos, F. L., Coelho Silva, M. T., Lana, R. P., Brandão, S. C. C., Vargas, L. H., Abreu, R. (2001), Efeito da suplementação de lipídios na ração sobre a produção de ácido linoléico conjugado (CLA) e a composição da gordura do leite de vacas. R. Bras. Zootec., 30, 1931-1938.
Silva, D. J. (1990). Análise de alimentos (métodos químicos e biológicos). 2ed. Viçosa: UFV. Imprensa
Universitária. 165p.
Torrent, J. (2000), Nitrogênio uréico no leite e qualidade do leite. In: II Simpósio internacional sobre qualidade do leite. 2000. Curitiba. Anais... Curitiba,
PR, 27-29.
Universidade Federal de Viçosa – UFV. SAEG –
Sistemas de Análises Estatísticas e Genéticas. Versão
8.1. Viçosa, MG : 2001. 150p. (Manual do Usuário). Torii, M. S.; Damasceno, J. C.; Ribeiro, L. R.; Sakaguti,
E. S.; Dos Santos, G. T.; Matsushita, M.; Fukumoto, N. M. (2004). Physical-Chemical characteristics and fatty acids composition in dairy goat milk in response to roughage diet. Braz. Arch. Biol. Technol.,47:
903-909.
Valvasori, E.; Lucci, C. S.; Pires, F. L.; Arcaro, J. R. P.; Arcaro Jr. I. (1998), Silagem de cana-de-açúcar em substituição a silagem de sorgo granífero para vacas leiteiras. Braz. J. Vet. Res. Animal Sci.,35, 139-142.