http://www.uem.br/acta ISSN printed: 1679-9275 ISSN on-line: 1807-8621
Acta Scientiarum
Doi: 10.4025/actasciagron.v36i1.14854
The use of photothermal quotient and frost risk to identify suitable
sowing dates for wheat
Raphael Rossi Silva1, Giovani Benin1*, José Abramo Marchese1, Éder David Borges da Silva2
and Volmir Sérgio Marchioro3
1
Programa de Pós-graduação em Agronomia, Universidade Tecnológica Federal do Paraná, Via do Conhecimento, km 1, 85503-390, Pato Branco, Paraná, Brazil. 2Universidade Federal de Santa Maria, Santa Maria, Rio Grande do Sul, Brazil. 3Cooperativa Central de Pesquisa Agrícola, Cascavel, Paraná, Brazil. *Author for correspondence. E-mail: [email protected]
ABSTRACT. The potential yield of wheat is mainly determined by temperature, solar radiation and the photothermal quotient. The objective of this study was to determine the temporal and spatial variability of the photothermal quotient and the frost risk to identify suitable sowing dates for wheat in Parana State, Brazil. The results showed that the photothermal quotient has greater spatial variability than temporal variability. The sowing date affects crop conditions that can in turn affect yield. However, the photothermal quotient and frost risk fluctuate differently in different Value for Cultivation and Use (VCU) regions. The regions VCU 1 and VCU 2 showed greater temporal variability of the photothermal quotient. The photothermal quotient ranged from 1.5 to 2.0 MJ m-2 day ºC in VCU 1, from 1.1 to
1.5 MJ m-2 day ºC in VCU 2 and from 1.0 to 1.2 MJ m-2 day ºC in VCU 3. Sowing performed in June
provided the greatest photothermal quotient in all VCU regions. However, June sowing increased the frost risk in VCU 1. Thus, the sowing date can be used as a management tool for the attainment of higher yield in wheat.
Keywords:Triticum aestivum (L.), yield potential, solar radiation.
Uso do quociente fototermal e risco de geadas na identificação de época de semeadura
adequadas em trigo
RESUMO. O potencial de rendimento de grãos em trigo varia, principalmente, em função da temperatura, radiação solar e do quociente fototermal. O objetivo foi estudar a variabilidade temporal e espacial do quociente fototermal (QF) e o risco de geadas visando identificar épocas de semeadura para a cultura do trigo que propicie o maior rendimento de grãos no estado do Paraná, Brasil. Os resultados demonstraram que há maior variabilidade do QF no espaço em relação ao tempo. A época de semeadura afeta as condições de crescimento da cultura, podendo incrementar o rendimento de grãos. Entretanto, o QF e o risco de geadas variam conforme a região de VCU. As regiões de VCU 1 e 2 apresentaram a maior variabilidade temporal do QF. A variação temporal para a região de VCU 1 ficou entre 1,5 a 2,0 MJ m-2 dia ºC (VCU 1),
1,1 a 1,5 MJ m-2 dia ºC (VCU 2) e 1,0 a 1,2 MJ m-2 dia ºC. Em todas regiões de VCU, semeaduras
realizadas no mês de junho proporcionam o maior valor de QF. Entretanto, há elevado risco de geadas na região de VCU 1 quando a semeadura ocorre em junho. Assim, a época de semeadura pode ser uma importante ferramenta no manejo para alto rendimento de grãos em trigo.
Palavras-chave:Triticum aestivum (L.), potencial de rendimento, radiação solar.
Introduction
Wheat is one of the world’s most important crops for human nutrition and animal feed. The southern states of Brazil are a major wheat-growing area, accounting for nearly 90% of the wheat produced in Brazil. The state of Parana is the biggest wheat producer, accounting for approximately 60% of the country’s total production. Parana has substantial climatic diversity and altitudes that vary from sea level up to nearly 1,300 meters, influencing wheat grain yield.
Acta Scientiarum. Agronomy Maringá, v. 36, n. 1, p. 99-110, Jan.-Mar., 2014
Wheat yield can be separated into its numeric components, e.g., the number of kernels harvested per unit area (NK) and the individual weight of these kernels (KW). NK is affected by temperature (which determines the duration of the spike growth period) and absorbed solar radiation (which defines the amount of energy available during spike growth). Variations in NK have been explained by PQ during the spike growth period (AHMED et al., 2010; FISCHER, 1985; MAGRIN et al., 1993).
Several studies have shown that PQ best predicted GY when the value of PQ was highest near anthesis (AN). Fischer (1985) concluded that the critical period for determining NK comprises about 20 days before AN. However, further studies showed that the critical period spans about 20 days before to 10 days after AN (ABBATE et al., 1997; ORTIZ-MONASTERIO et al., 1994). Ortiz-Monasterio et al. (1994) stated that KW was associated with the length of the grain-filling period. Thus, an increase in GY is possible with an increasing NK and an increasing duration of grain-filling (GAJU et al., 2009; MAGRIN et al., 1993). Likewise, Abbate et al. (1997) showed that the end of the spike growth period was 7 days after AN, and NK is sensitive to changes in radiation around this phenological stage. Therefore, PQ may be used as a tool to identify sowing times and regions that maximize grain yield potential (CUNHA et al., 2005; MAGRIN et al., 1993; NALLEY et al., 2009).
Frost damage can cause yield losses in wheat (KOVÁCS et al., 2011; SILVA et al., 2008). Frequently, farmers choose wheat sowing dates to minimize frost risk at the critical time (FULLER et al., 2007; LIVINGSTON et al., 2005; SUBEDI et al., 2007; WHALEY et al., 2004). The critical temperature for frost damage varies with the stage of wheat development. The greatest susceptibility to frost damage occurs during AN; wheat at this stage can be damaged when the air temperature falls below -5ºC (FULLER et al., 2007; LIVINGSTON et al., 2005).
Several studies have reported an increase in GY caused by optimal sowing times when combined with cultivars that escape frost damage at AN (BASSU et al., 2009, 2010; MAGRIN et al., 1993; SHARMA et al., 2008). Sharma et al. (2008) stated that the length of the ideal sowing season at a given location is inversely proportional to the yield potential. However, some authors have described the PQ effect on yield across different sowing dates (BASSU et al., 2010; MAGRIN et al., 1993). For example, Bassu et al. (2010) observed that PQ across
different sowing dates explained most of the variation in both spike weight and NK; the correlation between NK and PQ before AN was more sensitive to the environmental variation induced by sowing times.
The objective of this study was to characterize the temporal and spatial variability of the photothermal quotient (PQ) and the frost risk in Parana State, Brazil to identify sowing dates for wheat that optimize yield potential.
Material and methods
To define and map the suitability of cropping regions for different sowing dates in Parana State, climate data (solar radiation and minimum and mean temperature) were obtained from 22 meteorological stations (Table 1) of the SIMEPAR Technological Institute. These 22 meteorological stations are located in different Value for Cultivation and Use (VCU) regions: VCU 1 - cold, wet, high altitude; VCU 2 - moderately hot, wet, low altitude; and VCU3 - hot, moderately dry, low altitude.
Table 1. Latitude, longitude, altitude and starting year of the climate data from the 22 SIMEPAR stations in Parana State, Brazil.
Municipality Latitude (S)
Longitude (W)
Altitude (m)
Year of beginning of the data series VCU 1¹ Region
Curitiba 25°25' 49°16' 945 1997
Guarapuava 25°21' 51°30' 1058 1997
Lapa 25°47' 49°46' 910 1997
Palmas 26°29' 51°59' 1100 1998
Pinhão 25°41' 51°39' 1041 2003
Ponta Grossa 25°13' 50°10' 880 1997 VCU 2² Region
Campo Mourão 24°02' 52°22' 630 1997 Cândido de Abreu 24°28' 51°15' 645 1997
Cascavel 24°53' 53°33' 660 1997
Foz do Iguaçu 25°32' 54°35' 164 1998
Jaguariaíva 24°15' 49°42' 850 2000
Nova Prata do
Iguaçu 25°37' 53°20' 438 1998
Palmital 24°53' 52°12' 840 1997
Pato Branco 26°70' 52°21' 700 1997
Toledo 24°42' 53°44' 550 1997
VCU 3³ Region
Cambará 23°02' 50°04' 545 1997
Cianorte 23°40' 52°35' 530 2002
Londrina 23°22' 51°10' 585 1997
Maringá 23°25' 51°57' 596 1998
Palotina 24°18' 53°55' 310 1997
Paranavaí 23°50' 52°26' 480 1997
Umuarama 23°44' 53°17' 480 1997
1Cold, wet and high altitude; 2moderately hot, wet and low altitude; 3hot, moderately dry and low altitude.
Degree days – Data regarding emergence (EM),
by Embrapa Trigo in partnership with the Fundação Pró-Sementes. It has early maturity, low plant height, and intense tillering, and it shows wide adaptability and high potential yield (SCHEEREN et al., 2007).
The degree day (DD, ºC day) was determined by modifying the equation DD = N(Tm-Tb), where N = duration of the subperiod under study, Tm = mean air temperature (defined as the average of the maximum daily temperatures and the minimum daily temperatures), and Tb = basal temperature bellow which crop development is halted of the subperiod under study (GILMORE JR.; ROGERS, 1958). An estimate of accumulated degree days (ADD, ºC day) was obtained by the sum of the DDs. The modified equation is
expressed as follows: ADD = ∑
(Tmd-Tb1)+∑(Tmd-Tb2)+∑(Tmd-Tb3)+∑(Tmd-Tb4),
in which Tmd = mean daily temperature and Tb1, Tb2, Tb3 and Tb4 refer to the basal temperatures in the phenophases EM-DR, DR-TS, TS-AN, and AN-PM, respectively. The basal temperatures used for each phenophase as follows: 4.8ºC (EM-DR), 0.9ºC (DR-TS), 8.4ºC (TS-AN) and 8ºC (AN-PM). The thermal time calculation method affects wheat phyllochron estimates (ROSA et al., 2009). When Tb > Tm, the DD was null.
Degree days were used to predict the crop cycle and dates of the phenophases of the cultivar BRS Guamirim for 22 locations in the state of Paraná. We simulated 14 sowing dates, each 10 days apart, beginning on 3/10 and terminating on 7/20 (the earliest and latest sowing dates, respectively). These are the sowing dates recommended by IAPAR (2010).
Photothermal quotient – The PQ was
determined according to the model proposed by Fischer (1985): PQ = Rs/(Tmed-Tb). Here, PQ
is the daily photothermal quotient (MJ m-2 day
°C), Rs is the global solar radiation (MJ m-2 day),
Tmed is the mean daily temperature (°C) and Tb is the basal temperature. PQ was calculated for each day in the period TS-AN, using the basal temperature of 8.4ºC. The mean photothermal quotient was obtained for the period TS-AN for each of the 22 locations across all simulated sowing times.
Frost – The occurrence of probable frost was
calculated for the 10 days before and the 5 days after the probable anthesis dates (CUNHA et al., 2001), which were simulated using degree days. Frost risk was recorded when temperatures in the meteorological shelter dropped below 3ºC. This is
because the temperature in ground-level vegetation is generally 3 to 5ºC less than the air temperature in meteorological shelters (GRODZKI et al., 1996).
This estimate was obtained as follows: P =
(y/(n+1))*100, where P = probable occurrence of
frost (as a percentage) based on the occurrence of
low temperatures (below 3°C), y = number of years
in the historical data in which a temperature below
3ºC occurred, and n = total number of years in the
climate data.
Kriging – A simple kriging technique was used
to spatialize the values of the photothermal quotient, frost risk and crop cycle of wheat BRS Guamirim for Parana state for each sowing date. The kriging technique enables prediction of the variables in unmeasured locations. This statistic was obtained by using R software (R DEVELOPMENT CORE TEAM, 2010) and the geoR package (RIBEIRO JR.; DIGGLE, 2001).
Suitable sowing dates for each region were calculated with the following criteria: a high value of PQ and a maximum limit of 30% probability of frost occurrence (CUNHA et al., 2001). Maps of the 14 possible sowing dates were generated based on the criteria described above. These maps classified the regions as suitable (colored green) and unsuitable (colored red) for wheat sowing on each of the simulated dates.
Results and discussion
Calculated values of degree days (DD) are presented in Table 2. The results showed that more than 60% of the cycle of the cultivar BRS Guamirim was included in the period TS-PM, indicating the importance of the duration of this period in determining the yield potential of the crop.
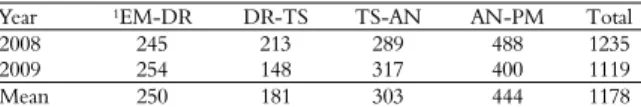
Table 2. Values of degree days (ºC day) estimated for the cultivar BRS Guamirim.
Year ¹EM-DR DR-TS TS-AN AN-PM Total
2008 245 213 289 488 1235
2009 254 148 317 400 1119
Mean 250 181 303 444 1178
1EM = emergence; DR = double ridge; TS = terminal spikelet; AN = anthesis; PM = physiological maturity.
Acta Scientiarum. Agronomy Maringá, v. 36, n. 1, p. 99-110, Jan.-Mar., 2014 Figure 1. Mean number of days from TS to AN (A) and mean
number of days from EM to PM (B) in the cultivar BRS Guamirim in different regions in Parana State.
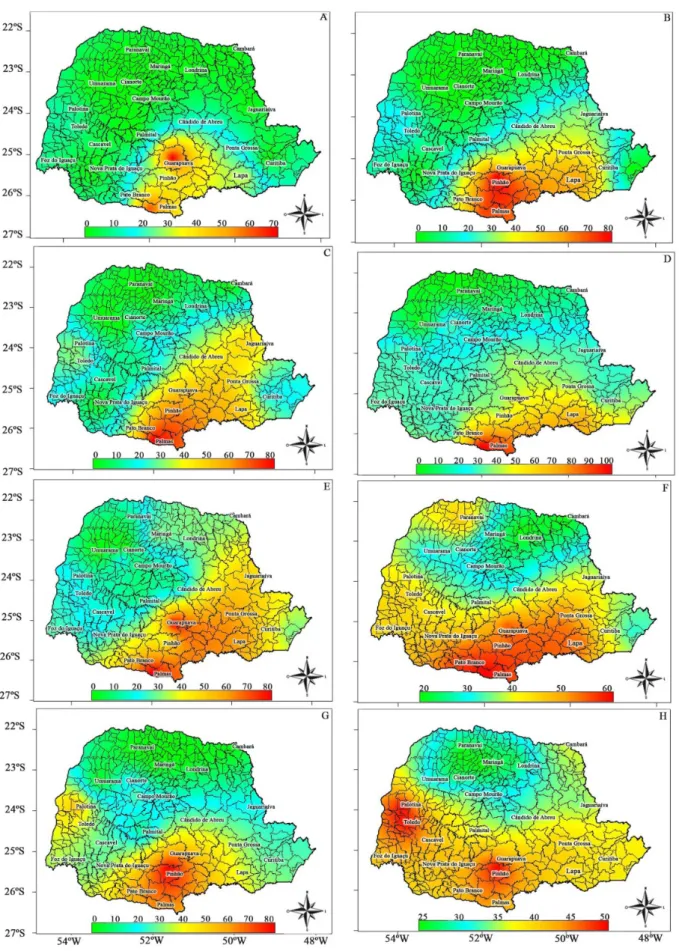
Examining the spatial variability of PQ at different simulated sowing times (Figures 2 and 3) showed that the greatest values of PQ occurred in regions with latitudes greater than 25ºS and longitudes from 53 to 49ºW (VCU 1). The north and northeast regions of the state (VCU 3) had lower PQ values. Likewise, Cunha et al. (2005) observed that the greatest PQ values in Rio Grande do Sul State, Brazil, were found in the Northeast and Southwest regions of the state, corresponding to VCU 1 regions. The regions of Palmas, Guarapuava, Pinhão and Ponta Grossa (VCU 1) had an elevated PQ. At Palmas (VCU 1), the greatest PQ was
observed (1.9 MJ m-2 day ºC), with little temporal
variability. However, locations at latitudes less than 25ºS (VCU 2 and 3) had a small increase in PQ values with a later sowing date.
According to Bassu et al. (2010), an increase of
PQ from 0.14 to 1.7 MJ m-2 day ºC increased
average ear number from 83 to 270 g m-2 and
increased the number of grains per area from 2,638
to 13,993 grains m-2. In addition, they observed that
the increase in number of grains per area could be
maximized by the management of sowing time. Rodrigues et al. (2007) likewise observed a linear trend (r = 0.83) of an increase in grain yield with the lengthening of the TS-AN phenophase. Magrín et al. (1993) and Cunha et al. (2005), in Argentina and in Rio Grande do Sul State (Brazil) respectively, also identified regions and sowing times of lower production potential. Decreases in spike weight occur when the crop cycle is short and there is a low PQ value (BASSU et al., 2010).
High grain yield potential occurs when there is a high PQ value (MENÉNDEZ; SATORRE, 2007). Likewise, Magrín et al. (1993) observed that in Argentina, in the regions of Balcarce, Pergamino, Marcos Juarez and Parana, grain yield was positively associated with the number of grains per area and with PQ. The region of Balcarce (with a PQ of
2.18 MJ m-2 day ºC)showed the greatest grain yield
(5,212 kg ha-1), whereas the Paraná region in
Argentina (with a PQ of 1.5 MJ m-² day ºC) showed
a grain yield of 2,725 kg ha-1. Evaluating adapted
cultivars with adequate management, sowing time and crop treatments, Bassoi et al. (2005) and Brunetta et al. (2006) observed yields between 4,315
and 4,633 kg ha-1 in the VCU 3 region, indicating
high grain yield potential even in regions of lower PQ. However, Franceschi et al. (2010), evaluating 17 wheat cultivars in six locations in Parana State, Brazil, observed mean grain yields of 4,581, 4,206
and 3,552 kg ha-1 in the regions VCU 1, 2, and 3,
respectively. Moreover, Benin et al. (2013) observed
mean grain yields of 3,738, 3,405 and 3,169 kg ha-1
in the regions VCU 1, 2, and 3, respectively. Thus, these results confirm greater yield potential in regions of greater PQ.
While PQ integrates environmental conditions, i.e., radiation and temperature, it does not consider crop conditions. Management practices, such as the use of adapted cultivars, the choice of sowing time and the application of fertilizer, affect crop conditions (BINDRABAN et al., 1998). Moreover, Ahmed et al. (2010) stated that management practices such as sowing time may be used as a tool to manage PQ. Therefore, the similar yields in the regions VCU 1 and VCU 3 could be partly due to crop management practices.
Figure 2. Mean photothermal quotient (MJ m-² day ºC) in the subperiod TS to AN for wheat in Parana State with sowing dates of 03/10
Acta Scientiarum. Agronomy Maringá, v. 36, n. 1, p. 99-110, Jan.-Mar., 2014 Figure 3. Mean photothermal quotient (MJ m-² day ºC) in the subperiod TS to AN for wheat in Parana State with sowing dates of 05/30
(A), 06/10 (B), 06/20 (C), 06/30 (D), 07/10 (E), and 07/20 (F).
The risk of frost in the VCU 3 region (Cambará, Londrina, Maringá, Cianorte and Umuarama) and the VCU 2 region (Campo Mourão) was low, while in the west region (Foz do Iguaçu, Cascavel, Toledo and Palotina) the risks were greater for sowing dates after 04/30 (Figure 4F). The low probability of frost occurrence in the north region (VCU 3) corroborates the findings of Cunha et al. (2001), who observed frost
Acta Scientiarum. Agronomy Maringá, v. 36, n. 1, p. 99-110, Jan.-Mar., 2014 Figure 5. Probability of occurrence (%) of a temperature less than 3 ºC in Parana State in the 10 days before and the 5 days after anthesis, considering an early cycle cultivar and sowing dates of 05/30 (A), 06/10 (B), 06/20 (C), 06/30 (D), 07/10 (E), and 07/20 (F).
In the VCU 1 region, where the highest altitude areas are located, the high risk of frost for the earliest simulated sowing dates indicates the unviability of early cycle wheat cropping for cultivars such as BRS Guamirim. By contrast, wheat in the north region of the state (VCU 3) may be sown at the earliest simulated dates without frost risk (Figures 6 and 7). These results support the conclusions of Cunha et al. (2001), who affirmed that the regions north of 24ºS had frost risks less than 30% and that wheat in the South of Parana State must be sown later to avoid frost risk.
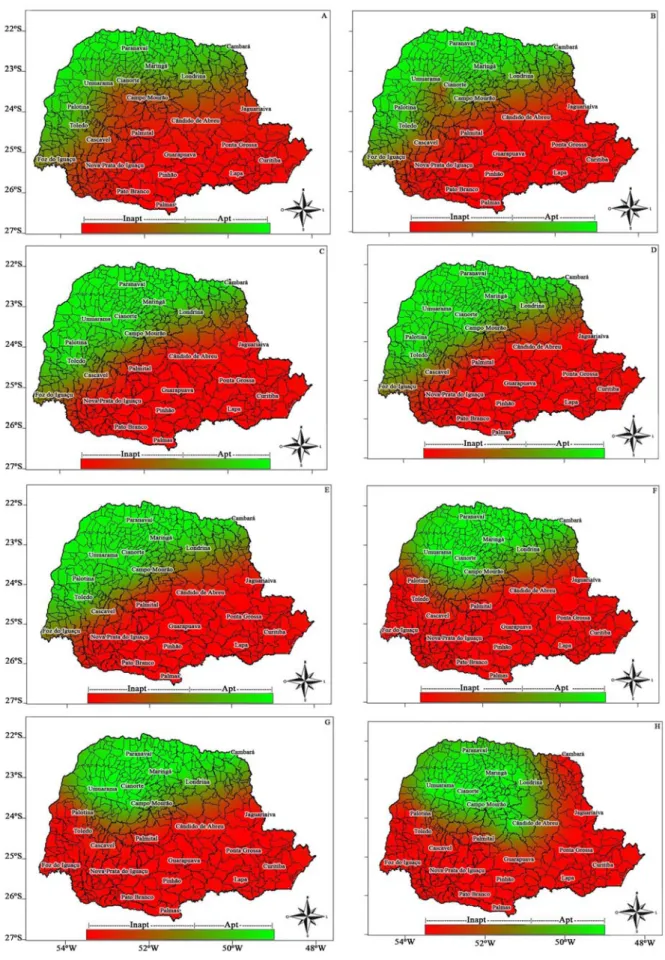
Acta Scientiarum. Agronomy Maringá, v. 36, n. 1, p. 99-110, Jan.-Mar., 2014 Figure 7. Suitability of the regions of Parana State for undertaking sowing on 05/30 (A), 06/10 (B), 06/20 (C), 06/30 (D), 07/10 (E), and 07/20 (F).
The greatest values of PQ were observed at the earliest sowing dates, indicating that early sowings have the greatest grain yield potential. PQ is important to determine the suitability of the regions of Parana State for each of the simulated sowing dates. Suitability was determined based on the occurrence of greater PQ values in the TS-AN period and, at most, 30% of the years with temperature below 3ºC in the 10 days before and the 5 days after AN (Figures 6 and 7).
It was observed that sowings performed from 03/10 to 05/10 (Figure 6A to 6G) were suitable
(colored green) for the VCU 3 and VCU 2 regions (only Campo Mourão and Toledo), except for the sowing on 03/10 for Campo Mourão and the sowings on 04/30 and 05/10 in Toledo and Palotina. By contrast, the sowings performed from 05/20 (Figure 6H) to 05/30 (Figure 7A) were suitable only for VCU 3 and the northeast region, with the exception of Cambará on 05/20 (Figure 6H).
(VCU 2) and Curitiba (VCU 1). The latest sowing dates, from 06/20 to 07/20 (Figures 7C to 7F), were suitable for the greater part of the center, southwest, southeast and east regions, except for sowing on 06/20 (Figure 6C) in Pato Branco (southwest) and Guarapuava (center-south), and sowing on or after 06/30 (Figure 6D) in Nova Prata do Iguaçu.
The results obtained for the best sowing dates for each region in this study are in accordance with Cunha et al. (2001), who emphasized that the sowing of early cycle wheat cultivars must be timed to avoid frost losses by ensuring that heading does not occur in the month of July. Wrege et al. (2005) observed that all regions of Parana State experienced frost in July.
These results on suitable sowing dates for different regions fall within the sowing interval recommended by IAPAR (2010); however, in most cases, these results suggest narrower sowing period. Thus, it appears possible to adequately identify sowing times based on PQ and frost risk by assigning greater influence to the stage in which differentiation of flower primordia occurs and frost risks are lower.
Conclusion
The temporal and spatial variation of photothermal quotient and the probability of frost occurrence informed the choice of favorable sowing times for each region in Paraná State. Moreover, this study showed considerable spatial variation but little temporal variation of the photothermal quotient in Parana State. Sowing performed in June provides the greatest photothermal in all Value for Cultivation and Use regions. However, the frost risk in the Value for Cultivation and Use 1 region is higher when sowing occurs in June.
Acknowledgements
The first author acknowledges to Coordenação de Aperfeiçoamento de Pessoal de Nível Superior (CAPES) by fellowship granted.
References
ABBATE, P. E.; ANDRADE, F. H.; CULOT, J. P.; BINDRABAN, P. S. Grain yield in wheat: effects of radiation during spike growth period. Field Crops Research, v. 54, n. 3, p. 245-257, 1997.
AHMED, M.; HASSAN, F. U.; ASSIM, M.; ASLAM, M. A.; AKRAM, M. N. Correlation of phototermal quotient with spring wheat yield. African Journal of Biotechnology, v. 9, n. 46, p. 7852-7869, 2010.
BASSOI, M. C.; BRUNETTA, D.; DOTTO, S. R.; SCHEEREN, P. L.; CAETANO, V. R.; TAVARES, L. C.
V.; MIRANDA, L. C. Características e desempenho agronômico no Paraná da cultivar de trigo BRS 220. Pesquisa Agropecuária Brasileira, v. 40, n. 2, p. 193-196, 2005.
BASSU, S.; ASSENG, S.; MOTZO, R.; GIUNTA, F. Optimizing sowing date of durum wheat in a variable Mediterranean environment. Field Crops Research, v. 111, n. 1-2, p. 100-118, 2009.
BASSU, S.; GIUNTA, F.; MOTZO, R. Effects of sowing date and cultivar on spike and kernel number in durum wheat. Crop and Pasture Science, v. 61, n. 4, p. 287-295, 2010.
BENIN, G.; STORCK, L.; MARCHIORO, V. S.; FRANCO, F. A.; SCHUSTER, I. Precisão experimental de ensaios de trigo em regiões homogêneas de adaptação. Pesquisa Agropecuária Brasileira, v. 48, n. 4, p. 365-372, 2013.
BINDRABAN, O. S.; SAYRE, K. D.; SOLIS-MOYA, E. Identifying factors that determine kernel number in wheat. Field Crops Research, v. 58, n. 3, p. 223-234, 1998.
BRUNETTA, D.; BASSOI, M. C.; DOTTO, S. R.; SCHEEREN, P. L.; MIRANDA, M. Z.; TAVARES, L. C. V.; MIRANDA, L. C. Características e desempenho agronômico da cultivar de trigo BRS 229 no Paraná. Pesquisa Agropecuária Brasileira, v. 41, n. 5, p. 889-892, 2006.
CUNHA, G. R.; HAAS, J. C.; MALUF, J. R. T.; CARAMORI, P. H.; ASSAD, E. D.; BRAGA H. J.; ZULLO JR., J.; LAZZAROTTO, C.; GONÇALVES, S.; WREGE, M.; BRUNETTA, D., DOTTO, S. R.; SILVEIRA, H.; PIMENTEL, M. B. M.; PANDOLFO, C. Zoneamento agrícola e época de semeadura para trigo no Brasil. Revista Brasileira de Agrometeorologia, v. 9, n. 3, p. 400-414, 2001.
CUNHA, G. R.; PIRES, J. L. F.; PASINATO, A.; DALMAGO, G. A. Variabilidade temporal e espacial do quociente fototermal no Rio Grande do Sul e suas implicações para a expressão do potencial de rendimento de grãos de trigo. Revista Brasileira de Agrometeorologia, v. 13, n. 1, p. 91-101, 2005.
Acta Scientiarum. Agronomy Maringá, v. 36, n. 1, p. 99-110, Jan.-Mar., 2014 GRODZKI, L.; CARAMORI, P. H.; BOOTSMA, A.
Riscos de ocorrência de geada no Estado do Paraná, Brazil. Revista Brasileira de Agrometeorologia, v. 4, n. 1, p. 93-99, 1996.
IAPAR-Instituto Agronômico do Paraná. Available from: <http://www.iapar.br/modules/conteudo/conteudo.php? conteudo=1088>. Access on: Aug. 15, 2010.
KOVÁCS, Z.; SIMON-SARKADI, L.; SOVÁNY, C.; KIRSCH, K.; GALIBA, G.; KOCSY, G. Differential effects of cold acclimation and abscisic acid on free amino acid composition in wheat. Plant Science, v. 180, n. 1, p. 61-68, 2011.
LIVINGSTON, D. P.; TALLURY, S. P.; PREMKUMAR, R.; OWENS, A. S.; OLIEN, C. R. Changes in the histology of cold-hardened oat crowns during recovery from freezing. Crop Science, v. 45, n. 4, p. 1545-1558, 2005.
LIZANA, X. C.; CALDERINI, D. F. Yield and grain quality of wheat in response to increased temperatures at key periods for grain number and grain weight determination: considerations for the climatic change scenarios of Chile. Journal of Agricultural Science, v. 151, n. 2, p. 209-221, 2012.
MAGRÍN, G. O.; HALL, A. J.; BALDY, C.; GRONDONA, M. O. Spatial and interannual variations in the photothermal quotient: implications for the potential kernel number of wheat crops in Argentina. Agricultural and Forest Meteorology, v. 67, n. 1, p. 29-41, 1993.
MENÉNDEZ; F. J.; SATORRE, E. H. Evaluating wheat yield potential determination in the Argentine Pampas. Agricultural Systems, v. 95, n. 1, p. 1-10, 2007.
MORAL, L. F. G.; RHARRABTI, Y.; VILLEGAS, D.; ROYO, C. Evaluation of grain yield and its components in durum wheat under Mediterranean conditions: an ontogenic approach. Agronomy Journal, v. 95, n. 2, p. 266-274, 2003.
NALLEY, L. L.; BARKLEY, A. P.; SAYRE, K. Photothermal quotient specifications to improve wheat cultivar yield componente models. Agronomy Journal, v. 101, n. 3, p. 556-563, 2009.
ORTIZ-MONASTERIO, R. J. I.; DHILLON, S. S.; FISCHER, R. A. Date of sowing effect on kernel yield and yield components of irrigated spring wheat genotypes and relationships with radiation and temperature in Ludhiana, India. Field Crops Research, v. 37, n. 3, p. 169-184, 1994. R DEVELOPMENT CORE TEAM. R: a language and environment for statistical computing. Vienna: R Foundation for Statistical Computing, 2010.
RIBEIRO JR., P. J.; DIGGLE, P. J. GeoR: a package for geostatistical analysis. R-News, v. 95, n. 1-2, p. 15-18, 2001.
RODRIGUES, O.; LHAMBY, J. C. B.; DIDONET, A. D.; MARCHESE, J. A. Fifty years of wheat breeding in Southern Brazil: yield improvement and associated changes. Pesquisa Agropecuária Brasileira, v. 42, n. 6, p. 817-825, 2007.
ROSA, H. T.; WALTER, L. D.; STRECK, N. A.; ALBERTO, C. M. Métodos de soma térmica e datas de semeadura na determinação de filocrono de cultivares de trigo. Pesquisa Agropecuária Brasileira, v. 44, n. 11, p.1374-1382, 2009.
SCHEEREN, P. L.; CAIERÃO, E.; SILVA, M. S.; DEL LUCA, L. J. A.; NASCIMENTO JR., A.; LINHARES, A.; EICHEBERGER, L. BRS Guamirim: cultivar de trigo da classe pão, precoce e de baixa estatura. Pesquisa Agropecuária Brasileira, v. 42, n. 2, p. 293-296, 2007. SHARMA, D. L.; D’ANTUONO, M. F. D.; ANDERSON, W. K.; SHACKLEY, B. J.; ZAICOU-KUNESCH, C. M.; AMJAD, M. Variability of optimum sowing time for wheat yield in Western Australia. Australian Journal of Agricultural Research, v. 59, n. 10, p. 958-970, 2008.
SILVA, E. P.; CUNHA, G. R.; PIRES, J. L. F.; DALMAGO, F. A.; PASINATO, A. Fatores abióticos envolvidos na tolerância de trigo à geada. Pesquisa Agropecuária Brasileira, v. 43, n. 10, p. 1257-1265, 2008.
SUBEDI, K. D.; MA, B. L.; XUE, A. G. Planting date and nitrogen effects on grain yield and protein content of spring wheat. Crop Science, v. 47, n. 1, p. 36-47, 2007. WHALEY, J. M.; KIRBY, E. J. M.; SPINK, J. H.; FOULKES, M. J.; SPARKES, D. L. Frost damage to winter wheat in the UK: the effect of plant population density. European Journal of Agronomy, v. 21, n. 1, p. 105-115, 2004.
WREGE, M. S.; CARAMORI, P. H.; GONÇALVES, A. C. A.; BERTONHA, A.; FERREIRA, R. C.; CAVIGLIONE, J. H.; FARIA, R. T.; FREITAS, P. S. L.; GONÇALVES, S. L. Regiões potenciais para cultivo da cana de açúcar no Paraná, como base na análise do risco de geadas. Revista Brasileira de Agrometeorologia, v. 13, n. 1, p. 113-122, 2005.
Received on September 26, 2011. Accepted on December 13, 2011.