Pedro Miguel Vilaça dos Santos
Licenciado em Ciências de
Engenharia Electrotécnica e de Computadores
Methodology for WSN communication
technologies automated field tests
Dissertação para obtenção do Grau de
Mestre em Engenharia Electrotécnica e de Computadores
Orientador:
Doutor Pedro Miguel Negrão Maló, Prof. Auxiliar,
Universidade Nova de Lisboa
Co-orientador:
Mestre Bruno Miguel Pereira de Almeida, CEO,
Unparallel Innovation
Júri:
Presidente: Doutor Luís Filipe dos Santos Gomes
Methodology for WSN communication technologies automated field tests
Copyright cPedro Miguel Vilaça dos Santos, Faculdade de Ciências e Tecnologia,
Uni-versidade Nova de Lisboa
“The only source of knowledge is experience.”
A
CKNOWLEDGEMENTS
Quero começar por agradecer ao meu orientador, o Professor Pedro Maló, dedicação, disponibilidade e paciência demonstrada durante todos os momentos desta dissertação. Agradeço tambem ao meu coorientador Bruno Almeida, pela disponibilidade prestada e pelo rigor requerido, contribuindo para uma melhoria da qualidade do trabalho.
À empresa Unparallel Innovation um muito obrigado pelo equipamento disponibilizado, sem ele esta dissertação não seria possível.
Aos meus companheiros de tese, Fernando Rosado e Miguel Costa, pelo companheirismo e pelas sugestões que contribuiram para o desenvolvimento desta dissertação.
A todos os colegas que fizeram parte do meu percurso universitário, nomeadamente, Bruno Nascimento, Emanuel Sequeira, Filipe Viegas, Joana Martelo, João Filipe, João Silva, Nuno Vasconcelos, Pedro Almeida, Ricardo Lampreia, Sergio Silva, levo a vossa amizade por muitos e bons anos.
Quero agradecer também aos meus amigos fora do curso, Bruno Cristino, Fernando Bastos, Hugo Borges, Pedro Monteiro, Sónia Moura e Vanessa Marques pelo constante apoio e momentos de lazer proporcionados.
Um agradecimento muito especial a toda a minha família, e em especial aos meus pais e irmã pela compreensão, carinho e muita paciência durante todo o percurso universitário, bem como pela força e motivação que me foram dados. Deixo também uma palavra de agradecimento à Aida, por toda a amizade, amor, dedicação, compreenção e por ter estado sempre presente nos momentos mais difíceis.
A
BSTRACT
Wireless Sensor Networks(WSN) are networks of devices used to sense and act that applies wireless radios to communicate. To achieve a successful implementation of a wireless device it is necessary to take in consideration the existence of a wide variety of radios available, a large number of communication parameters (payload, duty cycle, etc.) and environmental conditions that may affect the device’s behaviour. However, to evaluate a specific radio towards a unique application it might be necessary to conduct trial experiments, with such a vast amount of devices, communication parameters and environmental conditions to take into consideration the number of trial cases generated can be surprisingly high. Thus, making trial experiments to achieve manual validation of wireless communication technologies becomes unsuitable due to the existence of a high number of trial cases on the field. To overcome this technological issue an automated test methodology was introduced, presenting the possibility to acquire data regarding the device’s behaviour when testing several technologies and parameters that care for a specific analysis. Therefore, this method advances the validation and analysis process of the wireless radios and allows the validation to be done without the need of specific and in depth knowledge about wireless devices.
R
ESUMO
As Wireless Sensor Networks (WSN) são redes de dispositivos usadas para sentir e atuar que usam rádios sem fios para comunicar. Para alcançar uma implementação bem-sucedida de um dispositivo wireless é necessário ter em consideração a existência de uma ampla variedade de rádios disponíveis, um grande numero de parâmetros de co-municação (payload, duty cycle, etc) e de condições ambientais que podem ter efeito no comportamento do dispositivo. Contudo, para avaliar um rádio específico para uma apli-cação singular, pode ser necessário realizar experiências de teste, uma vez que com uma vasta quantidade de dispositivos, parâmetros de comunicação e condições ambientais a ter em consideração o número de experiências de teste pode ser surpreendentemente grande. Assim, fazer experiências de teste para alcançar uma validação manual das tecnologias de comunicação wireless torna-se improprio devido ao elevado número de casos experimen-tais no terreno. Para ultrapassar esta questão tecnológica uma metodologia automática de teste foi apresentada, apresentando a possibilidade de adquirir dados relativamente ao comportamento do dispositivo ao testar diversas tecnologias e parâmetros que carecem de uma analise especifica. Por conseguinte, este método introduz avanços no processo de validação e analise de rádios sem fios e permite que a validação seja feita sem existir a necessidade de possuir conhecimentos específicos e aprofundados sobre dispositivos wireless.
C
ONTENTS
Contents xiii
List of Figures xv
List of Tables xvii
Listings xix
1 Introduction 1
1.1 Motivation Scenario: Smart Campus . . . 1
1.1.1 FCT- UNL Case Scenario . . . 3
1.2 Generic Application: Low Power WSN . . . 9
1.3 Research Question . . . 10
1.4 Work Methodology . . . 10
1.5 Dissertation Outline . . . 12
2 Literature Review 15 2.1 Individual Review . . . 16
2.1.1 Choosing a Wireless Implementation Strategy and Applications . . 16
2.1.2 The Fundamentals of ShortRange Wireless Technology . . . 18
2.1.3 Using Wireless Technologies for Healthcare Monitoring at Home: a Survey . . . 20
2.1.4 Wireless connectivity for the Internet of Things . . . 22
2.2 Synthesis . . . 24
2.3 Advancement . . . 25
3 Methodology for WSN communication technologies automated field tests 27 3.1 Problem . . . 27
3.2 Concept . . . 29
3.2.1 Architecture . . . 30
3.3 Activity Interaction . . . 31
3.3.1 Transmitter Diagram . . . 31
3.3.2 Request-Reply Diagrams . . . 32
3.4 Configuration Messages Definition . . . 34
3.5 Behaviour Diagram . . . 35
3.5.1 Auxiliary Device . . . 36
3.5.2 Coordinator Device . . . 37
3.5.3 End Device . . . 39
4 Testing and Validation 41 4.1 Testing Methodology . . . 41
4.2 Proof of Concept Implementation . . . 43
4.3 Test Definition and Execution . . . 45
4.3.1 Test Definition . . . 45
4.3.2 Test Execution . . . 45
4.4 Verdict . . . 51
5 Conclusions and Future Work 53 5.1 Future Work . . . 55
Bibliography 57
A Coordinator Device Code 59
B End Device Code 69
C Auxiliary Device Code - Arduino 77
L
IST OF
F
IGURES
1.1 IoT network diversity; . . . 2
1.2 Nodes distribution through the campus . . . 4
1.3 North Sector of the Campus . . . 5
1.4 North division of the Campus . . . 5
1.5 North division of the Campus . . . 6
1.6 Central division of the Campus . . . 6
1.7 Central division of the Campus . . . 7
1.8 Central division of the Campus . . . 7
1.9 South division of the Campus . . . 8
1.10 South division of the Campus . . . 8
1.11 Network Topology . . . 9
1.12 Work methodology used in this thesis . . . 11
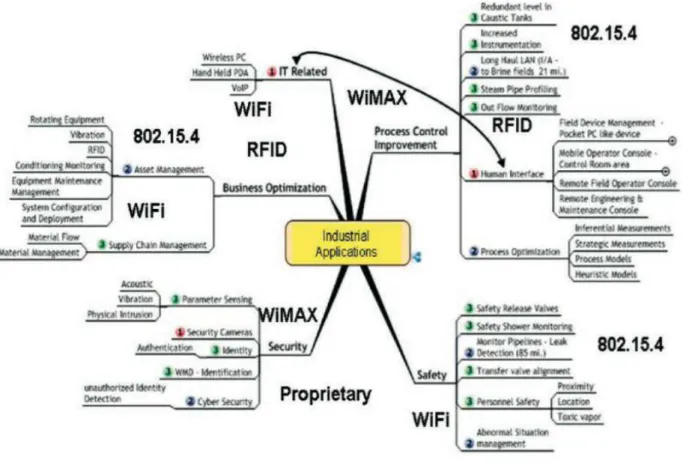
2.1 Unified Wireless Comunications, Gupta 2007 . . . 16
2.2 Popular Short-Range Wireless Technologies, Frenzel 2012 . . . 19
2.3 Comparison Sheet of Wireless Technologies, Zatout 2012 . . . 21
2.4 Summary of wireless technology parameters Reiter 2014 . . . 22
3.1 Concept of Automation Approach . . . 29
3.2 Achitecture Diagram . . . 30
3.3 Transmitting sequence diagram . . . 31
3.4 Request-Reply sequence diagram . . . 32
3.5 Receiving sequence diagram . . . 33
3.6 Configuration Message Assemble . . . 34
3.7 Configuration Message Template . . . 34
3.8 Auxiliar Device state machine . . . 36
3.9 Coordinator Device state machine . . . 37
3.10 End Device state machine . . . 39
4.1 Conformance Testing Process, based on (Tretmans, J. 2001) . . . 41
4.2 Example of configuration message . . . 43
4.3 Proof of concept Coordinator GUI . . . 44
4.5 Duty cycle analysis test . . . 49
L
IST OF
T
ABLES
2.1 Literature Review synthesis table . . . 25
3.1 Summary of Parameters . . . 27
3.2 Summary of Testing Characteristics . . . 28
4.1 Example of a TTCN based test table . . . 42
4.2 Test Case Example . . . 43
4.3 Wireless Radio Test Definition . . . 45
4.4 Payload Test Execution . . . 46
4.5 Duty cycle Test Execution . . . 48
L
ISTINGS
Created_Code/Form1.cs . . . 59
Created_Code/Secondary.ino . . . 69
Created_Code/Ina219_processing.ino . . . 77
G
LOSSARY
BLE Bluetooth Low Energy.
FCT Faculdade de Ciências e Tecnologia.
GUI Graphical User Interface.
I/O Input/Output.
IC Integrated Circuit.
IEEE Institute of Electrical and Electronics Engineers.
IETF Internet Engineering Task Force.
IoT Internet of Things.
ISM Industrial,Scientific and Medical.
LoS Line of Sight.
NLoS Non Line of Sight.
QoS Quality of Service.
RF Radio Frequency.
SoC System-on-Chip.
TTCN-2 Tree and Tabular Combined Notation - Version 2.
UNL Universidade Nova de Lisboa.
WLAN Wireless Local Area Network.
C
H
A
P
T
E
R
1
I
NTRODUCTION
1.1
Motivation Scenario: Smart Campus
The broad idea behind the Internet of Things (IoT) is that the whole constellation of objects "things" can be connected and interconnected thus allowing them to be monitored, controlled and connected to the Internet. This interconnection of objects can be obtained through Wireless Sensors Networks (WSN), Wireless Local Area Network (WLAN), or other means of connection, and it can lead to advanced awareness and control in some environments through detailed sensing and actuating.
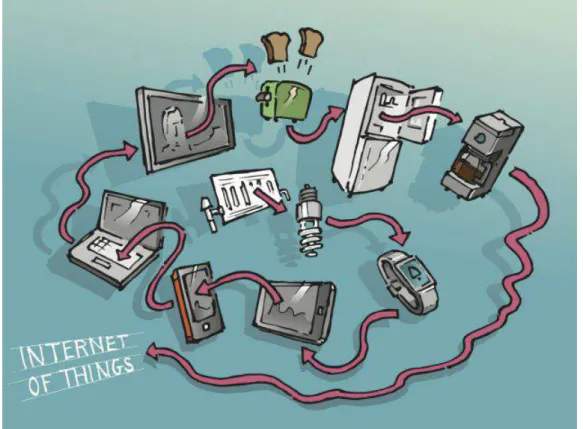
The objects connected to the IoT can be our everyday objects or others that aren’t currently connected to the information grid. These objects can be electrical/electronic devices or not devices at all, just common objects such as house equipment, food, clothes, parking lots, city landmarks, etc, like represented in the figure 1.1.
Since the main objective of IoT is the communication, the devices can have wireless communication modules, modules that are usually based on standard communication pro-tocols, such as 802.11, 802.15.1, 802.15.4, etc. This independence of the physical networks can lead us to place IoT devices almost everywhere and a wide deployment of WSN can raise various concerns, concerns like:
Accessibility: A WSN node can be deployed in places with bad access like ceilings,
rooftops, the woods, etc.
Power Consumption: Wireless communication modules can be very power hungry
Power Supply: When deploying a WSN node in an inaccessible location it can be difficult to provide a steady and constant power supply requiring, for example, the use of a power-bank instead. This deployment could be compromised if the device drains too much energy.
Figure 1.1: IoT network diversity;
For instance, lets consider the outdoors an university campus as our main scenario, the Faculdade de Ciências e Tecnologia (FCT) - Universidade Nova de Lisboa (UNL) campus. The deployment of the IoT on the campus outdoors could be achieved through a WSN and it could have an impact in the institution way of life by improving maintenance operations, gaining energy efficiency, reducing water wastes and increase students and employers satisfaction, by providing at least three major benefits that could include:
Cost Savings: A constant monitoring of luminosity, temperature and humidity of several
campus areas could lead to a system with intelligence awareness that could activate and regulate the street illumination instead of the traditional timer clock, and the activation and duration of the gardens sprinklers systems instead of the traditional timer clock or manual activation. This particular situations could lead to a reduce of the electricity and water consumption therefore a cost saving;
Control: A student/employer could know in real time which parking lots were available
1.1. MOTIVATION SCENARIO: SMART CAMPUS
Communication: The use of a WSN attached to the power grid could warn the
mainte-nance services of faulty equipments such as photovoltaic panels, street lamps, and other; and in the water grid troubles like plumbing leaks or malfunctions in the gardens sprinklers systems;
1.1.1 FCT- UNL Case Scenario
To achieve a successful deployment of any wireless network it’s necessary to choose the technology and know their capacities and limitations, but knowing their properties it is not enough, it is necessary to take into account the properties of the radio signal and the deployment environment. Failing to take under advisement this concerns can lead to a wireless network with bad coverage areas and the existence of dead-zones(zones without radio signal). To minimize those planning faults a planed was designed following the following specifications:
Signal Range: The existing technological solutions have a variety of signal ranges, to this
particular project it was decided to use a technology that can provide 100 m of signal range. For projection security purposes the range of the technology was reduced from 100 meters to 75 meters, with this limitation its introduced a safety margin of 25 meters. With this safety margin it is possible to counter the effects from mobile objects that can temporarily jam the signal affecting the range(i.e. vehicles).
Environmental Effect: One of the factors that affects the signals propagation in urban
environments is the buildings construction itself. In the FCT campus has a well know example, the Electrical Engineering building (Ed.10). This building isolates a variety of radio signals from and to the building and this is due to the building construction materials and its construction process. Taking this effect into account it’s difficult to know with precision if the signal from one node could reach another node when having this building as an obstacle, even if its under the signal range. The plan for the deployment of the nodes through out the campus will take under consideration the previous scenario and the nodes signal range will not be defined by the maximum range but by the node field of view.
Summarizing the previous plan, the signal range of a WSN base station will be 75 meters limited to the node field of view. With these parameters the nodes will be projected to be deployed in the buildings exterior walls and only one node per wall. To achieve maximum coverage of the campus base stations can be deployed in security booths or in the illumination street lamps of the campus, in this case the base stations will have a field of view of 360 degrees instead of the 180 degrees when deployed in walls.
case the deployment locations were randomly selected by the author to accomplish the re-quired specifications. In a real deployment scenario mathematical models and simulations should be run to achieve maximum performance and deployment optimization.
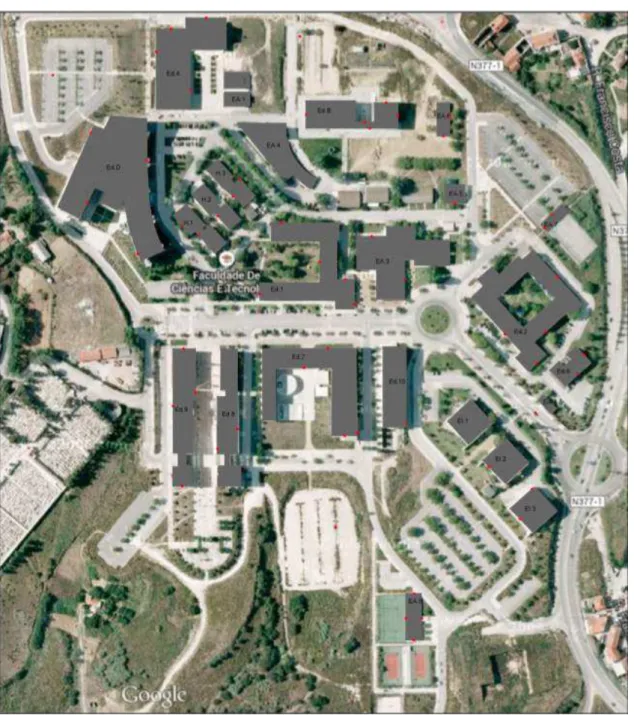
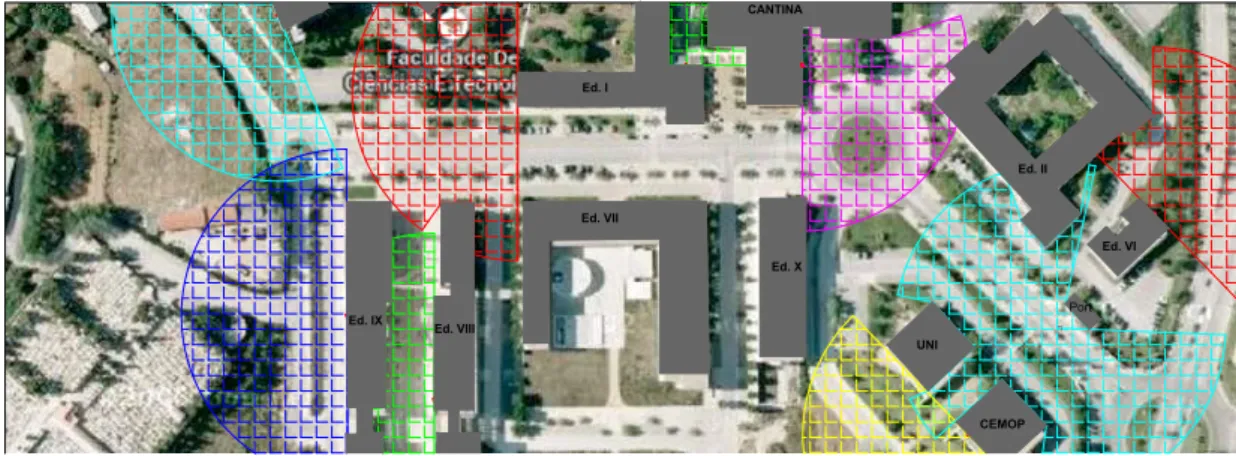
Figure 1.2: Nodes distribution through the campus
For a better visualization and comprehension, the campus map was divided in three horizontal sections. In each section is shown the signal coverage of each one of the base stations deployed through the campus.
1.1. MOTIVATION SCENARIO: SMART CAMPUS
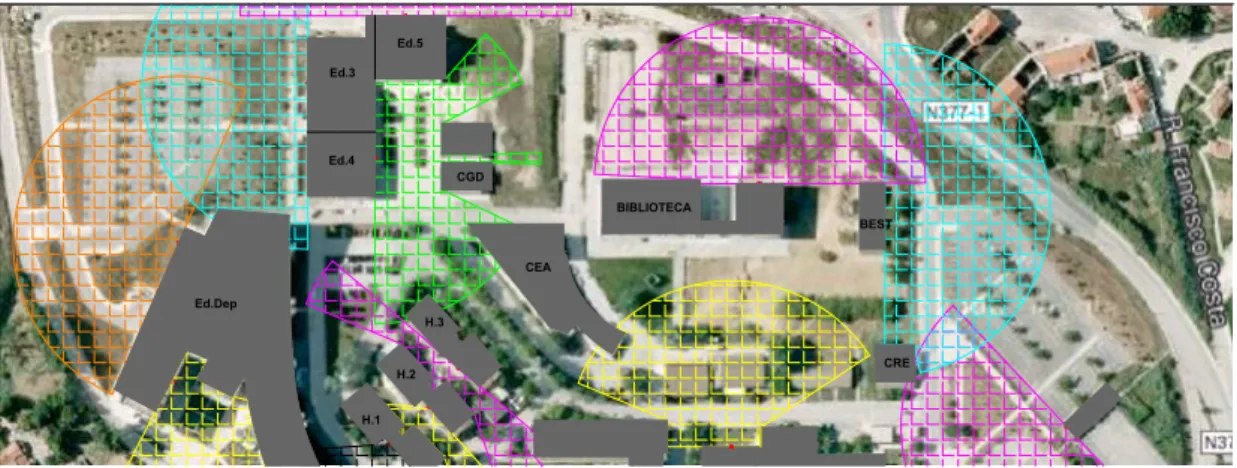
Figure 1.3: North Sector of the Campus
the WSN, this storage could be a simple text file, a database or a cloud.
Figures 1.3 to 1.5 show the signal range of the base stations deployed in the north division of the campus, this is the division with the highest number of base stations. This happens only because the of the irregular design of the building on this division, like the small alleys in the Building H.1 to H.3 and like the curved walls of the Ed.Dep and CEA. Yet in this division is possible to see the use of independent base stations in the Figure 1.4 used in a security booth (red circle) and in a street lamp (dark blue circle).
Figure 1.4: North division of the Campus
One of the applications of the WSN in the campus could be monitor the parking lots occupation. The campus has 6 external parking lots and some the parking lots inside the campus, and the information provided from nodes deployed in these it could possible to prevent overcrowded parking lots and illegal parking aside from the possibility to provide in real time information regarding vacant slots in each parking lot.
Figure 1.5: North division of the Campus
full, the driver makes a unnecessary drive and wastes time looking for a slot that doesn’t exist. This was an easily preventable situation if the information off the parking lot was available for consultation.
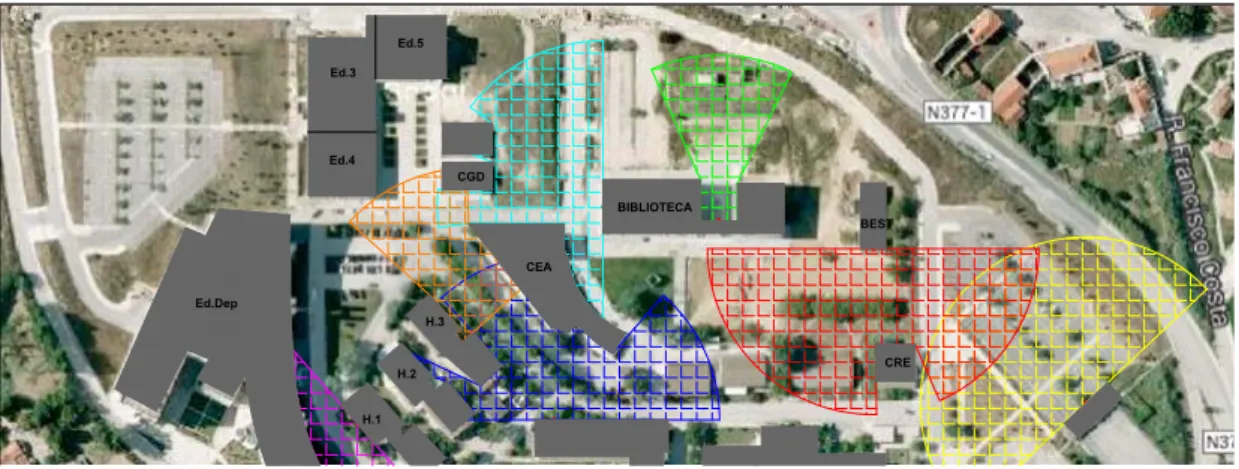
In the Figures 1.6 to 1.8 is possible to see the central division of the campus and see that it holds some parking lots but its possible to see that it holds a higher number of gardens. In almost every garden it’s possible to see the sprinkler system working in rainy days and this happens because some of this systems are operated by a timer clock and others are operated manually. This represents a waste of water and therefore a waste of money, and a WSN could help prevent this situation.
Figure 1.6: Central division of the Campus
1.1. MOTIVATION SCENARIO: SMART CAMPUS
Figure 1.7: Central division of the Campus
In the Figure 1.7 its possible to see another independent base station (light blue circle) deployed in a security booth allowing the deployment of nodes through the surrounding gardens. But gardens aren’t the only situation that could benefit from a WSN, a little bit of imagination and a lot of situations could emerge.
Every morning it’s possible to see university employers waiting inline inside their cars to get inside the campus all because the people in the car in front of them don’t know where they have their NFC card. Replacing a NFC card to a RFID chip could reduce this waiting time significantly, since the RFID is in the car and don’t need contact to authenticate the employer.
Figure 1.8: Central division of the Campus
electricity consumption. Similar to the gardens waste of water there’s waste of energy in the street lamps, because the Street illumination is timer activated, having nodes deployed through the campus to acquire information relative to the luminosity could bring some improvement to the street illumination system.
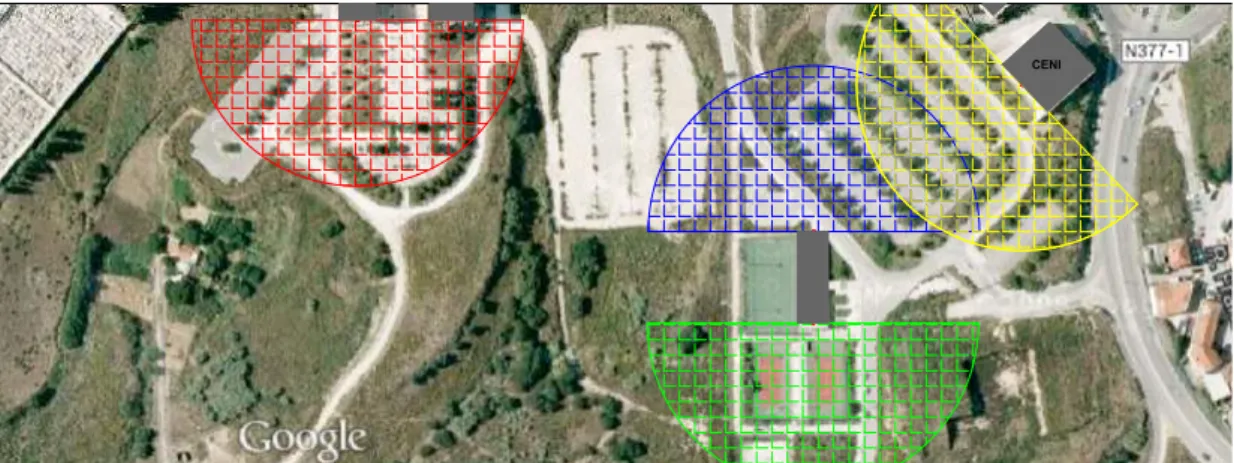
Figure 1.9: South division of the Campus
Some of the base stations deployed in this division could be used to monitor sportsman’s health like the dark blue circle in the Figure 1.9 and the green circle in the Figure 1.10. If sportsman’s use wearable technology like Blood Pressure Monitors the information acquired by this devices could be a great step to prevent and allow a quick intervention in potential risk situations to the sportsman.
1.2. GENERIC APPLICATION: LOW POWER WSN
1.2
Generic Application: Low Power WSN
In the previous points some of the WSN applications were described, applications like sportsman care, parking occupation, gardens irrigation and street lighting but these aren’t the only applications of the WSN. The number of applications is huge and it can vary from Traffic Congestion, Waste Management, Structural Health, Forest Fire Detection, Fleet Tracking, Environmental Parameters (urban noise, electromagnetic field, radiation, air pollution, ultraviolet radiation,...).
Taking the previous University Campus as a model, it’s possible to generalize the WSN deployments. The WSN can be deployed virtually almost everywhere, whether it’s an urban or rural environment.
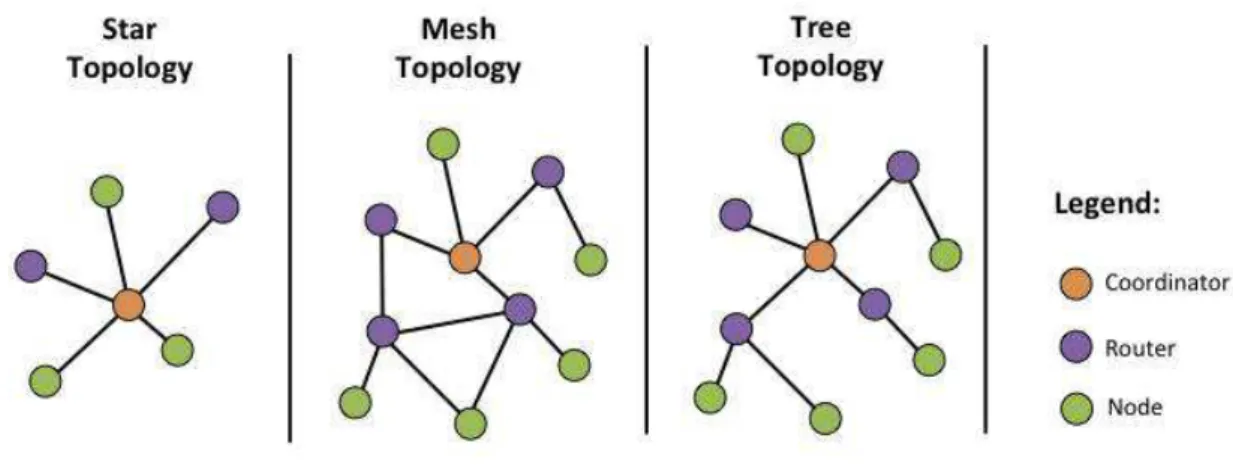
In an WSN environment there are some network topologies that can be applied, the most common topologies are Star, Tree, Mesh as shown in Figure 1.11.
Figure 1.11: Network Topology
The Tree and Mesh topology rely on multi-op transmission, this means that one device transmits a packet to another device and the device is responsible to transmits the packet to another device or to the gateway device. This scenario can increase the network de-ployment range and reliability. In the other hand this could mean an overall increase of network power consumption, since one device could be responsible for the transmission of its own packets and other devices packets.
1.3
Research Question
It is possible to relate all the previous issues just by adding a little extrapolation, a device with an higher signal range can have a higher power consumption. In the same line of thinking if the device have a higher signal range this signal could be more susceptible to signal interference and therefore it’s more likely to have a higher power consumption. With a high power consumption it could be expect a lower battery duration and this could be ineffective if a device it’s deployed in a low accessibility area. Having this much issues to start a WSN this can lead to a research question, witch supports this master thesis work:
How to choose the appropriate Wireless Technology for a WSN application?
1.4
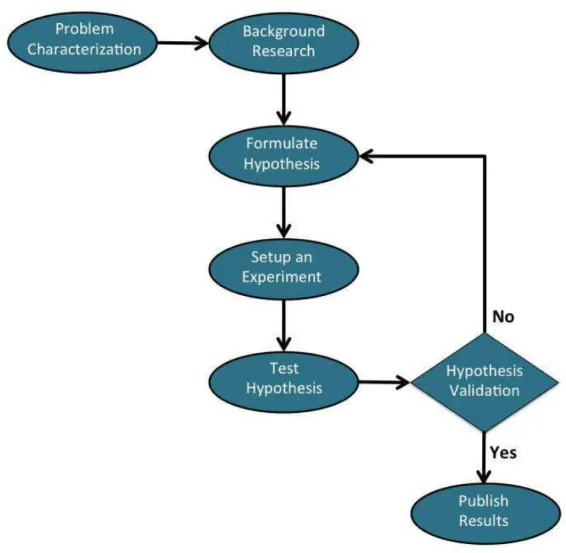
Work Methodology
The work methodology used in this thesis is based on the principles of Scientific Method (Carey 2011) and (Schafersman 1997). This methodology approach is illustrated in the figure 1.12 is composed by the following steps:
1. Problem Characterization;
2. Background Research;
3. Formulate Hypothesis;
4. Setup an Experiment;
5. Test Hypothesis;
6. Hypothesis Validation;
7. Publish Results.
1. Problem Characterization: The main objective in this step is the identification and
characterization of a significant problems. This study towards the problem can lead to a formulation of a research question that will be the basis of this research work. The problem identified in this thesis is how to choose the appropriate Wireless Technology for a WSN application.
2. Background Research: This step demonstrates the study of similar work on the subject
1.4. WORK METHODOLOGY
Figure 1.12: Work methodology used in this thesis
3. Formulate Hypothesis: Based on the background research it’s possible to establish
conceptual achievement, the hypothesis, in order to allow the elaboration of an experiment. It is required that the hypothesis clarify, explain and specify a solution that answers the problem characteristics. In this work the hypothesis consists....
4. Setup an Experiment: Since the previous hypothesis needs to be validated this step
consists in the technological realisation of it through the definition of the experiment specifications. This experiment is a proof of concept and its meant to be replicated by others in a feasible way.
5. Test Hypothesis: The tests which the implementation of the hypothesis will be
6. Hypothesis Validation: With this step is possible to observe the results of the testing hypothesis and assess the quality of the proposed solution. In some cases the hy-pothesis results can lead to a weakening of the hyhy-pothesis strength, or even put in jeopardy all of the assumptions made in the very beginning of the research. This should not be interpreted as a failure, but as a way to improve the original approach and try another one with new expertise of the subject. If the hypothesis didn’t pass in the hypothesis validation the researcher should retake the third step leading to a new iteration of the scientific method.
7. Publish Results: After the positive results, is possible to consider the future and define
the recommendations for further research. Discussion regarding literature, research objectives and questions should be taken into account, and draw conclusions out of it. The outcome of the research should result in a contribution to the scientific community assuming the form of a final report and/or scientific papers. In this particular case the the work will be published as a final report, this particular document.
1.5
Dissertation Outline
This dissertation is composed by five, being the first chapter the present one. In this chapter was presented the motivation scenario,followed by the problem presentation and characterization witch lead to the research question "How to choose the appropriate Wireless Technology to a WSN". Afterwards, its presented the approach used to do this work, which was based on the scientific method. It is the author intention to produce all the chapters in a stand-alone mode to expedite this thesis analysis. The following chapters will be:
State-of-the-Art: This chapter presents a background research related to the studied work
elements. This research focuses in the identification of important key-point that could provide useful information regarding the WSN deployment and informations about parameters that could influence the behaviour of wireless technologies. At the end of the chapter in the advancement section is presented a brief explanation of the exploited characteristics.
Methodology for wireless technologies automated tests: This third chapter proposes a
methodology to test wireless technologies in a automated way. At first, it is presented the concept behind the proposed methodology, followed by the presentation and definition of the used interaction diagrams, behavioural diagrams and a detailed architecture of the proposed methodology.
Testing and Validation: The fourth chapter presents the tests used to validate the
1.5. DISSERTATION OUTLINE
of concept and the tests definition and execution is made. The results of the tests are then presented and through its analysis is verified if the initial objectives were achieved.
Conclusions and Future Work: The fifth and final chapter presents a summary of this
C
H
A
P
T
E
R
2
L
ITERATURE
R
EVIEW
In the previous chapter the motivation scenario was presented, the deployment of a wsn in the FCT-UNL campus. In the planning stage of the WSN a problem was unveiled and this problem lead to a research question "How to choose the appropriate Wireless Technology for a WSN application?". The previous chapter also explain the scientific method used and the composition of this thesis one way to help us solve our problems is through observation, in this particular case to see how others solved problems related with ours, being this the main objective of this chapter. This research was done in order to help the development of this thesis by discovering similar systems, technologies and approaches that can handle the problem of the appropriate wireless technology for each scenario. The articles chosen articles handle topics about deployment strategies, applications, wireless technologies and are presented now in alphabetic order:
• "Choosing a Wireless Implementation Strategy and Applications (Gupta 2007)":
This white paper addresses the deployment of wireless solutions in an industrial environment and the key aspects that need to be taking in consideration when planning and deploying a wireless strategies.
• "The Fundamentals of ShortRange Wireless Technology (Frenzel 2012)":Although
it is a web-page it is a quite extensive and comprehensive one. It contains informa-tion related to the major wireless technologies and explain in detail some of the critical factors that can have impact in the design phase. This document also contains a detailed check-list of aspects that need to be addressed when selecting a wireless solution.
• "Using Wireless Technologies for Healthcare Monitoring at Home: a Survey (Zatout
2012)":The main subject addressed in this paper is the application of Wireless
wide range of wireless technologies that can be chosen from.
• "Wireless connectivity for the Internet of Things (Reiter 2014)":This white-paper
covers some of the main characteristics of the wireless technologies mainly when applied to the IoT, such as frequencies used and their regulations, the commu-nications protocols, the network range, the network topology and size and the standard/proprietary protocols used.
2.1
Individual Review
2.1.1 Choosing a Wireless Implementation Strategy and Applications
This white paper written by Gupta 2007 describes a strategy to deploy wireless solutions in an industrial environment and some key considerations when doing so. An wide industrial wireless deployment can be somewhat expensive, with so, it is important to avoid money waste. To comply with that it is important to analyse business needs and applications such as required data throughput, range, QoS, etc.
2.1. INDIVIDUAL REVIEW
It is also necessary to plan future needs of the wireless solutions so the wireless infras-tructure does not become obsolete if more devices need to be added or if higher data throughputs are required. In an industrial environment it is possible to encounter multi-ple sources information that can/will be transmitted over wireless networks. Different sources have different need and characteristics, with this diversity of requirements multi-ple communication protocols must be used since the current radio’s can not meet all the requirements. Having multiple standards operating in the same environment creates a large ecosystem and it is important that all wireless communications become centralized and then distribute the acquired data to the appropriated persons/departments as de-scribed in the figure 2.1. Industrial environments can be more likely to have more security needs, and wireless networks need to be enforced as well.
Key-Points
The approach taken in this article provided strong foundations to apply in the planning stage of a wide wireless deployment, these foundations were presented in the document as key-points being the following:
• "Identify user requirements";
• "Select and purchase hardware and software that is proven, scalable and capable of
understanding diverse protocols";
• "Plan in detail for network migration or expansion, since networks are now the
lifeline of the company";
• "Utilize the services of consultants so that you get quality advice from people who
have gone through this experience";
• "Conduct an RF site survey, prior to implementation, to identify wireless signal
paths and sources of potential interference";
• "Build ongoing maintenance, support and optimization services into the plan";
• "Strive to integrate wireless security and mobility products with existing enterprise
identity management solutions";
• "Determine which classes of devices are allowed to touch the network and the
policies that are involved";
• "Identify a wireless platform that can grow with changing networks and devices";
• "Storyboard the wireless application, verify user requirements and only then start
Analysis
This article can provide an overall insight over one approach to deploy a WSN. Despite the usefulness of some provided key-points they do not explicitly indicate the parameters that need to be addressed, requiring some text interpretation to identify them. There are also some key-points that only have purpose in a enterprise environment such as the use of consultants, the creation of maintenance and support services, the network migration and the identification of devices that are allowed to use the network.
Key-points such as the identification of user requirements and the selection of hardware and software can be two relevant points to the WSN deployment. Although this two key-points can provide a simple way to narrow the list of equipments that can be chosen to the network, this key-points cannot be used in this document because they cannot fit in any of the chosen parameters.
The RF site survey is the only key-point that can be somewhat linked to one of the existing parameters, the device environment. The existence of potential sources of interference can have different effects over the wireless technology itself.
2.1.2 The Fundamentals of ShortRange Wireless Technology
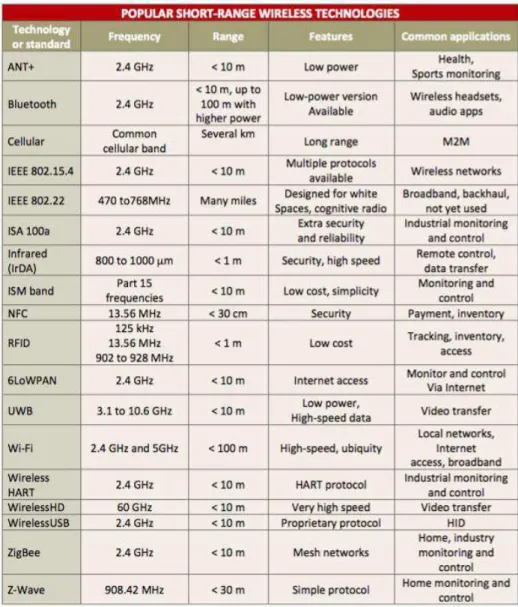
The approaches found in the article written by Frenzel 2012 explain some of the popular existing wireless technologies, their characteristics and some of their typical applications. It is also explained the factors that affect the performance of a wireless network, being these mainly physical factors as described in the figure 2.2. Those critical factors can be range, transmit power, antenna gains, frequency used, and receiver sensitivity.
When planning a wireless deployment its important to take under advisement that with the same conditions devices with lower frequencies will have an higher range that devices with higher frequencies. It is also important to choose the right type of antenna since there are some different kinds of antennas and they can influence the range and the trans-mission/reception power. As stated before data rates can influence the both range and reliability of the signal, this can be accomplished by using lower data rates.
2.1. INDIVIDUAL REVIEW
Figure 2.2: Popular Short-Range Wireless Technologies, Frenzel 2012
Key-Points
This article has the majority of the key-points explicitly identified, other than that some of the key-points presented in the article were not directly copied to this list because they lack in some specificity. The summarized key-points will be:
• "Range";
• "Simplex/Duplex";
• "Number of nodes";
• "Data rate";
• "Potential interference";
• "Power source";
• "Size and space";
• "Regulatory issues";
• "Licensing fees";
• "User type and experience";
• "Security";
Analysis
With the information existing in this article it is possible to extract some knowledge re-garding the wireless technologies, since the majority of the listed key-points represent important parameters to take in account in a WSN context. Despite of the usefulness of the listed key-points some of this will not be pursued, such as "Number of nodes", "Power source","Size and space","Regulatory issues","Licensing fees","User type and experience" and "Security" since they can not be related with this work.
The key-points "Potential interference", "Environment" and "Range" key-points can be bundled into one of the previously identified parameters. That parameter is the device environment since this parameter will be used to define all the conditions that can affect and be affected by environmental conditions. Other key-points can be related in parame-ters useful for this thesis, key-points such as the "Simplex/Duplex" and "data rate" can be respectively linked to the Communications Type parameter and to the Payload parameter.
2.1.3 Using Wireless Technologies for Healthcare Monitoring at Home: a Survey
The article written by Zatout 2012 is mainly focused in the healthcare applications and their usual requirements. Although this study focuses an indoor environment such as home and/or healthcare facilities, it presents an analysis on the choosing method for the appropriate wireless technology for this particular application taking in advisement the presented requirements.
2.1. INDIVIDUAL REVIEW
Figure 2.3: Comparison Sheet of Wireless Technologies, Zatout 2012
planning stage of a WSN.
Key-Points
After a brief analysis of this article it was possible to identify some key-points that can be used in the planning phase of a WSN either it is an indoor or an outdoor environment. The key-points that can provide useful informations to this document are the following:
• "Quality of service";
• "Energy consumption";
• "Scalability";
• "Mobility";
• "Environment constraints";
• "Radio bandwidth";
• "Device power source";
• "Specific protocols";
Analysis
Resembling other article, in the listed key-points can be found useful informations that can support the deployment of wireless technologies. From the previously listed key-points the following will not be explored for obvious reasons, energy consumption", quality of service, scalability", mobility", radio bandwidth, device power source and Heterogeneity.
The remaining key-points environment constraints and specific protocols can be related to the previously defined parameters, parameters such as device environment and commu-nications protocol respectively.
Despite of the fact that the power level was not identified in the previous list of key-point, the author mentioned the power level during the explanation of a wireless protocol. With so, this will be the only reference of such parameter in the analysed article.
2.1.4 Wireless connectivity for the Internet of Things
This document written by Gil Reiter in Reiter 2014 focus in the a simple statement "One size does not fit all". With this statement the author explains that there are not wireless technologies that can incorporate the great majority of properties. Some of the most pre-vailing wireless technologies are based on interoperability and on international standards, those technologies will have their characteristics and foundations explained in the article.
Figure 2.4: Summary of wireless technology parameters Reiter 2014
2.1. INDIVIDUAL REVIEW
and depending on the frequency used can be licensing cost associated. Different frequen-cies also have different properties and generally they represent a trade-off between range and data throughput.
The document also makes a brief introduction to communication protocols and the ad-vantages of their use. One of those adad-vantages is the usage of the IP stack and therefore the usage of IP addresses that allows devices to directly communicate with the internet instead of the non IP devices that only can achieve the internet using a internet gateway. These communication networks can use a variety of network topologies all of them with different characteristics being explained two of these topologies. A summary overview of wireless technologies parameters is also provided in this document in a figure form, figure 2.4, and can provide a helpful insight over the specifications of some technology standards, such as range, data throughput, typical power source, typical topology.
Key-Points
This article can provide useful information regarding the topics that need to be addressed when planning a wireless deployment and valuable insight over some of the most prevail-ing existprevail-ing wireless standards and their characteristics. In order to acquire the essential parameters from this key-points it will be required some text interpretation. The key-points presented in the article are the following:
• "Frequency bands and worldwide regulations";
• "Communication protocols";
• "To IP or not to IP";
• "Network Range";
• "Network topology and size";
• "Standards and interoperability";
• "Radio transceivers and proprietary protocols";
• "Not only wireless";
• "Power source";
• "Data throughput";
Analysis
Power source.
With the remaining key-points is possible to establish a link between the "communication protocols", "to IP or not to IP", "standards and interoperability" and "radio transceivers and proprietary protocols" key-points to the pre-defined Communication Protocol parameter. In addition to this key-points it is also possible to establish a relation between the "data throughput" key-point and the Payload parameter
2.2
Synthesis
Having already presented and described each of the state-of-the-art element, it is now im-portant to summarize the knowledge from each document and relate it with the problem parameters presented before. The Table 2.1, presents the authors point of view in how each state-of-the-art element relates to the previously defined characteristics.
The Communication Protocol was referenced as an important key-point in almost every studied element, besides Gupta 2007. The existing information regarding communications protocols included the number of nodes allowed per protocol, the range between devices, important features, common applications.
The study element of Frenzel 2012 was the only study element that addressed the Commu-nication Type as an important key-point for a WSN deployment. The author considered this because he believes that applications such monitoring or remote control only need one-way communication, in different directions, and the same does not apply to an appli-cation that would require both monitoring and remote control, a two-way communiappli-cation.
One can notice that all of the studied elements have identified the Device Environment as one of the fundamental parameters to take into advisement in the planning stage of a wire-less network. The majority of the elements provided factors that can affect the behaviour of the wireless signal, factors such as tree walls, electrical circuits and communication lines can affect the performance of a wireless signal
In none of the studied elements was made any reference to the Payload parameter, despite of this fact several references were made to the data-throughput and to data-rate by the Frenzel 2012 and Reiter 2014.
2.3. ADVANCEMENT
power level in others wireless protocols.
Gupta, S. (2007)
Frenzel, L. (2012)
Zatout, Y. (2012)
Reiter, G. (2014)
Communication Protocol
-‐
Detailed information regarding some of the most
popular
Brief explanation about the parameter, with some explanation about the
importance of it
Brief explanation about the parameter, with some explanation about the
importance of it
Communication Type
-‐ Give an brief explanation
about it’s use and importance -‐ -‐
Device Environment
Suggests RF survey
Gives examples of interference sources and
suggestion to minimize interference
Explains the parameter and its importance.
Mentioned during Protocols exposure
Payload
-‐ Mention Data-‐Rate -‐ Mention Data-‐Throughput
Power Level
-‐ Mentioned during Protocols exposure
Mentioned during one Protocol exposure
Mentioned during Protocols exposure
Table 2.1: Literature Review synthesis table
2.3
Advancement
Taking the scientific method into account, is possible to understand that the creation of a solution for the research question should use the knowledge from past experiences and experiments as support (Schafersman, 1997). The usage of this approach allows a scientific and a technological evolution through the transmission of the previously acquired knowl-edge. Therefore, the used documents and their analysis can be used to bring some insight knowledge in the form of experiences and ideas that will be reflected in the proposed solution for this work.
In order to determine the documents contribution to the solution, the analysis of each document against the characteristics of the problem, summarised in Table 2.1, is taken into consideration resulting in the following conclusions.
After studying all State of the Art elements previously presented, it is possible to con-cluded that none of the presented elements can individually present a full methodology that could be followed when planning a wireless network deployment. Despite of that fact the sum of key-points presented in the state of the art elements provide a wider perspective of the task at hand.
source of information, with interesting technical data. The concept behind the Commu-nication Protocol, namely the relation between the commuCommu-nication protocol itself and its influence in the overall behaviour of the wireless radio. The associated hypothesis will focus in the measurements of the power consumption of various Communications Protocols.
In relation to the Communication Type parameter lack of support in the studied elements, the concept behind this parameter cares for an intensive analysis regarding his effects over the power consumption. Therefore in the hypothesis will be measured the radio’s power consumption in different communication situations without changing any other parameter.
Although the Device Environment parameter has some backing information in the studied elements, the existing practical information is still dim. Therefore the concept associated to this parameter lies in the analysis of the environment interference over the other existing parameters. To assess this parameter the hypothesis will focus the measurements of the radio power consumption in different environmental conditions and with different ranges between the radio devices.
The concept behind the Payload parameter consists in the analysis of the behaviour Re-garding the Payload parameter the hypothesis will measure the amount of data exchange between radios and the power consumption associated to the communication without looking the the maximum allowed payload per message. To achieve this objective, the hypothesis will consists in the analysis of the amount of transmitted data against the received data.
With respect to the radio Power Level parameter the information in the studied elements is almost non existent, nevertheless the study of this parameters seems to be relevant. The concept behind this parameter consists in the study of the trade-off between the Power level and the range between devices thereafter the effect over the power consumption.
C
H
A
P
T
E
R
3
M
ETHODOLOGY FOR
WSN
COMMUNICATION
TECHNOLOGIES AUTOMATED FIELD TESTS
3.1
Problem
To achieve an approach that could promote an optimization of low-power IoT devices it is necessary to analyse, test and observe the effects of some parameters. In the state of the art chapter, documents were studied and analysed in order to retrieve the important features to get a good WSN performance. The parameters obtained in the analysis were the communication protocol, the communication type mode, the duty cycle, the radio power level, message payload, and device location.
Parameters Explanation
Communication Protocol The choice of this parameter was due to the existence of a great number of wireless protocols and devices ;
Communication Type This parameter was included in order to analyse the impact of the type of communication in any other parameters;
Device Environment
Since the wireless signal can be degraded in a great number of ways it is important to analyse the impact of this parameter over the other important parameters, being also possible to analyse the device behaviour when testing it in different deployment environments;
Duty Cycle The analysis of the different duty cycle effects over other parameters can provide information regarding the wireless device behaviour;
Payload The existence of this parameter is due to the fact that an behaviour analysis of the wireless device can represent an asset when analysing the device performance when transmitting messages with a specific payload;
Power Level To achieve an optimal WSN deployment it can be necessary the analysis of this parameter against the power consumption and the signal range;
The necessity to analyse and test the parameters previously enumerated brought one con-cern about the test itself, the concon-cern about the difficulty to model some of the parameters. The device environment parameter is one of the parameters that makes very difficult to generate an accurate testing model. This happens because the WSN surrounding en-vironment can unintentionally introduce a wide variety of interferences to the system and therefore, this traduces an increase difficulty to generate an accurate simulation model.
In this particular case, the real-world tests can be more accurate than simulations because the generated results take into account all of those interferences, since this type of interfer-ences cannot be modelled and therefore reproduced in a simulation environment. Hence this fact in this thesis will be used in exclusive real-world tests to produce results and conclusions. In order to completely understand the influence of any parameter in the WSN overview it will require the variation of every parameter. This parameters variation can show the complexity involved in a real-world test, by showing the number of iterations required to test every scenario as it can be seen in the table 3.2.
Duty Cycle Payload Communication Type Power Level Device Environment
0 1 Tx-‐Rx P1 Indoor
100 10 Rx-‐Tx P2 Outdoor
1000 25 Request-‐Reply P3 LoS
10000 50 -‐ P4 NLoS
30000 100 -‐ P5 -‐
60000 -‐ -‐ -‐ -‐
Table 3.2: Summary of Testing Characteristics
To produce the previously showed test for a single radio module covering all the presented parameters with some degree of accuracy, each test iteration would have to transmit/re-ceive 10 messages. This would represent 450 iterations for a single location, making a total of 1800 iterations. It’s important to state that the Power Level items (P1,P2,...) are generic indicators of the power levels existing in the wireless devices.
3.2. CONCEPT
3.2
Concept
The employment of automation notions in real world tests can offer a faster and efficient way to test the predefined testing scenarios. Applying this notions to the WSN test envi-ronment can provide a substantial help to the user that want to perform such deployment, allowing the discover and analysis of one or more wireless technology towards a specific wireless scenario. An example of this type of scenario is depicted in the figure 3.1.
In this scenario the automated tests are used to analyse the parameters of wireless tech-nologies and its behaviours on the device overall power consumption.
Figure 3.1: Concept of Automation Approach
3.2.1 Architecture
The Automation Methodology proposed in this work is illustrated in Figure 3.2. In order to accomplish this automation methodology is required three devices, a Coordinator device, a End device, and an Auxiliary device. In the following paragraphs each one of intervening devices of this automation methodology will be explained, as well as the relevant characteristics.
Figure 3.2: Achitecture Diagram
Coordinator Device
In this automation model, this device is of a paramount importance since it is responsible for establishing and maintaining the synchronism between devices. This device is also responsible for generation of configuration messages the distribution of Configuration Messages to the End Device.
End Device
The End Device represents the most important unit of this automation methodology representing the device that will be tested and analysed. This device is responsible for the reception of configuration messages and following interpretation. The configuration message interpretation as well as the extraction of the embedded parameters inside the message, being this also responsible for the adoption of the extracted parameters and for carrying out the test in the conditions defined by the configuration message.
Auxiliary Device
3.3. ACTIVITY INTERACTION
3.3
Activity Interaction
This section will provide the specifications for the various types of communication that will occur between this automation methodology. As stated earlier in this document the existence three communication types appear from the necessity to analyse the power consumption of the wireless radio in each of this situations. In the following sections it is going to be presented the interaction diagrams for each one of the Communication Type. The presented sequence diagrams are defined according to the UML format Bell 2004, in which, each architecture intervener is represented by a lifeline block being the communi-cations between blocks represented by a closed end arrow.
3.3.1 Transmitter Diagram
Figure 3.3: Transmitting sequence diagram
Achieving this point, the devices will start the real test assuming the Coordinator device the Transmitter Role (Tx) and the End device the Receiver Role(Rx). This test execution implies the exchange of a pre-defined number of test messages, being this number defined in the received Configuration Message. With the end of the testing loop, the Coordinator will transmit to the End device an message indicating the End of Test, being the End device oblige to reply to the a message to the Coordinator device finishing the one test process.
3.3.2 Request-Reply Diagrams
In the following diagram, Figure 3.4, one can notice the resemblance from this diagram with the previous one. This interaction diagram quits the resemblance only in the testing loop, being both devices obliged to perform both roles, the Transmitter and Receiver role.
Figure 3.4: Request-Reply sequence diagram
To prevent the appearance of unwanted scenarios in this automation methodology such as synchronized transmission from both devices, the Coordinator device will begin the test transmissions and for the same reasons it will be also the Coordinator device the responsible for transmitting the End of Test message to the End device.
3.3. ACTIVITY INTERACTION
3.3.3 Receiving Diagrams
Figure 3.5: Receiving sequence diagram
In this last interaction diagram, Figure 3.5, it is presented the detailed information re-garding the communications and interactions between the devices. As it can be seen the initial communications between the devices remains the same, the configuration message transmission and the associated confirmation message.
During the test execution significant changes are presented such as the roles assumed by each device in the testing loop, the coordinator will assume the Receiver role (Rx) being the End device tasked with the Transmitter role(Tx).
3.4
Configuration Messages Definition
To implement this conceptual scenario in every test iteration will be transmitted a configu-ration message from the coordinator device to the end device. This transmission will be the first communication between the devices and will mark the begin of the iteration, making the end device aware of the testing parameters and condition to the actual iteration. In order to realize the automated test it is necessary to generate the configuration message by assembling together the necessary parameters in the configuration message template, as it can be seen in the figure 3.6.
Figure 3.6: Configuration Message Assemble
The Configuration Message template contain the 5 parameters that will define the test iteration. Parameters such as the Communication Type (CT), the transmission Duty Cycle (DC), the Quantity of messages (QT) that will be sent, the Payload (PA) of each message, and the radio Power Level (PL).
Figure 3.7: Configuration Message Template
Communication Type
3.5. BEHAVIOUR DIAGRAM
Duty Cycle
To implement the time between communications, exists the Duty Cycle message parameter. Although the duty cycle is defined in percentage, in this parameter the duty cycle will be used as period, defining the time between two consecutive transmissions.
Payload
The Payload message parameter is defined by the number of Bytes that will be sent in one transmission.
Quantity
To give the user the opportunity to realize more than one test exists the Quantity parameter. The idea behind this parameter lies in usefulness of acquisition of more tests allowing the possibility to create a bigger sample.
Power Level
In order to allow the user to test the effects of different power levels of the wireless radio exists the Power Level message parameter. Some of the most common short-range radio devices have five different levels of power, with so, it was defined that to set the highest power level it is required to set the Power Level parameter at the value 4, the same way, to stablish the lowest power level it is required to set the Power Level parameter at the value 0.
3.5
Behaviour Diagram
Despite the fact that the Activity Interaction Diagrams can provide a useful information regarding the interaction between the architecture intervener’s, for implementation pur-poses a behavioural diagram can provide an easier understanding of the automation methodology, as well as a more extensive information regarding the internal actions of each device.
3.5.1 Auxiliary Device
Figure 3.8: Auxiliar Device state machine
Start:Although it is an obvious state, this state cares for a small explanation. The state
represents the initial state of the device, the manual action of turning on the device.
Analysis:The analysis state is unique to the Auxiliary device, figure 3.8. This state is
continuous loop responsible for the data acquisition power consumption values during the entire test execution.
Store Data:This state is responsible for the storage of the data acquired in the analysis
state, due to the nature of the state it only can be found in the Auxiliary device, figure 3.8.
Wait:The current state will maintain a loop until any input exists, in the Coordinator case
a manual input generated by the user, a Configuration message in the case of the End device or in the auxiliary device case a start command generated by the end device.
Completed Test:Although this state it is not used in the Auxiliary device this state will
3.5. BEHAVIOUR DIAGRAM
3.5.2 Coordinator Device
Figure 3.9: Coordinator Device state machine
TxConfig:This state is used exclusively by the Coordinator device, figure 3.9, this state is
responsible for the acceptance of the testing parameters from the user and consequently its validations. After the parameters validations, the state generates a configuration message with validates testing parameters and transmits it to the end device.
RxACKc:As well as the previous state, this state is appears exclusively in the the
TxTest:This state is used in both,coordinator and end, devices, working as a finite loop state. The operations done in this loop are the generation of testing messages with the defined parameters and conditions set by the user or by the configuration message.
RxTest:As it can be expected this state is the exact opposite of the previous state. It is a
loop state with the reception objective, receiving testing messages sent by the other device. The state keeps track the number of received messages comparing it to the number of expected messages established in the configuration message. In case of an exception event occur, the device can detect the reception of a message that does not correspond to an test message. If the message received in this exception situation is a End-of-Test message the device will automatic generate an exception forcing the test termination and jump to the wait state.
Request-Reply Test:In this state, both devices will be tasked with the transmission and
reception of test messages. In this state the first testing message is always sent by the coordinator device and received by the end device. After a successful reception in the end device, this device is responsible for the transmission of the second testing message, being the coordinator device obliged with the reception, and so on until the end of messages. Similarly to the RxTest, this state also counts the number of test messages comparing it to the number of expected messages.
The deadlock control was also added to this state being only applied in the end device, since the coordinator is always the first to initialize the test communication. The behaviour of this exception is absolutely the same as the RxTest exception.
TxEoT:This state is used in both devices,Coordinator and End device, being the state
responsible for the transmission the information that the test was ended. In order to maintain the architecture free of deadlocks, the transmission this synchronism message is the solely responsibility of the device that start the transmission of the testing messages.
RxEoT:As it can be expected this state is responsible for the reception of a message
repre-senting the End-of-Test, being used in both devices.
TxACKe:In order to maintain the synchronism between the Coordinator and End device,
this state is responsible for the transmission of one acknowledge confirming the end of test.
RxACKe:As it can be expected, this state is in the architecture to allow the reception of
3.5. BEHAVIOUR DIAGRAM
3.5.3 End Device
Figure 3.10: End Device state machine
RxConfig:The interaction with the end device, figure 3.10, begins with this state. This
state is responsible for the reception of the configuration message from the coordinator device and consequently its validations.
TxACKc:The existence of this state is exclusive to the end device to maintain the
C
H
A
P
T
E
R
4
T
ESTING AND
V
ALIDATION
4.1
Testing Methodology
The process of finding errors in a system implementations through experimentation is also know as testing process. The testing process usually is carried out in a controlled environment where the normal and exceptional use of the system can be simulated. It is important to understand that testing process cannot ensure complete correctness of an implementation, it only show the presence of errors, not their absence (Tretmans, 2001).
Regarding to testing methodologies, there are several methodologies to evaluate the suit-ability of solutions to meet their requirements, each with its specific field of application (Onofre, 2007). The testing methodology chosen in this work is the ISO-9646: “Open Systems Interconnection (OSI) Conformance Testing Methodology and Framework”. This standard aims to the definition of a testing methodology, a framework for specifying test suites, and procedures to be followed during testing. It is due to the fact that this standard provides a generic testing methodology that it was chosen.
A simplified version of this standard is used presented in the Figure 4.1. In order to test the hypothesis specifications two situations must occur, a set of tests must be defined and the hypothesis must be implemented as proof-of-concept. The implementation of the proof-of-concept does not required a fully-functional implementation, it only requires that the implementation comply with the defined architecture proposes. The test execution results are then observed, leading to a verdict on the compliance of the system under test with the initial requirements defined (Tretmans 2001).
To ensure that the test can be reproduced, they are defined according to the standard ISO 9646 recommendation, a notation independent of any implementation with an wide acceptance, the Tree and Tabular Combined Notation - Version 2 (TTCN-2). With this notation it is possible to specify the behaviour of tests by the sequence of events that need to occur during the test Tretmans 1992.
The Tree and Tabular Combined Notation - Version 2 (TTCN-2) notation table it is com-posed by a header, where is defined the test name, its purpose, the inputs needed during the test execution and the resultant outputs. This table is defined in a tabular form, using incremental indentation to specify a successive chain of events and the same indentation to define alternative events. It is important to highlight that the specified events preceded by the usage of a exclamation mark indicates actions to be executed, being the events pre-ceded by the question mark conditional event. Each sequence ends with the specification of the verdict that is assigned when the execution of the sequence terminates that can be a: “Success”, “Fail” or “Inconclusive”, as despicted in the Table 4.1.
Multiplication by 2 Test Case
Test name: Test the Service multiplication by 2
Purpose: Check if the Service is available and provide the result of the operation Inputs: [I1]: Number to be multiplied, [I2]:Expected result
Outputs [O1]: Result of the multiplication of the input by two
Line Number Behaviour Verdict
1 ! Invoke Service with parameters (I1)
2 ? Returned data as Service Result (O1) being the Service Available 3 ? Result (O1) is equal to Expected (I2) SUCCESS 4 ? Result (O1) is different from the Expected (I2) FAIL
5 ? No Service Result INCONCLUSIVE
Table 4.1: Example of a TTCN based test table
4.2. PROOF OF CONCEPT IMPLEMENTATION
in this particular case it can indicate that the multiplication of the first provided number by two has not the expected result. "Inconclusive" results indicates that no evidence of non-conformance was found, but that the test purpose was not achieved.
Test
Input Output Result
I1: Number I2: Expected
Result O1: Result Expected Actual
1 10 20 20 (3) (3)
2 80 170 160 (3) (4)
3 0 0 No data (3) (5)
Table 4.2: Test Case Example
The obtained results from the tests execution then need to be presented, in this particular case to provide a more analytical view it was presented as a table, Table 4.2. This illustrate the previous example test, in which, each row represents a specific test case and the verdict number resultant from the TTCN table, for the expected and actual results.
4.2
Proof of Concept Implementation
The implementation of the Proof of Concept is in fact the implementation of the
methodol-ogy defined in the previous chapter, the Methodology for WSN communication technologies
automated field tests.
In order to implement the communication between the Coordinator and the End device several wireless radio devices were used, such as HM-11 radio device that implements Bluetooth Low Energy (BLE) protocol, XBee-S1 and XBeePro-S1 that implements 802.15.4 protocol. Once the communication is established the devices will exchange messages according to the configuration message template previously defined. To accomplish this, after each configuration message component will appear the equal sign representing the beginning of each parameter value followed by a semicolon representing the end of the value, as it can be seen in the Figure 4.2.