Ana Catarina Couto Almeida
Licenciada em Química Aplicada
Gold Nanoparticles for Plasmid Delivery
Dissertação para obtenção do Grau de Mestre em Bioquímica
Orientadora: Rita Cabral, Postdoctoral Research Fellow, FCT-UNL
Co-orientador: Pedro M. R. Viana Baptista, Professor Associado
com Agregação, FCT-UNL
Júri:
Presidente: Prof. Doutor José Ricardo Ramos Franco Tavares Arguente: Doutora Inês Isabel Fernandes Gomes Vogal: Prof. Doutor Pedro M. R. Viana Baptista
iii Gold Nanoparticles for Plasmid Delivery
Copyright Ana Catarina Couto Almeida, FCT/UNL, UNL
v RESUMO
A terapia génica representa uma estratégia ideal para o tratamento de doenças genéticas e adquiridas, como o cancro, e tipicamente envolve a inserção de um gene funcional em células para corrigir uma disfunção celular ou para fornecer uma nova função. Os sistemas de transporte de ácidos nucleicos são baseados em dois modelos: vectores virais e não virais. Os primeiros apresentam uma alta eficiência na entrega do material genético mas a sua maior barreira é a imunogenicidade. Uma vez que os vectores não virais não apresentam imunogenicidade, estes têm sido amplamente estudados. As nanopartículas de ouro têm sido propostas como óptimos sistemas de entrega de material genético, devido ao seu tamanho reduzido, elevado rácio superfície-volume e capacidade de serem funcionalizadas com várias moléculas. No presente trabalho desenvolveu-se uma formulação baseada em nanopartículas de ouro para transporte de um plasmídeo, contendo como gene repórter um gene codificante da proteína verde fluorescente, numa linha celular de cancro colo-rectal. O sistema de entrega resultou da funcionalização de AuNPs de 14 nm com uma múltipla camada de PEG (4300114 cadeias de PEG/AuNP), aumentando a estabilidade e a biocompatibilidade das AuNPs; amónios quaternários que providenciam cargas positivas que permitem a ligação electroestática do plasmídeo, que é considerado o agente terapêutico que se pretende transportar para dentro das células. O sistema desenvolvido foi caracterizado por espectroscopia de UV-vis, DLS, TEM e análise electroforética em gel de agarose, tendo-se produzindo um sistema com um diâmetro de 113.5 nm. A eficiência da transfecção celular com o sistema desenvolvido foi avaliada por PCR e pela expressão da proteína verde fluorescente (enhanced green fluorescente protein, EGFP), através de espectroscopia de fluorescência e microscopia de fluorescência. Verificou-se que a internalização do sistema ocorre após 3h de incubação, no entanto observou-se um nível residual de expressão da proteína. Depois de 24h de incubação, a expressão aumentou 3 vezes em relação às células não transfectadas. O sistema comercial (Lipofectamine) expressou 5 vezes mais EGFP do que o sistema desenvolvido AuNP@PEG@R4N+@pEGFP. Esta diferença poderá estar relacionada com a menor translocação para o núcleo.
Termos chave: nanopartículas de ouro, bioconjugação, nanotransportador, terapia génica,
vii ABSTRACT
Gene therapy presents an ideal strategy for the treatment of genetic as well as acquired diseases, such as cancer and typically involves the insertion of a functioning gene into cells to correct a cellular dysfunction or to provide a new cellular function. Gene delivery vectors are based in two models: viral and non-viral. Viral vectors have high transfection efficiency but their major barrier is immunogenicity. Since the non-viral vectors have no immunogenicity, these have been widely studied. Gold nanoparticles have been proposed as optimal delivery systems of genetic material, due their small size, high surface-to-volume ratio and the ability to be functionalized with multiple molecules. In the present work, an AuNP-based formulation was developed to deliver a plasmid in a colorectal cancer cell line, containing as reporter gene the gene encoding to EGFP. The delivery system resulted from the functionalization of 14 nm AuNP with a PEG layer (4300114 PEG chains/AuNP), which increases stability and biocompatibility of AuNPs; quaternary ammonium groups which provide positive charges that allow electrostatic binding of plasmid, which is considered the therapeutic agent to be transported into cells. The system developed was characterized by UV-vis spectroscopy, DLS, TEM and by electrophoretic mobility, yielding a formulation with 113.5 nm.Transfection efficiency of the formulation developed was evaluated through PCR and through EGFP expression by fluorescence microscopy and fluorescence spectroscopy. The internalization was observed 3h post transfection; however a low level of EGFP expression was achieved. After 24h of incubation, EGFP expression increases just 3 times compared to non-transfected cells. The commercial system (Lipofectamine) expressed EGFP 5 times more than the system developed AuNP@PEG@R4N+@pEGFP. This difference could be related to lower translocation to the nucleus.
ix
TABLE OF CONTENTS
RESUMO... v
ABSTRACT ... vii
FIGURE INDEX ... xi
TABLE INDEX ... xv
ABBREVIATIONS ... xvii
1. INTRODUCTION ...1
1.1 CANCER: AN OVERVIEW ...1
1.1.1 CURRENT NEEDS ...1
1.2 GENE THERAPY ...1
1.2.1 GENE DELIVERY SYSTEMS...4
1.2.2 BARRIERS FOR NON-VIRAL GENE DELIVERY METHODS...6
1.3 NANOBIOTECHNOLOGY ...9
1.3.1 GOLD NANOPARTICLES ...10
1.3.2 GOLD NANOPARTICLES SYNTHESIS ...11
1.3.3 GOLD NANOPARTICLES FUNCIONALIZATION ...12
1.3.4 GOLD NANOPARTICLES FOR DELIVERY APPLICATIONS ...14
1.4 OBJECTIVES ...16
2. MATERIALS AND METHODS ...17
2.1 NANOTECHNOLOGY ...17
2.1.1 GOLD NANOPARTICLES SYNTHESIS ...17
2.1.2 AuNPs FUNCTIONALIZATION WITH PEG CHAINS ...17
2.1.3 AuNPs FUNCTIONALIZATION WITH QUATERNARY AMMONIUM BY EDC/NHS COUPLING REACTION ...18
2.1.4 FUNCTIONALIZATION OF AuNP@PEG@R4N+ WITH pEGFP VECTOR ...18
2.1.5 DYNAMIC LIGHT SCATTERING MEASUREMENTS ...19
2.1.6 TEM ANALYSIS ...19
2.2 MOLECULAR BIOLOGY ...19
2.2.1 PREPARATION OF COMPETENT E.coli CELLS USING THE CACL2 METHOD ...19
2.2.2 E.coli TRANSFORMATION (based on the protocol by Ausubel el al., 1987) ...20
2.2.3 E. coli PLASMID EXTRACTION ...20
2.3 PCR FOR THE AMPLIFICATION OF THE GENE ENCODING EGFP AND FTO GENE .21 2.4 CELL CULTURE MANIPULATION ...22
2.4.1 DETERMINATION OF CELL CONCENTRATION ...22
2.5 TRANSFECTIONS STUDIES ...23
2.5.1 EGFP VECTOR TRANSFECTION ...23
2.5.2 FLUORESCENCE MICROSCOPY ...24
x
2.5.4 EVALUATION OF AuNP UPTAKE BY CELLS ...24
2.6 MTS ASSAY ...25
3. RESULTS AND DISCUSSION ...27
3.1 GOLD NANOPARTICLES SYNTHESIS AND CHARACTERIZATION ...27
3.2 GOLD NANOPARTICLES FUNCIONALIZATION ...27
3.2.1 POLY (ETHYLENE GLYCOL) (PEG) ...27
3.2.2 QUATERNARY AMMONIUM ...29
3.2.3 EGFP PLASMID BINDING TO AuNP@PEG@R4N+...31
3.3 TRANSFECTION STUDIES ...36
3.3.1 EGFP EXPRESSION EVALUATION BY FLUORESCENCE SPECTROSCOPY AND FLUORESCENCE MICROSCOPY...36
3.3.3 EVALUTION OF NANOCONJUGATE UPTAKE BY PCR ...40
3.4 TOXICITY ASSESSMENT OF AuNP-BASED FORMULATION ...44
4. CONCLUSIONS AND FUTURE PERSPECTIVES ...47
5. REFERENCES ...49
xi FIGURE INDEX
Figure 1.1 – Current gene delivery vectors in clinical trials ...4
Figure 1.2 – Barriers and intracellular trafficking of plasmid DNA. The first step is the
complexation of DNA with the delivery vector; DNA can be internalized via receptor mediated pathways or by endocytosis. Once inside the cells the vector needs to escape from the endosome, cross the cytoplasm, the DNA needs dissociate from the vector and reach into the nucleus where it can be transcribed ...6
Figure 1.3 – Endosomal escape by the ‘‘proton-sponge effect’’. During maturation of
endosome, pH decreases from 6 to 4. The protons pumps pump H+ ions inside the endosome. These protons are sequestered by the entrapped material, sustaining the action of the proton pump. An influx of Cl- ions and water accompanies the influx of protons and this causes swelling and the rupture of endosome, allowing entrapped material to escape ...8
Figure 1.4 – Schematic representation of a multifunctional nanoparticle. These innovative
nanoparticles comprise nucleic acids, aptamers and anti-cancer drugs used for delivery to the target tissue. Tumoral markers, peptides, PEGs and antibodies can be used to improve nanocarrier circulation, effectiveness and selectivity. Reporter molecules attached to the particle surface can be employed as tracking and/or contrast agentss ...13
Figure 1.5 –EDC coupling reaction scheme. EDC is a zero-length crosslinking agent used to
couple carboxyl groups to primary amines. In the presence of sulfo-NHS, EDC can be used to convert carboxyl groups to amine-reactive sulfo-NHS esters. The addition of sulfo-NHS stabilizes the amine-reactive intermediate by converting it to an amine-reactive Sulfo-NHS ester, thus increasing the efficiency of EDC-mediated coupling reaction. ...13
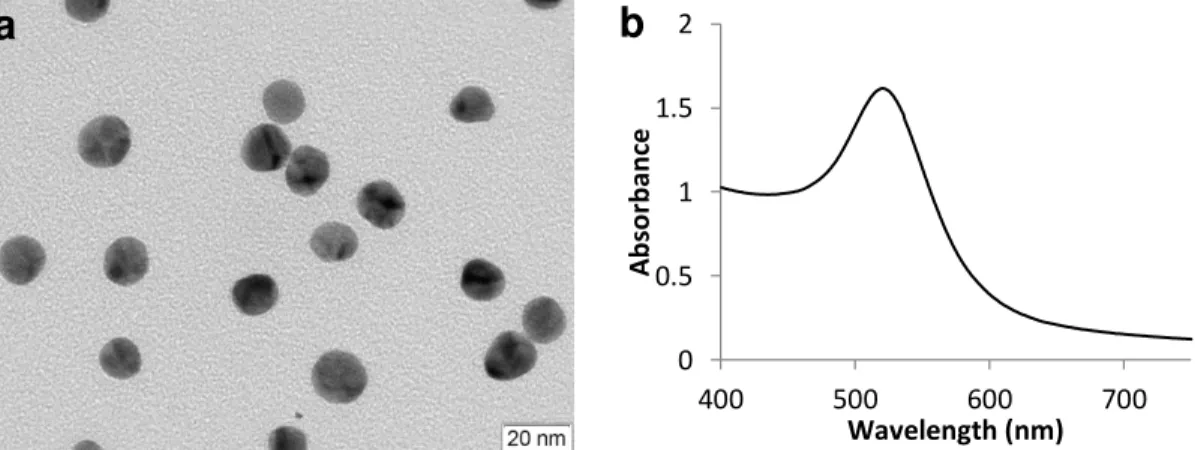
Figure 3.1 – Characterization of the synthesized AuNPs: (a) Transmission electron microscopy
(TEM) showing monodisperse spherical AuNPs (scale bar 20 nm); (b) UV-vis spectrum of the synthesized gold nanoparticles revealing a SPR band at 521 nm...27
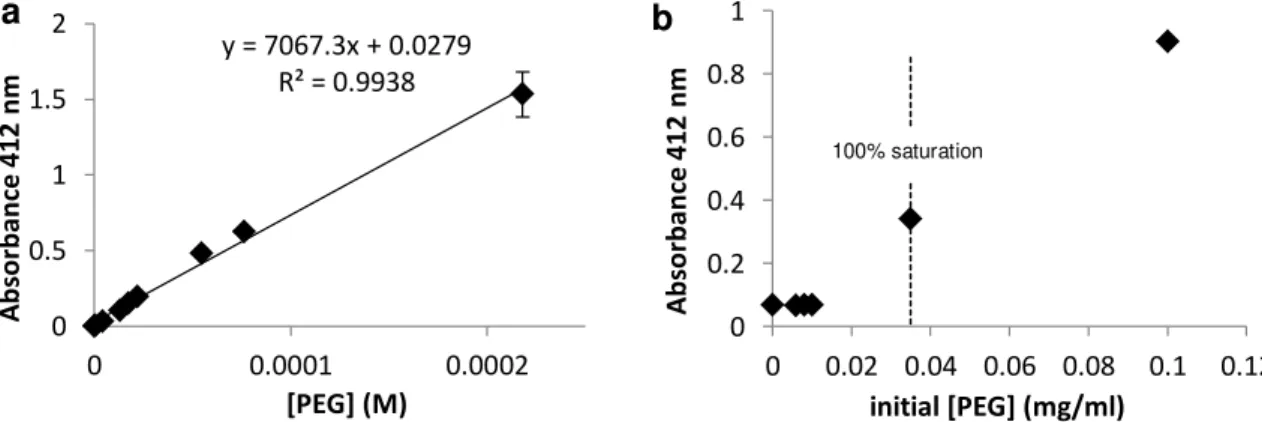
Figure 3.2 – (a) Standard calibration curve for PEG chains, whose concentration can be
calculated via the following equation Abs412nm = 7067.3 x [PEG] (M) + 0.0279. (b) Variation of the excess of PEG thiolated chains as a function of the initial concentration in the incubation with 10 nM AuNPs. The vertical line indicates the 100% saturation, i.e. the PEG concentration above which no more PEG can be bonded to AuNP surface……...28
Figure 3.3 – UV-vis spectra of synthesized AuNPs and coated with PEG chains, revealing a
xii
Figure 3.4 – UV-vis spectra of AuNP@PEG coated with increase amount of quaternary
ammonium. When the R4N+ group is not added, SPR absorption band is located at 523 nm, while in the presence of quaternary ammonium a shift to 526 nm is observed………..30
Figure 3.5 – UV-vis spectra of synthesized AuNPs, AuNP@PEG and coated with 7.5 mg/ml of
quaternary ammonium, revealing a shift from 524 (AuNP@PEG) to 526 nm, a 2 nm shift of the SPR band for quaternary ammonium binding………...31
Figure 3.6 – UV-vis spectra of AuNP@PEG@R4N+@pEGFP were taken 1h after addition of the
plasmid and centrifuge one time. A shift on SPR band to larger wavelengths was observed as the concentration of plasmid was increased………...32
Figure 3.7 – UV-Vis spectra of AuNP@PEG@DNA were taken 1h after addition of the pDNA
and centrifuge one time. No binding of the pDNA was observed, once no shift on the SPR band
was observed and the absorbance at 260 nm suffered no change………...33
Figure 3.8 – Agarose gel electrophoresis (1%, TAE 1x, 80 V for 60 min) of
AuNP@PEG@R4N+@pEGFP complexes prepared at the concentrations of pEGFP (0.2 – 50 ng/l) given on top with a fixed amount of AuNPs (10 nM): lane 1 – plasmid DNA only; lane 2 - 7
– AuNP@PEG@R4N+@pEGFP 0.2 – 50 ng/l; lane 8 - 13 – supernatants from the samples AuNP@PEG@R4N+@pEGFP 0.2 – 50 ng/l; lane 14 - 19 – AuNP@PEG@DNA 0.2 – 50 ng/l; lane 20 - 25 – supernatants from the samples AuNP@PEG@pEGFP 0.2 – 50 ng/l…………..34
Figure 3.9 – UV-vis spectra of synthesized AuNPs and funcionalised with PEG, quaternary ammoniums and pEGFP. The SPR band exhibited a shift to major wavelengths while the different groups bound to AuNPs surface………...35
Figure 3.10 – (a) Images obtained by fluorescence microscopy (scale bar, 50 m) of HCT-116
cells transfected with EGFP expression vector, using Lipofectamine 2000 and
AuNP@PEG@R4N+@pEGFP, after 3h and 6h incubation. HCT-116 cells transfected using
Lipofectamine 2000 shows a low level of EGFP expression, while with the
AuNP@PEG@R4N+@pEGFP no expression was achieved; (b) Relative expression of EGFP
was assessed by fluorescence spectroscopy, 3h and 6h after transfection HCT-116 cells transfected with 1 g of the EGFP expression vector, using Lipofectamine 2000 and
AuNP@PEG@R4N+@pEGFP. Not transfected cells and with AuNP@PEG@R4N+ were used as
xiii
Figure 3.11 – (a) Images obtained by fluorescence microscopy (scale bar, 50 m) of HCT-116 cells transfected with EGFP expression vector, using Lipofectamine 2000 and
AuNP@PEG@R4N+@pEGFP, after 12h and 24h incubation; (b) Relative expression of EGFP
was assessed by fluorescence spectroscopy, 12h, 24h and 48 h after transfection HCT-116 cells with 1 g of the EGFP expression vector, using Lipofectamine 2000 and
AuNP@PEG@R4N+@pEGFP. Not transfected cells and with AuNP@PEG@R4N+ were used as
control………...39
Figure 3.12 – Agarose gel electrophoresis (1%, 1x TAE, 60V 1h30) showing the amplification of
EGFP gene using extracted DNA from transfected and non-transfected cells as template. Lane 1 and 20 – ladder; lane 2 and 3 – control and EGFP plasmid amplified; lane 4 - 7 – 3h post transfection: cells, Lipofectamine@pEGFP, AuNP@PEG@R4N+, AuNP@PEG@R4N+@pEGFP, respectively; lane 8 - 11 – 6h post transfection in same order described previously; lane 12 - 15
– 12h post transfection in same order described previously; lane 16 - 19 – 24h post transfection in same order described previously; (b) Amplification of FTO used as internal control. Lane 2 –
control; Lane 3 – 6 – 3h post transfection: cells, Lipofectamine@pEGFP, AuNP@PEG@R4N+, AuNP@PEG@R4N+@pEGFP, respectively; lane 7 – 10 – 6h post transfection in same order described previously; lane 11 – 14 – 12h post 12h post transfection in same order described previously; lane 15 – 19 – 24h post transfection in same order described previously…………..41
Figure 3.13 – Cell viability of HCT-116 cells after transfection with AuNPs-based formulations and Lipofectamine 2000, at 48 h of incubation. Negligible influence in cell viability is observed for all nanoconjuates tested when compared to untreated cells (control)………...44
xv TABLE INDEX
Table 1.1 – Current non-viral delivery systems………...5
Table 2.1 – Primers sequence used in PCR reaction to EGFP and FTO gene ...21
Table 2.2 – Reaction Program to amplify the gene encoding EGFP ...21
Table 2.3 – Reaction Program to amplify FTO gene ...22
xvii ABBREVIATIONS
AuNPs Gold Nanoparticles
cDNA complementary DNA (DNA synthesized from mRNA template) DEPC Diethylpyrocarbonate
DLS Dynamic Light Scattering
DMEM Dulbecco's Modified Eagle Medium dNTPs Deoxyribonucleotide Triphosphate dsDNA double-stranded DNA
DTNB 5,5’-dithio-bis(2-nitrobenzoic) acid
EDC 1-Ethyl-3-(3-dimethylaminopropyl) carbodiimide EGFP Enhanced Green Fluorescent Protein
EGFR Epidermal Growth Factor Receptor FBS Fetal bovine serum
FTO Fat mass obesity associated gene HCT-16 Human Colorectal Carcinome
LSPR Localized surface plasmon resonance MDR Multiple drug resistance
MES 2-(N-morpholino)ethanesulfonic acid
MTS (3-(4,5-dimethylthiazol-2-yl)-5-(3-carboxymethoxyphenyl)-2-(4-sulfophenyl)-2H-tetrazolium)
MW Molecular weight PBS Phosphate Buffer Saline pDNA Plasmid DNA
PEG Poly (ethylene glycol) PMS Phenazinemethosulfate rpm Revolutions per minute R4N+ Quaternary ammonium SDS Sodium Dodecyl Sulfate siRNA Small interfering RNA Sulfo-NHS N-hydroxysulfosuccinimide TEM Transmission electron microscopy
1
1. INTRODUCTION
1.1 CANCER: AN OVERVIEW
Cancer is one of the leading causes of mortality in the modern world, with more than 10 million new cases every year. According to GLOBOCAN 2012, the three types of cancer with the highest incidence at a global level are the breast, lung and colorectal cancers, while the highest mortality rate is associated with lung, colorectal and stomach cancers [GLOBOCAN, 2012]. Cancer is defined as a multifactorial disease characterized by uncontrolled growth and spread of abnormal cells. Behind the origin of cancer are factors that can be internal, such as inherited mutations, hormones, immune conditions, and mutations that occur from metabolism and external factors like tobacco, infectious organisms, chemicals, and radiation (Cancer Facts & Figures 2014).
The main characteristic common to different types of cancer are proliferative signaling, evasion of growth suppressors, resistance to cell death, replicative immortality, angiogenesis, invasion and metastasis (Hanahan & Weinberg 2011).
1.1.1 CURRENT NEEDS
The potential to provide new targets and strategies for cancer therapy lies in understanding cancer biology. A huge amount of research has already been carried out, resulting in a number of available treatments. Currently, the most common therapies include surgery, radiation, chemotherapy, hormone therapy, biological therapy, and targeted therapy (Cancer Facts & Figures 2014).
However, these available treatments are limited because the agents used do not differentiate between cancerous and normal cells, causing toxicity to healthy cells, severe side effects and eventually multiple drug resistance. Thus, the main goal in cancer treatment is to develop a therapeutic system that takes advantage of the potency of therapeutic agents by more effectively targeting them to tumor tissues (Liu et al. 2007, Nazir et al. 2014)
1.2 GENE THERAPY
2 An ideal gene delivery system should be stable, biocompatible, nontoxic, present lack of immunogenicity, capable of highly efficient transport of exogenous genetic material into their target sites, resistant to premature degradation and capable of modulation of gene expression for a desired period of time (Jones et al. 2013, Liu & Zhang 2011).
Nucleic acids have been explored to treat various diseases, such as cancer, genetic disorders, infections and cardiovascular diseases. Thus, gene therapy involves the use of nucleic acid as therapeutics agents, such as plasmid DNA (pDNA), oligonucleotides, small interfering RNA (siRNA), aptamers, Ribozymes or DNAzymes.
Plasmid vectors are high molecular weight, double-stranded DNA constructs containing transgenes, which encode specific proteins. In the early stages of development, plasmid-based gene therapy can be employed to correct inheritable disorders resulting from a single gene defect. Gene therapy using plasmid DNA is based on the introduction of the pDNA, encoding a therapeutic gene sequence, into the nucleus of the target cells to express functional proteins, through transcription and translation (Liang & Lam 2012, Pushpendra et al. 2012). The mechanism of action of plasmid DNA involves the entry of plasmid molecules into the nucleus after entering the cytoplasm. The entry of plasmid molecules into the nucleus through the nuclear pore complexes is an extremely challenging and difficult process that controls the efficiency of gene expression (Patil et al. 2005, Pushpendra et al. 2012). Gene expression is also controlled by regulatory signals such as the promoter and enhancer sequences. Promoter sequences initiate the transcription process by acting as a recognition site for the RNA polymerase. Higher efficiency can be obtained by engineering the plasmid with strong tissue- or tumor-specific promoters (Elsabahy et al. 2011).
Another approach for induction of transgenes is suicide gene therapy. This method involves the stable transfection of chemosensitization genes in tumor cells, which upon gene expression convert a separately administered, nontoxic pro-drug into a chemotoxic drug. Since only the transfected tumor cells are capable of this intracellular conversion, only these cells are susceptible to the chemotoxic entity (Patil et al. 2005).
3 Another gene therapy approach involves the delivery of small interfering RNA (siRNA). This is used as posttranscriptional mechanism of gene silencing. Typically, these are short double-stranded RNA segments with 21–23 nucleotides, namely the guide strand and passenger strand, the former of which is complementary to the target mRNA sequence of the gene whose translation is to be blocked. The mechanism of action involves the incorporation of the siRNA guide strand into RNA-induced silencing complexes (RISCs), which bind to the mRNA of interest and stimulate mRNA degradation mechanisms, such as nuclease activity, that lead to silencing of the particular gene. This approach using siRNAs is more promising than antisense oligonucleotides due their high degree of specificity to mRNAs. Furthermore, this technology has a more rapid development that oligonucleotides or plasmid DNA, because siRNAs does not have to enter the nucleus for their activity and require less refined delivery systems (Patil et al. 2005, Pushpendra et al. 2012).
Aptamers are another class of nucleic acids used in gene therapy. These are single stranded oligonucleotides (RNA or DNA) that recognize their targets on the basis of shape complementarity. The mechanisms of action are different from other oligonucleotides because, while some oligonucleotide therapies interfere with the translational machinery, aptamers target proteins directly and bind to them, altering their function. Their behavior is similar to antibodies and is preferred over antibodies in protein inhibition due their specificity and nonimmunogenicity (Prasad & Roy 2008, Pushpendra et al. 2012)
The last type of gene therapy agents are ribozymes. These are RNA enzymes that are capable of sequence specific cleavage of mRNA molecules, resulting in selective inhibition of expression of deleterious genes. In their mechanism of action, a ribozyme binds specifically to an mRNA strand and cleaves it, preventing its translation. After cleavage, the enzyme is released and is ready for binding and destroying another mRNA molecule, leading to highly specific knockdown of the target genes. The presence of the RNA backbone in ribozymes makes them biologically unstable in vivo because these are easy targets for degradation by RNases (Prasad & Roy 2008, Pushpendra et al. 2012).
Another type of nucleic acid enzymes are DNAzymes. They are analogs of ribozymes with greater biological stability because the RNA backbone chemistry is replaced by the DNA motifs that confer improved biological stability (Patil et al. 2005).
4 approved clinical trials. The other method is transfection of plasmid DNA using liposomes and has been used in ~9% of approved trials (Cotrim & Baum 2008).
1.2.1 GENE DELIVERY SYSTEMS
Gene delivery systems can be divided in viral and non-viral systems. Viral vectors consist of viruses that are genetically engineered to be replication-deficient. They are the most effective but their immunogenicity, oncogenicity, small size of the DNA they can transport and the difficult optimization in large-scale production limit their applications. Non-viral have gain more attention due their favorable properties, including lack of immunogenicity, low toxicity, potential for tissue specificity, large gene insert size and they are low cost and more reproducible. The main limitation of non-viral systems is their low transfection efficiency. Currently, viral vector has dominated the clinical trials in gene therapy for its relatively high delivery efficiency, as show in Figure 1.1, standing out the adenovirus with 23.4%, the retrovirus with 19.2% and plasmid DNA with 17.8% (Gascón et al. 2013, Kaliberov & Buchsbaum 2012, Liu & Zhang 2011).
Figure 1.1 - Current gene delivery vectors in clinical trials
(http://www.wiley.com//legacy/wileychi/genmed/clinical/).
Non-viral gene delivery systems were developed as an alternative to viral-based systems. They can be divided into physical methods where a physical force is applied to increase permeability of the cell membrane and chemical methods that use natural or synthetic carriers to delivery genes into the cell (Cevher et al. 2012).
1.2.1.1 NON-VIRAL GENE DELIVERY SYSTEMS
5
gene, promote cellular uptake, release nucleic acids into the cytoplasm and promote nuclear entry (for pDNA delivery). Physical and chemical methods can help delivery systems to cross
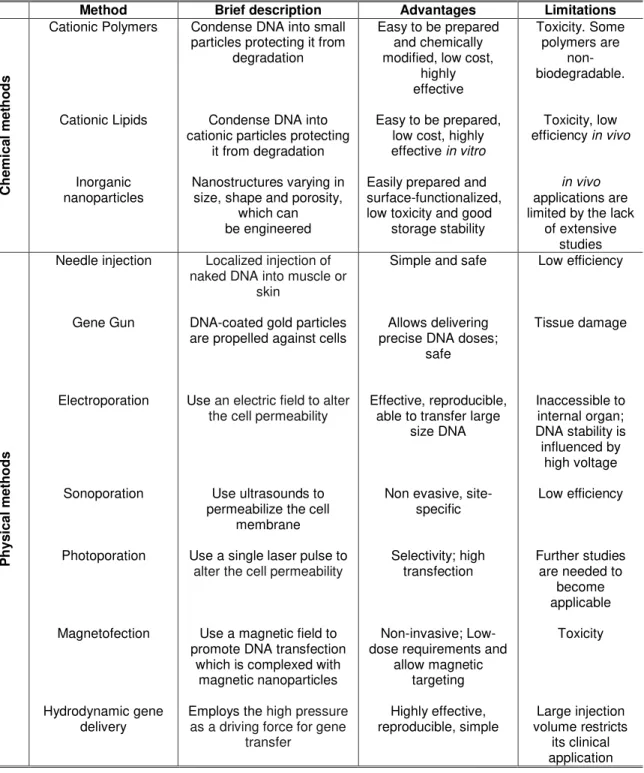
plasma membrane in in vitro and ex vivo applications. Numerous non-viral delivery systems have been developed and widely studied during the past years, as show in Table 1.1 (Chou et al. 2011, Liang & Lam 2012).
The most well studied non-viral gene delivery systems are cationic polymers and cationic lipids.
Table 1.1 – Current non-viral delivery systems (Al-Dosari & Gao 2009, Cevher et al. 2012, Gascón et al.
2013, Wang et al. 2013).
Method Brief description Advantages Limitations
C h emi ca l met h o d s Cationic Polymers Cationic Lipids Inorganic nanoparticles
Condense DNA into small particles protecting it from
degradation
Condense DNA into cationic particles protecting
it from degradation
Nanostructures varying in size, shape and porosity,
which can be engineered
Easy to be prepared and chemically modified, low cost,
highly effective
Easy to be prepared, low cost, highly
effective in vitro
Easily prepared and surface-functionalized, low toxicity and good
storage stability Toxicity. Some polymers are non-biodegradable. Toxicity, low
efficiency in vivo
in vivo applications are limited by the lack
of extensive studies Ph ysi cal meth o d s Needle injection Gene Gun Electroporation Sonoporation Photoporation Magnetofection Hydrodynamic gene delivery
Localized injection of naked DNA into muscle or
skin
DNA-coated gold particles are propelled against cells
Use an electric field to alter the cell permeability
Use ultrasounds to permeabilize the cell
membrane
Use a single laser pulse to alter the cell permeability
Use a magnetic field to promote DNA transfection
which is complexed with magnetic nanoparticles
Employs the high pressure
as a driving force for gene transfer
Simple and safe
Allows delivering precise DNA doses;
safe
Effective, reproducible, able to transfer large
size DNA
Non evasive, site-specific
Selectivity; high transfection
Non-invasive; Low-dose requirements and
allow magnetic targeting Highly effective, reproducible, simple Low efficiency Tissue damage Inaccessible to internal organ; DNA stability is
influenced by high voltage
Low efficiency
Further studies are needed to
6
1.2.2 BARRIERS FOR NON-VIRAL GENE DELIVERY METHODS
The inefficiency of gene delivery primarily results from the inability of the vectors to surpass the inumerous barriers encountered from the site of administration to localization in the cell nucleus. Generally, the barriers can be divided into extracellular and intracellular. Extracellular barriers are characterized by vector stability, blood components and opsnization and last endothelial barriers, such as blood brain barrier, vitreous humor, respiratory mucus.
A prerequisite for efficient gene transfer is the delivery of nucleic acids from outside the cell to the nucleus. However, for gene delivery in particular, intracellular barriers represent an extra concern when designing the formulation. There are four major intracellular barriers:
1. Cellular binding 2. Cellular uptake 3. Endosomal escape 4. Nuclear entry
Figure 1.2 – Barriers and intracellular trafficking of plasmid DNA. The first step is the complexation of DNA with the delivery vector; DNA can be internalized via receptor-mediated pathways, including endocytosis, or by receptor-independent mechanisms. Once inside the cells the vector needs to escape from the endosome, cross the cytoplasm, the DNA needs dissociate from the vector and reach into the nucleus where it can be transcribed (Liu & Zhang 2011).
7 carbohydrates and small molecules have been used to induce target cell-specific internalization (Al-Dosari & Gao 2009, Gascón et al. 2013, Liu & Zhang 2011).
Commonly, internalization is achieved by endocytosis. During this process, some part of the plasma membrane surrounds the vector and engulfs into a vesicle that then pinches off from the cell membrane, enters the cytosol and cross into the cell to its intracellular target. Endocytosis is divided into phagocytosis (the uptake of large particles) and pinocytosis (the uptake of fluids and solutes). While phagocytosis is restricted to specialized phagocytes such as macrophages, neutrophils and monocytes, pinocytosis occurs in all types of cells. Pinocytosis is divided in four classes: (i) clathrin-mediated endocytosis; (ii) caveolae-mediated endocytosis; (iii) macropinocytosis; (iv) clathrin- and caveolae- independent endocytosis (El-Sayed & Harashima 2013, Khalil et al. 2006, Liu & Zhang 2011).
The transfection efficiency of nucleic acid delivery systems is correlated not only with the level of cellular uptake but also with their ability to escape from endosomal compartments. Once inside the cells, delivery vectors tend to be trapped in the early endosome, where the pH drops from neutral to around pH 6 and then traffic through the cell (Liang & Lam 2012, Liu & Zhang 2011).The evolution of endosomes into late endosomes and lysosomes (the main degradative compartments in the cell) is characterized by rapid acidification from pH 6 to 4 within the vesicle and recruitment of degradative enzymes into the vesicle to digest vesicular content. Therefore, gene escape from the endolysosomal network becomes a very important limiting step in achieving an effective gene therapy (Chou et al. 2011, Liang & Lam 2012).
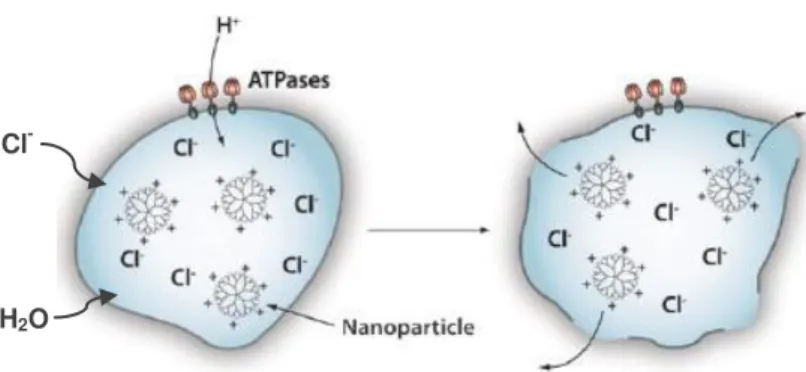
Several approaches have been developed to promote early endosomal escape of non-viral gene delivery systems and many hypotheses have been suggested to explain these processes. One of the hypotheses, proposed for cationic polymers and dendrimers, is the proton-sponge effect. However, this hypothesis is also applied to nanoparticles, since these can be coated with high pH buffering capability peptides that undergo structural deformation under acidic pH to disrupt the vesicle membrane. During the maturation of endosomes, the membrane-bound ATPase proton pumps actively translocate protons from the cytosol into the endosomes, leading to the acidification of endosomal compartments (Figure 1.3). At this stage, polymers with the
8
Figure 1.3 – Endosomal escape by the ‘‘proton-sponge effect’’. During maturation of endosome, pH
decrease from 6 to 4. The protons pumps pump H+ ions inside the endosome. These protons are
sequestered by the entrapped material, sustaining the action of the proton pump. An influx of Cl- ions and water accompanies the influx of protons and this causes swelling and the rupture of endosome, allowing entrapped material to escape (adapted from Chou et al. 2011).
Another mechanism for endosomal escape is the destabilization of the endosomal membrane. Once inside the endosomes, cationic lipoplexes interact electrostatically with negatively charged lipids of the endosomal membrane. Consequently, anionic lipids of the endosomal membrane diffuse into the lipoplexes and form charge-neutralized ion pairs with the cationic lipids of the lipoplexes. As a result, the nucleic acids are moved from the lipoplexes, allowing the nucleic acids to be released into the cytoplasm(Liang & Lam 2012, Liu & Zhang 2011).
Pore formation is another hypothesis proposed to explain the endosomal escape of peptide-based nucleic acid delivery systems. This mechanism is peptide-based on the fact that some peptides have high affinity for the rim of the pore. Pore forming peptides induce bending of the membrane and contiguity of the bilayer leaflets, thus opening a pore in the membrane and facilitating release of endosomal contents (Medina-Kauwe et al. 2005, Varkouhi et al. 2011).
The last hypothesis proposed to endosomal escape is the photochemical disruption of the endosomal membrane. Photochemical internalization (PCI) is a light-directed delivery method that utilizes photosensitizers to facilitate the transport of membrane impermeable macromolecules from endocytic vesicles into cytoplasm. Once confined in the endosome and exposed to light, these photosensitizers induce the formation of reactive oxygen species, mainly singlet oxygen, leading to the rupture of endosome membrane, whereas the contents of the organelles remain intact. As a result, entrapped material can be released into the cytosol (Liang & Lam 2012, Varkouhi et al. 2011).
The last barrier that is critical for successful plasmid expression is the nuclear entry, because plasmids cannot be expressed unless they cross the nuclear envelope and enter the nucleus. The mechanisms of DNA nuclear translocation and whether the DNA stays associated with the delivery system are not yet well understood but this appears to depend on the type of delivery vehicle. However, there are three known pathways for DNA transport to the nucleus (Liu & Zhang 2011):
Cl-
9 1. During the cell division stage, in which the nuclear membrane is temporarily broken
down, allowing nuclear uptake of plasmid DNA.
2. By passive transport through nuclear pores. The nuclear envelope is interrupted by large protein structures called nuclear pore complexes (NPC) which allow free diffusion of molecules less than 9 nm, or with MW less than 60 kDa or nucleic acids of up to 300 bp. This route is not applicable to plasmids since gene delivery vectors are much larger than 9 nm.
3. By active transport through nuclear pore complexes for particles less than 25 nm. This active transport is regulated by specific nuclear import and export systems such as nuclear localization signal (NLS) peptides (Al-Dosari & Gao 2009, Liu & Zhang 2011, Vaughan et al. 2006).
After the plasmid enters the nucleus, a low level expression can occur and may be explained by the fact that, in most cases, the plasmid stays in the nucleus as an episomal DNA molecule without substantial chance to integrate into the host genome. During cell division these episomes do not replicate and will eventually be diluted away as the population of dividing cells grows (Al-Dosari & Gao 2009).
1.3 NANOBIOTECHNOLOGY
Nanotechnology is a multidisciplinary field that brings together diverse fields of research and development such as engineering, biology, physics and chemistry (Baptista 2009) .Formally, nanotechnology can be defined as the design, development and application of structures, devices and systems by controlling shape and size at the nanometer scale, i.e., at the level of atoms, molecules, and supramolecular structures. The nanometer scale is interesting in biological systems given the inherent nanoscale of functional components of living cells. So, it was inevitable that nanotechnology would be applied to biotechnology. Thus, the fusion between nanotechnology and biotechnology has created a new field of research –
Nanobiotechnology (Eustis & el-Sayed 2006, Jain 2008, Khalel et al. 2010).
10 delivery and molecular imaging are being investigated at present (Fakruddin et al. 2012, Liang et al. 2012)
Several approaches have been considered for the development of nanotheranostic techniques. However, nanoparticles (size range 1-100 nm) are one of the most common approaches, due their high surface-to-volume ratio, quantum size effect and electrodynamics interactions. Between these, gold nanoparticles are the most extensively studied nanomaterials and have led to the development of innumerous techniques and methods for molecular diagnostics, imaging, drug delivery, gene therapy, photothermal therapy and cell cycle regulation (Dreaden et al. 2011, Liang et al. 2012).
1.3.1 GOLD NANOPARTICLES
Gold nanoparticles have been used since ancient times due to their optical properties, in particular for staining glass. Systematic investigations on gold nanoparticles go back to the days of Faraday, when he reported the formation of deep red solutions upon reduction of chloroaurate (AuCl4-) with white phosphorous. However their use in biological applications happened only in the last decade (Haiss et al. 2007, Sperling et al. 2008)
Gold nanoparticles, also known as colloidal gold, are a suspension of sub-micrometer-sized gold metal particle in a fluid and can be obtained with diameters between 3 and 200 nm. AuNPs have gained increasing interest because they exhibit features which are fundamentally different from all other nanostructures. Their simple and fast preparation, controllable morphology and size dispersion and shapes, extraordinary optical and electronic properties, easy surface functionalization, high stability and biological compatibility, and the efficient conversion of light into heat, make them powerful agents within the anti-cancer nanotechnology filed of research (Huang et al. 2007, Sperling et al. 2008)
Gold nanoparticles represent a versatile, potent, selective, and highly multi-functional anti-cancer technology. Due their small size, gold nanoparticles can easily interact with biomolecules both at surface and inside cells, improving signals and providing target specificity for diagnostics and therapeutics (Conde et al. 2012b)
1.3.1.1 Optical properties
11 electrons on their surface (Huang et al. 2007). Gold nanoparticles have shown a range of biological and biomedical applications, due to their electrical, chemical and mainly to their strongly enhanced optical properties (Huang et al. 2007, Khan et al. 2013). The optical properties of gold nanoparticles are significant because absorption and emission can occur within the visible range of light (El-Sayed 2001).
For biomolecular detection, an important feature of gold nanoparticles is the surface plasmon resonance (SPR). The SPR is the collective oscillation of the free electrons within the conduction band. The oscillation frequency is usually in the visible region giving rise to the strong SPR absorption. The SPR is very sensitive to the composition, size, shape, inter-particle distance and environment (dielectric properties) of the gold nanoparticles (Boisselier & Astruc 2009, Conde et al. 2014a) .For gold nanospheres, 14 nm diameter nanoparticles, this resonance occurs in the visible spectral region at approximately 520 nm, which is the origin of the red color of these nanoparticles in solution (Eustis & el-Sayed 2006, Huang et al. 2007). The plasmon resonance frequency is changed when the average distance between gold nanoparticles is reduced (so that they form small aggregates), and as a consequence, the colloidal solution changes from red to dark blue and the SPR band changes to major wavelengths (Sperling et al. 2008).
1.3.2 GOLD NANOPARTICLES SYNTHESIS
The first scientific report describing the production of colloidal gold nanoparticles came in 1857
when Michael Faraday found that the ‘‘fine particles’’ formed from the aqueous reduction of gold
chloride by phosphorus could be stabilized by the addition of carbon disulfide, resulting in a
‘‘beautiful ruby fluid’ (Faraday 1857). Currently, the methods to obtain gold nanoparticles follow a similar strategy in which a gold salt is reduced in the presence of a reducing agent and a surface capping agent, the latter preventing aggregation of the particles by electrostatic repulsion (Dreaden et al. 2012). In 1951, Turkevich provided the first structural study of gold nanoparticles formed under varying synthetic conditions (Turkevich et al. 1954). Later, in 1973, Frensimproved the Turkevich’s method, producing monodisperse spherical gold nanoparticles with different diameters (Frens 1973).
12 The second popular method using such sulfur coordination for gold nanoparticles stabilizations the Shiffrin–Brust biphasic synthesis using HAuCl4, a thiol, tetraoctylammonium bromide and NaBH4 in water–toluene yielding thiolate-AuNPs (Brust et al. 1994). Other methods to synthesize gold nanoparticles have also been reported. A multiplicity of other sulfur ligands such as xanthates, dithiocarbamates, disulfides, di- and trithiols, and resorcinarenes, polythioethers have been used to stabilize and synthesize AuNPs upon reaction with a Au (III) in the presence of a reductant. However, generally these ligands are not used for medical applications (Llevot & Astruc 2012).
1.3.3 GOLD NANOPARTICLES FUNCIONALIZATION
The gold nanoparticle surface represents one of the most stable and easily functionalized platforms for molecular conjugation. Functionalization of nanoparticles is necessary for their stability, functionality, specificity and biocompatibility. The main goal in functionalization is to maintain the properties of the gold nanoparticles and the bound molecules. The molecules should be stable and able to retain their features and gold nanoparticles should be able to retain their unique properties (Delong et al. 2010, Dreaden et al. 2011, 2012).
In the design of biomedical gold nanoparticle conjugates, stability is an important feature because the physiological environments exhibit high ionic and serum concentrations which can disrupt and diminish the stabilizing capacity of many nanoparticle ligands. Thus, electrostatic repulsion alone is often insufficient to prevent particle aggregation. Poly(ethylene glycol) (PEG) is the most common surface ligand used to stabilize biomedical nanoparticles and can be attached to gold surface by a thiol linker. Pegylation not only increases stability and hydrophilicity, but also decreases immunogenic response from the nanoparticles, as well as their recognition by the reticuloendothelial system (RES) by minimizing adsorption of proteins and molecules which initiate phagocytic uptake (Dreaden et al. 2011, 2012).
13
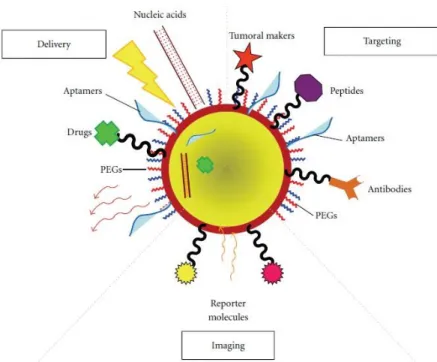
Figure 1.4 – Schematic representation of a multifunctional nanoparticle. These innovative nanoparticles
comprise nucleic acids, aptamers and anti-cancer drugs used for delivery to the target tissue. Tumoral markers, peptides, PEGs and antibodies can be used to improve nanocarrier circulation, effectiveness and selectivity. Reporter molecules attached to the particle surface can be employed as tracking and/or contrast agents (Conde et al. 2012b).
The most common method to attach biomolecules by bioconjugate chemistry is the covalent linkage of amino groups on the biological molecules with carboxyl groups at the free ends of stabilizer molecules (e.g. thiolated PEG) by using 1-ethyl-3-(3-dimethylaminopropyl) carbodiimide HCl-mediated reaction, as shown in Figure 1.5 (Sperling et al. 2008).
Figure 1.5 – EDC coupling reaction scheme. EDC is a zero-length crosslinking agent used to couple
14 The (bio) molecules can also be attached to gold nanoparticles by electrostatic adsorption of negatively charged (bio) molecules to positively charged nanoparticles or vice versa and by non-covalent binding, affinity-based receptor-ligand systems (Sperling & Parak 2010).
1.3.4 GOLD NANOPARTICLES FOR DELIVERY APPLICATIONS
Facing the problems inherent to current cancer treatments, nanotechnology has the potential to revolutionize cancer diagnosis and therapy. Thus, targeting of nanoparticles takes advantage of the inherent size of nanoparticles and the characteristic features of tumor biology, such as enhanced permeability and retention (EPR) effect, that allow nanoparticles to accumulate in the tumor, in conjunction with extracellular acidic pH, hypoxia, angiogenesis (development of a network of new blood vessels) and abnormal lymphatics. As a consequence of the EPR effect, the passive transport of macromolecules leads to their accumulation in tumors at considerably higher concentrations than in normal tissues, mostly 10-100 times higher within 1-2 days (Nazir et al. 2014).
Nanotechnology had the main challenge to provide new cancer nanotherapies through the development of therapeutic nanocarriers that have the potential to provide effective therapies with minimal side effects and high specificity (Peer et al. 2007).
Since nanocarriers encounter numerous barriers in route to their target, it is necessary to combine the rational design of nanocarriers with the fundamental understanding of tumour biology. Therefore, the developed nanocarriers should be capable of circulating in the blood stream undetected by the immune system, exhibit high differential uptake efficiency in the target cells over normal cells, be soluble or colloidal under aqueous conditions for increased effectiveness and have an extended circulating half-life (Peer et al. 2007).
Nanocarriers can offer many advantages over free therapeutic agents. They can protect the therapeutic agent from premature degradation and prematurely interacting with the biological environment, can improve intracellular penetration and control the pharmacokinetic distribution. At last, nanocarriers take advantage of EPR (enhanced permeability and retention) effect which increase absorption of the agent into a selected tissue (Peer et al. 2007).
1.3.4.1 CELLULAR UPTAKE AND TOXICITY OF GOLD NANOPARTICLES
15 which are overexpressed on the surface of cancer cells but that are less present on healthy cells (Sperling et al. 2008).
Understanding the mechanism of gold nanoparticle uptake by cells is important for intracellular drug and gene delivery. Most of the nanoparticle conjugates are capable of exhibiting some degree of intracellular incorporation. To internalize nanoparticles, cells utilize phagocytosis, macropinocytosis and receptor mediated endocytosis (RME) pathways including caveolae-mediated, clathrin-caveolae-mediated, and caveolae/clathrin independent endocytosis. For gold nanoparticles, most of the studies reported nanoparticles with dimensions of less than 100 nm and endocytosis has been proposed as the primary mechanism of cellular internalization. The size of nanoparticles was found to play a critical role in rate and extent of cellular uptake. In the work reported by Chithrani et al, it was found that 50 nm transferrin-coated gold nanoparticles were taken up by mammalian cells at higher rates and extents compared to smaller and larger sizes in the range of 10–100 nm (Chithrani et al. 2006). However the optimal particle size for intracellular uptake depends on the cell size, type, receptor density, metabolic activity, etc., as well as the specific targeting strategy employed. The characteristics of the nanoparticles also influence the cellular uptake, such as size, shape, surface, functionality/charge and aggregation state of nanoparticles (Alkilany & Murphy 2010, Dreaden et al. 2011, 2012).
Once inside the cells, nanoparticles are stored in endosomal/lysosomal vesicular structures. To release nanoparticles from these structures to the cytosol, their surface can be coated with membrane-disruptive peptides or can be modified with peptides which allow for direct transfer across the cell membrane (Sperling et al. 2008).
Regarding the cytotoxicity of gold nanoparticles, this field is somewhat controversial because toxicity may also depend on the cell lines used and the differences observed might perhaps be due to the different nature and properties of the various types of ligands. For example, cationic ligands can cause moderate toxicity due their ability to disrupt cell membranes. Despite the fact that the gold nanoparticle’s core is considered inert and non-toxic, gold nanoparticles solutions
‘‘as a whole’’ can induce toxicity. This toxicity could rise from any part other than the core itself, such as capping agents used in gold nanoparticle synthesis and stabilization, leftover chemicals from the synthesis, ligands, recognition molecules, etc (Boisselier & Astruc 2009, Dreaden et al. 2012).
16 to these results, it was founded that gold nanoparticles less than 2 nm show evidence of chemical reactivity that does not occur at larger sizes (Turner et al. 2008).
The variability of results could be due to the different used toxicity assays, cell lines, and nanoparticles chemical/physical properties. Thus, a systematic toxicity study must be carried out for each specific case under precise conditions, before imaging, diagnosis and therapeutic applications of gold nanoparticles. Despite the importance of starting any toxicological screening using cell models, they do not provide results that can be extrapolated to conclude what the fate of these materials is in vivo. Thus, more in vivo studies are needed (Alkilany & Murphy 2010, Boisselier & Astruc 2009).
1.4 OBJECTIVES
The main goal of this project was to develop a gene delivery vector based on AuNPs to transfect a colorectal cancer cell line with EGFP expression vector and compare the efficiency with a commercial system (Lipofectamine). To achieve this goal various steps were needed:
1) Synthesis of citrate capped AuNP and functionalization with PEG; 2) AuNP@PEG functionalization with quaternary ammonium groups;
3) Binding of AuNP@PEG@R4N+ with EGFP expression vector via electrostatic interactions;
4) Characterization of AuNPs formulations;
17
2. MATERIALS AND METHODS
2.1 NANOTECHNOLOGY
2.1.1 GOLD NANOPARTICLES SYNTHESIS
AuNPs were prepared by the reduction of tetrachloroaurate (HAuCl4) with sodium citrate described by Turkevich (Turkevich et al. 1954) and improved by Lee and Miesel (Lee & Meisel 1982).
Prior to the synthesis of gold nanoparticles, all the glass material was treated with aqua regia (3:1 HCl:HNO3) by immersion overnight. Then the material was washed with distilled water and mili-Q water (18.2 MΩ.cm-1 at 25ºC).
In a 500 mL round bottom flask, 250 ml of 1 mM HAuCl4 (Sigma, MW 393.83 Da) was heated and stirred. When in reflux, 25 ml of 38 mM sodium citrate (Sigma, MW 294.1 Da) was rapidly added and the mixture was kept in reflux for 20 minutes with continuous stirring. The colloidal solution was left to cool to room temperature while keeping the continuous stirring and was then transferred to a 500 mL Erlenmeyer flask and stored in the dark at room temperature.
The AuNPs were characterized by UV/Vis spectroscopy and their concentration was determined by the Lambert–Beer law assuming a calculated molar extinction coefficient for the plasmon resonance band maximum of 2.33x10⁸ M−1cm−1 (Baptista et al. 2005),Transmission Electron Microscopy and Dynamic Light Scattering.
2.1.2 AuNPs FUNCTIONALIZATION WITH PEG CHAINS
AuNPs were coated using a PEG functionalized with a thiol on one terminus and a carboxylated group on the other (SH-EG(8)-COOH, Iris.biotech, MW 458.57 Da). In order to achieve the concentration corresponding to 100% of PEG saturation of AuNP surface, a range of PEG concentrations were tested in a fixed amount of AuNPs.
The synthesis of PEGylated AuNPs was carried out by mixing 10 nM of AuNPs with PEG with a range of concentrations of 0 - 0.1 mg/ml PEG and 0.028% SDS (Sigma, MW 288.38 Da). Then the mixtures were incubated overnight on a GFL 3016 shaker at room temperature. To remove the non-ligated PEG chains, each mixture was centrifuged (Sigma 3-16K, UK) 3 times for 30 minutes at 14000 rpm, at 4ºC. The supernatants of the 3 washes were quantified by Ellman’s
18
The Ellman’s assay was performed on a 96-well plate by mixing 200 μL of the supernatant of the 3 washes with 100 μL of phosphate buffer 0.5 M pH 7 – prepared by mixing 288.55 mM Na2HPO4 (Sigma) with 211.45 mM NaH2PO4 (Sigma) – and 7 μL of DTNB 2 mg/ml in phosphate buffer 0.5 M pH 7. After 10 minutes, the absorbance was measured at 412 nm. The number of bound PEG chains is given by the difference between the amount determined by Ellmans’s
assay and the initial amount incubated with the AuNPs.
The excess of PEG chains in the supernatants is quantified by interpolating a calibration curve set by replacing the supernatant with standard solutions of PEG (0.0002 – 0.5 mg/ml).
In this work, the PEG concentration used to cover the AuNPs surface was 0.035 mg/mL.
2.1.3 AuNPs FUNCTIONALIZATION WITH QUATERNARY AMMONIUM BY EDC/NHS
COUPLING REACTION
AuNP@PEG was functionalized with quaternary ammonium ((2-aminoethyl)trimethylammonium chloride hydrochloride, Sigma, MW 175.1 Da) by EDC (1-Ethyl-3-(3-dimethylaminopropyl)-carbodiimide)/NHS (N-hydroxysulfoxuccinimide) coupling reaction.
For the functionalization, 21 nM AuNP@PEG was mixed with 1.25 mg/ml sulfo-NHS (Sigma, MW 217.13 Da), 10 mM MES pH 5.98 (Sigma, MW 195.24 Da) and 0.312 mg/ml EDC (Sigma, MW 191.7 Da) and incubated on a shaker for 30 min. Excess of reagents was removed by centrifugation for 30 minutes, at 14000 rpm and 4ºC. After this, quaternary ammonium was added to the mixture in a range of concentrations of 0 – 10 mg/ml. The mixture was incubated overnight at room temperature while stirring. The unbound quaternary ammonium was removed by centrifugation 3 times for 30 min, at 14000 rpm and 4º C.
In this work, the quaternary ammonium concentration used to functionalize AuNP@PEG was 7.5 mg/ml (Conde et al. 2012a).
2.1.4 FUNCTIONALIZATION OF AuNP@PEG@R4N+ WITH pEGFP VECTOR
The complex formed between AuNP@PEG@R4N+ and the pEGFP vector (pVisionGFP-N vector 4.7 kb, Biovision – see section A1 in Appendix) is due to the positive charges of the quaternary ammonium groups and the negative charge of the pEGFP vector.
19 EGFP vector).The solutions were incubated at room temperature for 1h. After this time, the unbound vector was removed by centrifugation 1 time for 20 min, at 14000 rpm and 4º C.
The functionalization was assessed by UV/VIS spectroscopy, agarose gel electrophoresis and DLS measurements.
For the transfections studies, the concentration of EGFP expression vector used was 11 ng/L.
2.1.5 DYNAMIC LIGHT SCATTERING MEASUREMENTS
To determine the hydrodynamic diameter of the naked and functionalized AuNPs, a set of DLS measurements was carried out. Thus, AuNPs were prepared in sterile mili-Q water at a final concentration of 2 nM and 1 ml of the sample was used for each measurement. Ten replicate measurements were obtained for each sample and each measurement lasts 30 seconds with a scattering angle of 90º at 25 ºC. DLS analysis was performed in HoribaSZ-100 Nanoparticle Analyzer in Departamento de Química (FCT/UNL).
2.1.6 TEM ANALYSIS
TEM analysis was performed with a HITACHI H-8100 microscope operated at 200 kV in Instituto de Ciência e Engenharia de Materiais e Superfícies (ICEMS/IST), Portugal (contracted service). The samples were prepared by depositing 10 μL of the as-prepared colloidal suspensions in carbon copper grids, washing twice with 10 μL of milli-Q water, and air dried.
Particle size and morphology were determined by analyzing the TEM pictures using the software image J.
2.2 MOLECULAR BIOLOGY
2.2.1 PREPARATION OF COMPETENT E.coli CELLS USING THE CACL2 METHOD
20 Competent cells were aliquoted in 100-150 μl fractions and stored at -80ºC.
2.2.2 E.coli TRANSFORMATION (based on the protocol by Ausubel et al., 1987)
Five microliters (2000 ng) of pEGFP vector were added to 50 l of prepared E.coli competent cells and stored on ice for 50 min. The cells were then submitted to a heat shock at 42ºC for 90 seconds and rapidly transferred to ice during 5 min. Then 900 l of LB medium were added and the cells were incubated for 1 hour at 37ºC, gently inverting the tubes every 10 min. Cells were recovered by centrifugation at 3000 rpm for 5 min and 850 L of the supernatant were removed. Cells were ressuspended in the remaining volume (105 L). After this, 100 μL of the transformed competent cells were cultured on LB agar plates with 30 μg/mL kanamycin (Life Technologies)and then incubated at 37ºC overnight. In the next day, an E.coli single colony of transformed competent cells was inoculated in 10 mL of LB medium supplemented with 30 μg/mL kanamycin and incubated overnight at 37ºC, 180 rpm.
Stock solutions of the transformed cells were prepared by adding 300 μL of glycerol to 700 μL of culture and stored at -80ºC.
2.2.3 E. coli PLASMID EXTRACTION
The plasmid extraction from E. coli was achieved using the alkaline lysis method.
In the day before extraction, 100 L of an E.coli stock of transformed competent cells was inoculated in 10 mL of LB medium supplemented with 30 μg/mL kanamycin and incubated overnight at 37ºC, 180 rpm.
21 to aqueous phase and the plasmid DNA was left to precipitate at- 20ºC for 2h like described above. Plasmid DNA was ressuspended in sterile mili-Q water and stored at 4 ºC.
The plasmid extracted was quantified using the UV-Vis Spectrophotometer Nanodrop ND-1000 (Nanodrop Technologies, USA).
1 Lysis solutions preparation is showing in appendix in section A2
2.3 PCR FOR THE AMPLIFICATION OF THE GENE ENCODING EGFP AND FTO GENE
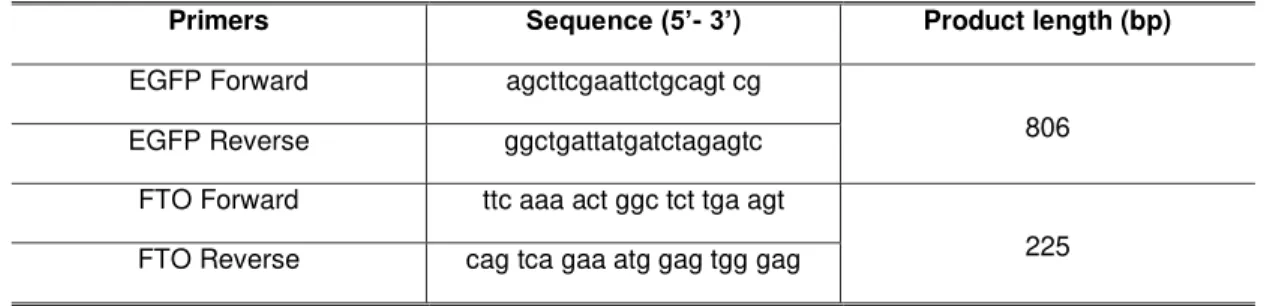
The primers used for PCR to amplify the gene encoding the enhanced green fluorescence protein are shown in Table 2.1, as well as the expected product length determined using the tool “Primer-Blast” (http://www.ncbi.nlm.nih.gov/tools/primer-blast/). The complete reaction program is described in Table 2.2.
The PCR was performed in a MyCycler Thermal Cycler (BioRad, Califórnia, EUA) and the reaction mixture was prepared in a 200 L microtube by adding 1x Taq Buffer (Fermentas, Canada), 1 mM dNTPs (Bioline, United Kingdom), 0.5 M EFGP primer forward (StabVida, Portugal), 0.5 M EFGP primer reverse (StabVida, Portugal), 2 U DreamTaq DNA polymerase (Fermentas, Canada), and sterile mili-Q water to bring the volume to 20 L. The amount of template used was 20 ng.
Table 2.1 – Primers sequence used in PCR reaction to EGFP and FTO gene.
Primers Sequence (5’- 3’) Product length (bp)
EGFP Forward agcttcgaattctgcagt cg
806
EGFP Reverse ggctgattatgatctagagtc
FTO Forward ttc aaa act ggc tct tga agt
225
FTO Reverse cag tca gaa atg gag tgg gag
Table 2.2 – Reaction Program to amplify the gene encoding EGFP.
Temperature (ºC) Time Cycles
Initial Denaturation 95 1 min 1
Denaturation 95 30s
30
Annealing 57.5 30s
Extension 72 1 min
22 FTO gene (housekeeping gene) was used as internal control of transfection studies. PCR for FTO gene was performed by adding in a 200 L microtube 1.5 x Hot Taq Buffer (StabVida, Portugal), 2.5 mM MgCl2 (StabVida, Portugal), 0.2 mM dNTPs (Fermentas, Canada), 0.4 M FTO primer forward (StabVida, Portugal), 0.4 M FTO primer reverse (StabVida, Portugal), 2 U Hot Taq DNA polymerase (StabVida, Portugal) and sterile mili Q water to bring the volume to 25 L. The amount of template used was 20 ng.
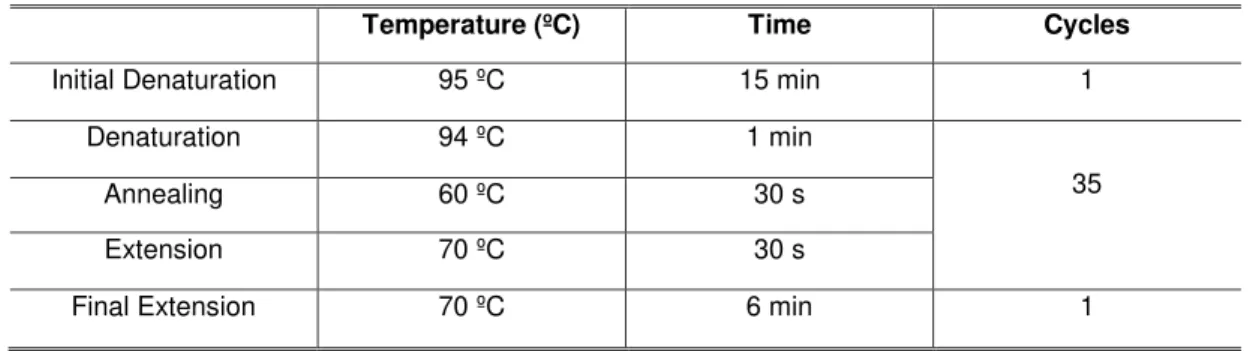
Table 2.3 – Reaction Program to amplify FTO gene.
Temperature (ºC) Time Cycles
Initial Denaturation 95 ºC 15 min 1
Denaturation 94 ºC 1 min
35
Annealing 60 ºC 30 s
Extension 70 ºC 30 s
Final Extension 70 ºC 6 min 1
PCR products were analyzed by 1% agarose gel electrophoresis (1x TAE, 60 V, and 1h 30).
2.4 CELL CULTURE MANIPULATION
HCT-116 cells (from colorectal carcinoma) were grown in Dulbecco's modified Eagle's medium with Glutamax (DMEM, Invitrogen) with 10% heat inactivated fetal bovine serum (FBS, Invitrogen), 100 U/mL penicillin and 100 μg/mL streptomycin (Invitrogen). Cells were maintained in a CO2 incubator with 5% (v/v) CO2, at 37ºC in 99 % humidified atmosphere in 75 cm2 culture flask (VWR).
Cell cultures were transferred to a new cell culture flask upon reaching a confluence of about 80%, which was verified by inverted optical microscopy (Nikon TMS). To this end, all medium was aspirated, cells were washed once with 1x PBS pH 7.4, 2 ml trypsin 1x (Invitrogen) was added and the flask was placed in the CO2 incubator for 5 min. Once all cells were detached from the flask, 8 mL of fresh serum-containing medium was added to neutralize the trypsin action. Fifteen mL of growth medium was placed in a new 75 cm2 culture flask and 500 L of cells were added to the flask. Cells were grown for 18 - 24h in a CO2 incubator prior to any experiment was performed.
2.4.1 DETERMINATION OF CELL CONCENTRATION
For the transfection studies, a certain number of cells are needed. To perform the cell count, 20
23 counted by visualization on an inverted microscope. Trypan blue is a dye that is capable of trespassing the plasma membrane of non-viable cells, since these cells have a more permeable cell membrane. Thus, cells that are viable do not have any coloration whereas non-viable cells are blue. The number of cells per mL is given by the equation (1):
𝑁𝑜. 𝑜𝑓 𝑣𝑖𝑎𝑏𝑙𝑒 𝑐𝑒𝑙𝑙𝑠 𝑚𝐿 =
𝑛𝑜.𝑜𝑓 𝑣𝑖𝑎𝑏𝑙𝑒 𝑐𝑒𝑙𝑙𝑠 𝑜𝑓𝑞𝑢𝑎𝑑𝑟𝑎𝑛𝑡𝑠 1 𝑡𝑜 4
4 𝑥104 x dilution factor (1)
2.5 TRANSFECTIONS STUDIES
2.5.1 EGFP VECTOR TRANSFECTION
In order to study the transfection efficiency of the gold nanoparticles conjugates, transfection experiments were performed in HCT-116 cells.
HCT-116 cells were seeded at a density of 1 x 10⁵cells/well in 24-well plate in 500 L of DMEM, maintained at 37º C in 5% CO2 and grown for 24 h prior to transfection. On the day of transfection, cells were approximately 80% of confluence. Thus, the medium was removed, cells were washed 1 time with 1x PBS pH 7.4 and 400 L of DMEM was added to each well. The complex AuNP@PEG@R4N+@pEGFP functionalized with 11 ng/L was freshly prepared and 100 L of the complex were added to each well, containing 400 L of DMEM, in order to get a final amount of pEGFP vector of 1 g per well.
As a positive control Lipofectamine 2000 (Invitrogen) was used as the transfection reagent, according to manufacturer’s protocol. The lipoplex is formed according to a ratio DNA (µg):Lipofectamine 2000 (µl) of 1:2.
For 24-well plate, 1 μg (5 μL of a stock solution of 200 ng/μL) of EGFP vector was diluted in 45 μL of Opti-MEM reduced serum medium and 2 μL of Lipofectamine 2000 was diluted in 48 μL of the same medium. After 5 min of incubation, EGFP vector solution was added to Lipofectamine 2000 solution, mixed gently, and incubated for another 20 min at room temperature to allow lipoplex formation. After this time, 400 L of DMEM antibiotic free was added to the complex and then added to the cell-containing wells.
24
2.5.2 FLUORESCENCE MICROSCOPY
HCT-116 cells were seeded at a concentration of 1 x 10⁵ cells/well in 24-well plate over glass coverslips in 500 L of DMEM (Invitrogen) with 10% heat-inactivated fetal bovine serum (Invitrogen) and maintained at 37 º C in 5% CO2 (grown for 24 h prior to transfection). The transfection was performed as described in section 2.5.1. EGFP expression was assessed at different incubation times from 3 to 24h.
After each incubation time, cells were washed 1 time with 1x PBS pH 7.4 and fixed with 4% paraformaldehyde in PBS for 15 min. The glass coverslips was washed 3 times with 1x PBS pH 7.4 and mounted in 10 L ProLong Gold Antifade Reagent with DAPI (Invitrogen) to allow for nuclear staining. The glass slides were observed in an Axioplan 2 microscope (Zeiss, Germany).
2.5.3 EGFP EXPRESSION EVALUATION BY FLUORESCENCE SPECTROSCOPY
EGFP expression was evaluated by fluorescence spectroscopy at different incubation times from 3 to 48h. Thus, all medium was removed; cells were washed with 1x PBS (to remove the cell culture medium) and 100 L of sterile mili-Q water was added to each well. The plate was placed on a shaker for 30 min in order to lyse the cells by osmotic shock. After vigorous shaking, the lysate was transferred to 1.5 mL tubes and briefly sonicated and centrifuged at 13 000 g for 25 min at 4ºC.
EGFP fluorescence was determined by placing 70 L of the lysate in a quartz cuvette, and using a Varian Cary Eclipse spectrofluorimeter, in a range 490-650 nm, after excitation at 480 nm.
2.5.4 EVALUATION OF AuNP UPTAKE BY CELLS
In order to confirm the uptake of the nanoconjugate AuNP@PEG@R4N+@pEGFP by cells and confirm the presence of the plasmid inside the cells, a PCR was performed to amplify the gene encoding EGFP.
25 Total DNA was extracted from cells transfected with Lipofectamine 2000 (positive control) and nanoconjugates, and non-transfected cells (negative control) using QIAamp DNA Mini Kit (Qiagen) and quantified using the UV-vis Spectrophotometer Nanodrop ND-1000. The DNA extracted was used to perform the PCR using the primers presented in Table 2.1 and the reaction program described in Table 2.2, presented in section 2.3. As internal control, FTO gene was used and the primers, as well as the reaction program, are described in Tables 2.1 and 2.3 in section 2.3.
2.6 MTS ASSAY
Standard MTS (3-(4,5-dimethylthiazol-2-yl)-5-(3-carboxymethoxyphenyl)-2-(4-sulfophenyl)-2H-tetrazolium) assay was performed to determine the cytotoxicity of the functionalized AuNP complexes compared with the Lipofectamine 2000. When MTS is exposed to PMS, it is converted into formazan by viable cells which are brown. Thus, this colorimetric method is often used to determine the number of viable cells
HCT-116 cells were transfected in 96-well plates as described in section 2.4.1 but using a cell density of 1 x 10⁴cells/well and incubated for 48h. The viability was assessed using Kit CellTiter 96 AQueous Non-Radioactive Cell Proliferation Assay (Promega, Madison, EUA) according to the manufacturer’s protocol. After the incubation time, the culture medium was removed from each well and replaced by 100 L of MTS solution in a ratio of 100:20:1 of DMEM, MTS and PMS, respectively. The plate was incubated for 30 min in a CO2 incubator with 5 % (v/v) CO2, at 37ºC. Then the absorbance at 490 nm was measured in a Microplate reader Infinite M200 (Tecan, Smitzerland) and the cell viability was given by the equation (2):
Cell viability (%) =𝐴𝑏𝑠 490 𝑛𝑚 (𝑠𝑎𝑚𝑝𝑙𝑒)