Adsorption of chromium (VI) ion from aqueous solution by succinylated
mercerized cellulose functionalized with quaternary ammonium groups
Leandro Vinícius Alves Gurgel
a, Júlio César Perin de Melo
c, Jorge Carvalho de Lena
b, Laurent Frédéric Gil
a,* aDepartamento de Química, Instituto de Ciências Exatas e Biológicas, Universidade Federal de Ouro Preto, 35400-000 Ouro Preto, Minas Gerais, BrazilbDepartamento de Geologia, Escola de Minas, Universidade Federal de Ouro Preto, 35400-000 Ouro Preto, Minas Gerais, Brazil cInstituto de Química, Universidade Estadual de Campinas, Caixa Postal 6154, 13084-971 Campinas, São Paulo, Brazil
a r t i c l e
i n f o
Article history:
Received 15 August 2008
Received in revised form 5 December 2008 Accepted 20 January 2009
Available online 17 March 2009
Keywords:
Modified cellulose Triethylenetetramine Anion exchange Chromium (VI) Kinetics
a b s t r a c t
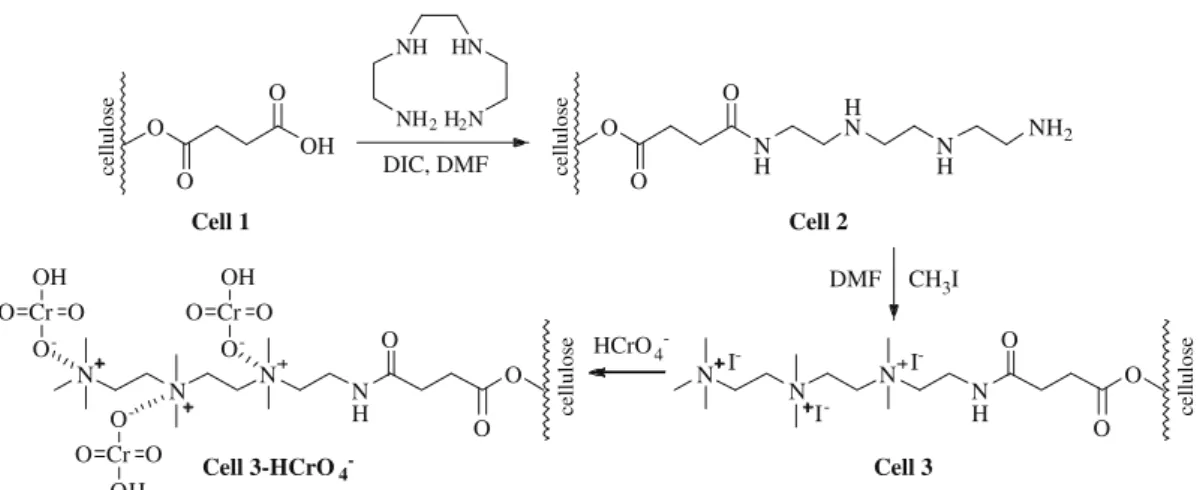
Succinylated mercerized cellulose (cell 1) was used to synthesize an anion exchange resin. Cell 1, contain-ing carboxylic acid groups was reacted with triethylenetetramine to introduce amine functionality to this material to obtain cell 2. Cell 2 was reacted with methyl-iodide to quaternize the amine groups from this material to obtain cell 3. Cells 2 and 3 were characterized by mass percent gain, degree of amination and quaternization, FTIR and CHN. Cells 2 and 3 showed degrees of amination and quaternization of 2.8 and 0.9 mmol/g and nitrogen content of 6.07% and 2.13%, respectively. Cell 3 was used for Cr (VI) adsorption studies. Adsorption equilibrium time and optimum pH for Cr (VI) adsorption were found to be 300 min and 3.1, respectively. The Langmuir isotherm was used to model adsorption equilibrium data. The adsorption capacity of cell 3 was found to be 0.829 mmol/g. Kinetic studies showed that the rate of adsorption of Cr (VI) on cell 3 obeyed a pseudo-second-order kinetic model.
Ó2009 Elsevier Ltd. All rights reserved.
1. Introduction
Removing pollutants from water and wastewater has grown with rapid industrialization. Industries including paint and pig-ment manufacturing, stainless steel production, corrosion control, leather tanning, chrome plating, wood preservation, fertilizers, tex-tiles, and photography often discharge effluents containing hexa-valent chromium, Cr (VI), to surface water (Gode and Pehlivan, 2005). Cr (VI) is toxic and a suspected carcinogenic material and it is quite soluble in aqueous phase almost over the entire pH range and mobile in the natural environment (Kotas´ and Stasicka, 2000; Stasinakis et al., 2003; Gode and Pehlivan, 2005). Cr (VI) forms sev-eral species, the relative proportions of which depend on both pH and total Cr (VI) concentration. Within the normal pH range in nat-ural waters, Cr (VI) exists mainly as CrO2
4 , HCrO4, and Cr2O27.
Among the various chemical treatment techniques available, commonly used in the removal of contaminants from wastewater: ion exchange, adsorption, reduction, and precipitation. In many cases, the environmentally most compatible and cost-effective technique comprises a combination of two or more of these pro-cesses. The main advantages of ion exchange are recovery of metal, selectivity, production of less sludge volume, and compliance with strict discharge specifications. Removal of Cr (VI) from cooling water and groundwater by various adsorbents has been
investi-gated by a number of researchers (Yoshitake et al., 2002; Demirbas et al., 2004; Gupta and Ali, 2004; Spinelli et al., 2004; Gode and Pehlivan, 2005; Karthikeyan et al., 2005; Khezami and Capart, 2005; Oliveira et al., 2005; Torres et al., 2005; Sarin and Pant, 2006; Namasivayam and Sureshkumar, 2008; Kuo and Bembenek, 2008).
Another adsorbent for removal of Cr (VI) from wastewater is activated carbon, which could be produced from various agricul-tural by-products and wastes. However, some of the adsorbents do not have good adsorption capabilities or need long adsorption equilibrium times. Hence, there is a need to search for more effec-tive adsorbents (Namasivayam and Sureshkumar, 2008). One of the new developments in recent years for the removal of anionic Cr (VI) species from water and wastewater is to use surfactant mod-ified adsorbents (Krishna et al., 2000; Li and Bowman, 2001; Bingol et al., 2004).
Cellulose is the most abundant and renewable biopolymer in nature, being considered one of the promising materials economi-cally for the preparation of several types of adsorbents. Cellulose is more expensive than agricultural and agro-industrial by-products as sugarcane bagasse, sawdust, rice hulls, and coconut shells. How-ever, cellulose has much more hydroxyl groups that can be modi-fied than these by-products, which could improve synthesis yield and make its use economically feasible for some applications (Gurgel et al., 2008).
The quaternary ammonium halides have been synthesized and studied byBusi et al. (2005). These studies were based on their
0960-8524/$ - see front matterÓ2009 Elsevier Ltd. All rights reserved. doi:10.1016/j.biortech.2009.01.068
*Corresponding author. Tel.: +55 31 3559 1717; fax: +55 31 3551 1707.
E-mail address:[email protected](L.F. Gil).
Contents lists available atScienceDirect
Bioresource Technology
properties as surfactants and catalysts. There is no data in litera-ture about the synthesis in solid phase of adsorbents materials containing quaternary ammonium groups synthesized through the quaternization of amino-functionalized cellulose applied to oxyanions removal.
This work describes the preparation and evaluation of an anion exchange resin containing quaternary ammonium groups to ad-sorb Cr (VI) ions from an aqueous solution. For the preparation of this resin, cellulose was mercerized with an aqueous NaOH solu-tion and reacted with succinic anhydride to introduce carboxylic acid functions according to the methodology described byGurgel et al. (2008). The introduction of these functions opens the possi-bility for further derivatization as the introduction of amine func-tions (Mallon and Hill, 2002; Karnitz et al., 2007). Succinylated mercerized cellulose (cell 1) was reacted with diisopropylcarbodi-imide and triethylenetetramine to introduce amine groups that can be transformed into quaternary ammonium groups by reaction of amino-functionalized succinylated mercerized cellulose (cell 2) with methyl-iodide to obtain ammonium-functionalized succiny-lated mercerized cellulose (cell 3). The adsorption capacity of chro-mium (VI) by cell 3 was evaluated by the Langmuir model (Ho et al., 2005; Karnitz et al., 2007; Gurgel et al., 2008).
2. Experimental
2.1. Materials
Grade 3 MM cellulose chromatography paper (Cat. No. 3030-861) was purchased from Whatman Company, Maidstone, England. Suc-cinic anhydride, pyridine and methyl-iodide were purchased from VETEC (Brazil). N,N0-dimethylformamide (DMF) was purchased from TEDIA (CAS:68-12-2). 1,3-diisopropylcarbodiimide (DIC) and triethylenetetramine were purchased from Aldrich (Cat. No. D12,540-7 and 112-24-3, respectively). K2Cr2O7 was purchased
from ECIBRA (Brazil). Pyridine was refluxed with NaOH overnight and distilled. Dimethylformamide was treated with 4 Å molecular sieves (MERCK) and soon afterwards distilled under reduced pressure.
2.2. Synthesis of cellulose 2 (cell 2)
Succinylated mercerized cellulose (cell 1) was prepared and characterized according to the methodology described byGurgel et al. (2008). Cell 1 (3.0 g, 7.2 mmol/g of carboxylic acid functions) was reacted with 10.2 mL (64.8 mmol) of 1,3-diisopropylcarbodi-imide (DIC) in anhydrous dimethylformamide (DMF) (51 mL) at 25oC for 1 h under constant magnetic stirring. Soon afterwards
16.1 mL (108 mmol) of triethylenetetramine was added to reac-tional media and the material was reacted for more 3 h in order to obtain cellulose 2 (cell 2). Cell 2 was separated by filtration in sintered filter, washed with DMF, ethanol 95%, distilled water, sat-urated sodium bicarbonate solution, distilled water, ethanol 95% and then with diethyl ether. After drying under vacuum, cell 2 was stored in a desiccator overnight and the mass percent gain (mpg) was calculated.
2.3. Synthesis of cellulose 3 (cell 3)
Cell 2 (3.0 g, 2.8 mmol/g of amine functions) was reacted with 5.2 mL (84 mmol) of methyl-iodide and 2.1 g (21 mmol) of anhy-drous sodium carbonate in anhyanhy-drous dimethylformamide (DMF) (51 mL) at 50oC for 24 h under constant magnetic stirring in order
to obtain cellulose 3 (cell 3). Cell 3 was separated by filtration in sintered filter, washed with DMF, distilled water and then with diethyl ether. After drying under vacuum, cell 3 was stored in a
desiccator overnight and the mass percent gain (mpg) was calculated.
2.4. Characterization of celluloses 2 and 3
2.4.1. Mass percent gain
The mass percent gain (mpg) was calculated according to Eq.
(1):
mpgð%Þ ¼ mmodmunmod
munmod
100; ð1Þ
where mmod is the mass of modified material and munmod is the
mass of unmodified material.
2.4.2. Degree of amination
The degree of amination of cellulose 2 was determined by mea-suring the quantity of introduced basic function. The concentration of amine functions per gram of modified cellulose 2 was deter-mined by retro-titration. For this, 0.1000 g of cell 2 was treated with 100.0 mL of an aqueous HCl solution (0.01 mol/L) in a 250-mL Erlenmeyer for 1 h under constant stirring. Soon after the material was separated by single filtration and three aliquots (25.0 mL) of each obtained solution were titrated with aqueous NaOH solution (0.01 mol/L) (Karnitz et al., 2007). The concentra-tion of amine funcconcentra-tions was calculated by:
CNH;NH2¼
ðCHClVHClÞ ð4CNaOHVNaOHÞ
mcell 2
; ð2Þ
whereCHClis the concentration of HCl solution (mmol/L),CNaOHis
the concentration of NaOH solution (mmol/L),VHClis the volume
of HCl solution (L),VNaOHis the volume of NaOH spent in the
titra-tion of non-reacted acid’s excess (L) andmcell 2is the cellulose 2
mass (g).
2.4.3. Degree of quaternization
The degree of quaternization of the cellulose 3 was determined by measuring the quantity of iodide ions. The concentration of ammonium groups per gram of modified cellulose 3 was deter-mined by conductimetric titration. For this, 0.1000 g of cell 3 was suspended in a 250-mL Erlenmeyer containing 100.0 mL of bidis-tilled water and titrated with aqueous standard AgNO3 solution
(0.1 mol/L). This procedure was accomplished in triplicate (Spinelli et al., 2004). The concentration of ammonium groups was calcu-lated by:
C NþH3¼
ðCAgNO3VAgNO3Þ
mcell 3 ; ð3Þ
where CAgNO3 is the concentration of AgNO3 solution (mmol/L),
VAgNO3is the volume of AgNO3solution (L) andmcell 3is the mass
of cellulose 3 (g).
2.4.4. FTIR analysis
Samples were prepared mixing 1 mg of material with 100 mg of spectroscopy grade KBr. The FTIR spectra were recorded using Nicolet Impact 410 equipment with detector at 4 cm1resolution
from 500 to 4000 cm1and 32 scans per sample.
2.4.5. Elemental analysis
The samples were previously dried and analyzed with a CHNS/O Perkin Elmer Series II equipment.
2.4.6. Scanning electron microscopy and energy dispersive X-ray (SEM/EDX)
X-ray (SEM/EDX) model JEOL JSM-5510 equipments. The sample was pressed to make its surface perfectly flat and metallized with graphite using an evaporate-to-vacuum equipment model JEE-4C to make the surface conductive. The analysis was made using po-tential difference of 20 kV for the tungsten filament.
2.5. Kinetic study of Cr (VI) adsorption
Experiments with cell 3 and Cr (VI) ion were performed to determine the adsorption equilibrium time. The time intervals used were: 10, 20, 30, 45, 60, 120, 180, 240, 300 and 1440 min, respectively. Masses of 50 mg of cell 3 were placed in a 250-mL Erlenmeyer with 50.0 mL of Cr (VI) ion solution at 1.92 mmol/L. The adsorption experiments were made under constant mechanic stirring at 25°C. The pH of Cr (VI) solution with cell 3 was found
to be 3. There were not significant pH variations at the end of each experiment.
After single filtration, the concentration of Cr (VI) ion was deter-mined by atomic absorption spectroscopy (Varian Spectra AA475).
2.6. Effect of pH on Cr (VI) adsorption
A study on the pH dependency of Cr (VI) adsorption by cell 3 was carried out. The range of pH used was 1.0–10.0. Masses of 50 mg of cell 3 were placed in a 250-mL Erlenmeyer with 50.0 mL of Cr (VI) ion solution at 1.92 mmol/L. The adsorption experiments were made under constant mechanic stirring at 25°C and the pHs of solutions were adjusted with an aqueous
HCl and NaOH solution at 0.01–1.0 mol/L. The reaction time used was obtained from the kinetic study. Significant pH varia-tions were observed during each experiment, but pH values were kept constant by adjusting it with NaOH solution (0.01– 0.1 mol/L).
2.7. Adsorption isotherm of Cr (VI)
Experiments with cell 3 and Cr (VI) ion were performed to determine the adsorption equilibrium isotherm. Masses of 50 mg of cell 3 were placed in a 250-mL Erlenmeyer with 50.0 mL of Cr (VI) ion solution at specific concentrations from 0.67 to 1.64 mmol/L. Each experiment was performed at pH 3.1, optimum pH for Cr (VI) ion adsorption obtained from pH study and a period of 300 min was adopted. Significant pH variations were observed during each experiment, but pH values were kept constant by adjusting it with NaOH solution (0.01–0.1 mol/L).
3. Results and discussion
3.1. Characterization of cells 2 and 3
Fig. 1illustrates the synthesis route used to prepare cells 2 and 3 and adsorption mechanism of HCrO
4 on cell 3. According to the
Cr (VI) speciation diagram (Leyva-Ramos et al., 1994), the predom-inant Cr (VI) species in an aqueous solution at pH 3.1 is HCrO
4. The
results of mass percent gains, concentration of amine and ammo-nium functions and percentage of nitrogen are presented inTable 1.
The carboxylic acid functions introduced in cell 1 were used to anchor the triethylenetramine to cellulosic matrix. Cell 2 was ob-tained with a mass percent gain of 33.6%, amination degree of 2.8 mmol/g and nitrogen content of 6.07%. These results show that the utilization of succinylated mercerized cellulose (cell 1) is an excellent alternative to prepare chelating materials containing amine ligands.
In the synthesis of cell 2, the formation of crosslinking was ob-served as mentioned by Navarro et al. (1999), decreasing the amount of immobilized triethylenetramine. Various studies were performed in our laboratory to reduce the formation of crosslink-ing. It was concluded through our studies that the use of an excess amount of triethylenetramine is one of the possible ways to reduce the formation of crosslinking.
The amine functions anchored to cell 2 were used to synthesize a new chelating material containing ammonium quaternary groups capable of adsorbing oxyanions through anion exchange (cell 3). Cell 3 was obtained with a mass percent gain of 144.6%, quatern-ization degree of 0.9 mmol/g and nitrogen content of 2.13%. These results showed the success of the synthesis methodology applied in this work.
3.1.1. FTIR characterization
The characterization of the cells 2 and 3 was accomplished by FTIR spectroscopy. The FTIR spectra of cell 1-cell 2 and cell 2-cell 3 are presented inFigs. 2 and 3, respectively.
As depicted inFig. 2, the most relevant change observed in the FTIR spectra of cell 2 in relation to cell 1 is the appearance of bands at 1699, 1647, 1635, 1576, 1410, 1259, 1159 and 1055 cm1. The
bands at 1699 and 1647 cm1correspond to stretching of carbonyl
group (C@O) of primary amide (amide I). The band at 1635 cm1
corresponds to deformation vibration of –NHxin plane. The band
at 1576 cm1 corresponds to deformation vibration of groups
–NH– of amines. The bands at 1410, 1259 and 1159 cm1
O
O
OH O
Cell 1
cellulose
HN
H2N
NH
NH2
DIC, DMF
O
O
N H O
cellulose
H N
N H
NH2
Cell 2
O
O N
H O
cellulose
N N
N I
-I -I
-Cell 3
CH3I DMF
Cr
O
-O O
O
O N
H O
cellulose
N N N
Cell 3-HCrO4
-Cr
O
-O O
Cr O
-O O
HCrO4 -OH
OH
OH
Fig. 1.Synthesis route used to prepare cells 2 and 3, and adsorption mechanism of HCrO
correspond to deformation vibration of C–N and the band at 1055 cm1corresponds to asymmetric stretching of C–N–C.
As depicted inFig. 3, the most relevant change observed in the FTIR spectra of cell 3 in relation to cell 2 is the appearance of bands at 1576, 1508, 1489, 1458 and 1375 cm1. The bands at 1576 and
1508 cm1correspond to asymmetric and symmetric deformation
of –N+(CH
3)3. The bands marked in blue are present in FTIR spectra
of tetramethylammonium iodide and also in cell 3 which has dimethyl and trimethylammonium groups. Therefore, the bands at 1489 and 1458 cm1correspond to symmetric deformation of
–CH3.
3.2. Adsorption of Cr (VI) onto cell 3
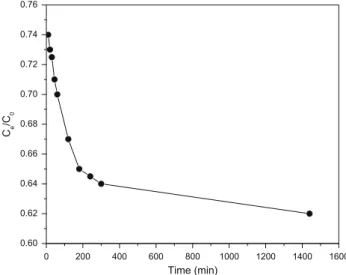
3.2.1. Effect of contact time
The effect of contact time on the adsorption of Cr (VI) on cell 3 for fixed initial Cr (VI) concentration (1.92 mmol/L) at pH 3 and 25°C is shown in Fig. 4. The adsorption equilibrium of Cr (VI)
was attained in 300 min.CeandC0are the equilibrium and initial
metal ion concentrations (mmol/L), respectively. There was not significant change in equilibrium concentration after 300 min up to 1440 min within detection limit of the atomic absorption equip-ment used.
3.2.2. Effect of pH
The effect of pH on the adsorption of Cr (VI) at a fixed initial Cr (VI) concentration (1.92 mmol/L) at 25°C is shown inFig. 5. In
aqueous solutions, Cr (VI) exists in the form of chromic acid (H2CrO4) and in the form of dichromate (Cr2O27). In this process,
the anion is not a simple monovalent anion but rather a series of chromate anions depending upon the pH and concentration of the solution. The chromate may be represented in various forms such as H2CrO4, HCrO4, CrO
2
4 , HCr2O7, and Cr2O27in the solution
phase as a function of pH and concentration. At pH 1, chromium ions exist in the form of HCrO
4, while in the pH range 2–6 different Table 1
Type of material, mass gain percent, concentration of amine and ammonium functions and percentage of nitrogen.
Material Mpg (%) CNH—NH2(mmol/g) Cþ—NH3(mmol/g) N (%)
Cell 2 33.6 2.8 ± 0.0 – 6.07 ± 0.01 Cell 3 144.6 – 0.9 ± 0.1 2.13 ± 0.01
4000 3500 3000 2500 2000 1500 1000 500
50 55 60 65 70 75 80 85
45 50 55 60 65 70 75 80 85
Transmittance (%)
Wavenumber (cm-1 ) Cell 1
1055
1159 1635
1259
1410 1647 1699 1743
1576
Cell 2
Fig. 2.FTIR spectra of cell 1 and cell 2.
4000 3500 3000 2500 2000 1500 1000 500
45 50 55 60 65 70 75 80
45 50 55 60 65 70 75
Transmittance (%)
Wavenumber (cm-1) Cell 2
1701
1489
1458
1541
1375
1743 1653 1576
1508
Cell 3
Fig. 3.FTIR spectra of the cell 2 and cell 3.
0 200 400 600 800 1000 1200 1400 1600
0.60 0.62 0.64 0.66 0.68 0.70 0.72 0.74 0.76
Ce
/C
0
Time (min)
Fig. 4.Effect of contact time on the adsorption of Cr (VI) ion onto cell 3.
0 1 2 3 4 5 6 7 8 9 10 11
0.2 0.3 0.4 0.5 0.6 0.7 0.8
Qmax
(mmol/g)
pH
Fig. 5.Effect of pH on the adsorption of Cr (VI) onto cell 3.
forms of chromium ions such as HCrO
4, CrO24and Cr2O27coexist,
being HCrO
4 predominant. As the pH increases, this form shifts to
CrO2
4 and Cr2O27. At pH greater than 7.5, CrO24is the only
chro-mate species in aqueous phase (Mallick et al, 2006). The existing balance among different ionic species of chromium is as follows:
H2CrO4HþþHCrO4;
HCrO
4HþþCrO24;
2HCrO
4Cr2O27þH2O:
The charges of the ammonium groups of cell 3 are not pH-depen-dent, i.e., they come from positively charged nitrogen atoms joined by single bonds to methyl groups as can be seen inFig. 1. Besides, iodide ions are bonded to ammonium groups through electrostatic interactions and the Cr (VI) adsorption on cell 3 could be based on ion-exchange process in which Cr (VI) ions are adsorbed while io-dide ions are released to the solution (Fig. 1). Therefore, amount of positive charges on cell 3 is fixed, and then quantity of Cr (VI) ad-sorbed is only dependent on the forms of chromium species present in solution.
The maximum adsorption capacity (Qmax) of Cr (VI) ions was
ob-tained at pH 3.1 while the adsorption decreased when the pH in-creased, as can be observed in Fig. 5. At pH 3.1, the specie of
chromium that predominates is HCrO
4 (Leyva-Ramos et al.,
1994; Yusof and Malek, 2008). As described above, at lower pH, the Cr (VI) species are mostly univalent forms (HCrO
4) and thus
this specie requires only one exchange site. At pH greater than 3.5, the adsorption of chromium decreased due to an increase in the concentration of divalent chromium species as CrO2
4 and
Cr2O27 that require two exchange sites to occur the adsorption.
At pH greater than 7.0, OHions concentration is higher and these ions could be adsorbed by cell 3. At the pH range of 6.5–10, the adsorption decreased significantly. According toYusof and Malek (2008), this behavior might be explained considering the lower affinity of the exchange sites for Cr (VI) sorption at pH 10 and thus the adsorption capacity may then be influenced by the strong com-petition of OHwith Ior CrO2
4 for the sorption sites since more
OHions are present at high pH.Li (2004) and Yusof and Malek
(2008)also found similar observations.
3.2.3. Adsorption kinetics
The kinetics of adsorption describes the adsorption rate of chro-mium ions onto the cell 3 and this rate controls the equilibrium time. These models are important in water treatment process pro-jects. The kinetics of adsorption of Cr (VI) onto cell 3 was analyzed by pseudo-first-order and pseudo-second-order mechanism 25°C
temperature.
3.2.3.1. Pseudo-first-order model. The adsorption kinetics data of Cr (VI) were analyzed using the Lagergren rate equation (Lagergren, 1898). The linearized form of the pseudo-first-order equation (Ho and Mckay, 1998) is illustrated by:
logðqeqtÞ ¼logqe k01
2:303
t; ð4Þ
whereqe andqtare the amounts of Cr (VI) adsorbed (mmol/g) at
equilibrium and at timet(min), respectively, andk0
1is the Lagergren
rate constant of first-order adsorption time (min1). Values ofq
e
and k01 were calculated from the slope and intercept of plot of
log(qeqt) versust(figure not shown). As can be seen inTable 2,
theR2value of the pseudo-first-order model was found to be lower than pseudo-second-order model. Based on these results it can be concluded that the adsorption of Cr (VI) on cell 3 did not fit a pseu-do-first-order kinetic model. Moreover, fromTable 2, it can be seen that the experimental value ofqe,expis not in good agreement with
the theoretical value calculated (qe1,cal) from Eq.(4). Therefore, this
suggests that the pseudo-first-order model was not suitable for modeling the adsorption of Cr (VI) on cell 3. Experimental data were also tested by the pseudo-second-order kinetic model, which is described by Eq.(5).
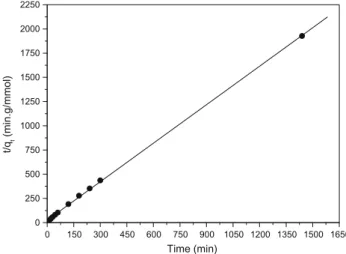
3.2.3.2. Pseudo-second-order model.A pseudo-second-order model can be used to describe the sorption kinetics. The linearized form of the pseudo-second-order equation (Ho and Mckay, 1998) is illustrated by:
t qt
¼ 1
k02q2 e
þq1
e
t; ð5Þ
whereqe (mmol/g) and qt (mmol/g) are the solute amounts
ad-sorbed per unit mass of adsorbent at equilibrium time,tis the time (min) andk02is the pseudo-second-order rate constant (g mmol1
min1). The equilibrium constants of pseudo-second-order model,
k0
2andqecan be obtained by plottingt/qtversust(Fig. 6).
This model is more likely to predict kinetic behavior of adsorp-tion of Cr (VI) on cell 3. The linear plot oft/qt versus t (Fig. 6)
showedR2value greater than 0.999 as can be seen inTable 2. In addition, the theoreticalqe2,calvalue is closer to the experimental
qe,expvalue. Considering these results, it can be said that
pseudo-second-order kinetic model provided a good correlation for adsorp-tion of Cr (VI) on cell 3 in contrast to pseudo-first-order model. A similar result was observed in the adsorption of Cr (VI) onto qua-ternary chitosan salt (Spinelli et al., 2004).
3.2.4. Adsorption isotherm
Factors influencing the adsorption rate are mainly, among oth-ers, the nature and concentration of competing ions, pH, resin amount, shaking speed and temperature (Gode and Pehlivan, 2005). According to Gode and Pehlivan (2005), three individual composition variables (nature of polymer matrix, basicity and ste-ric property of the exchanger’s functional group) were found to have significant impact on chromium sorption.
Adsorption isotherms describe how adsorbates interact with adsorbents and are important in optimizing the use of the latter. The widely used Langmuir isotherm (Langmuir, 1918) has found successful application in many real adsorption processes and its linearized form is expressed by:
Ce qe
¼ 1
Qmaxbþ Ce Qmax
; ð6Þ
where qe (mmol/g) is the equilibrium adsorption capacity, Qmax
(mmol/g) is the maximum amount of metal ion per weight unit of cell 3 to form a complete monolayer coverage on the surface bound at high equilibrium metal ion concentrationCe(mmol/L) andb(L/
mmol) is the Langmuir constant related to the affinity of binding sites. Qmax represents the practical limiting adsorption capacity
when the surface is fully covered with metal ions, assisting in the
Table 2
Comparison of pseudo-first-order and pseudo-second-order adsorption rate constant and calculated and experimentalqevalues for Cr (VI) adsorption.
Parameter Pseudo-first-order kinetic model Pseudo-second-order kinetic model
qe,exp(mmol/g) k01(min1) qe1,cal(mmol/g) R2 k02(g/mmol min) qe2,cal(mmol/g) R2
0.829 2.67101 0.248 0.9834 7.20
comparison of adsorption performance, and bindicates the bond energy of the adsorption reaction between metal and material.
A linearized plot ofCe/qeversusCewas obtained from the model
and is shown inFig. 7.Qmaxandbwere computed from the slope
and intercept of straight line.Table 3lists the results calculated. The high correlation coefficient obtained by the Langmuir mod-el indicated that it described the adsorption of Cr (VI) by cmod-ell 3 very well.
As shown inTable 3, cell 3 presented a maximum adsorption capacity (Qmax) of 0.829 mmol/g and bond energy (b) in relation
to chromium species of 18.0 L/mmol. ThisQmaxfor Cr (VI)
adsorp-tion by cell 3 was smaller than activated carbon prepared from agricultural wastes such as cornelian cherry (CC), apricot stone (AS), and almond shell (ASC) (Demirbas et al., 2004) that adsorbed 1.142, 1.132, and 1.147 mmol/g of Cr (VI), respectively (pH 1 and adsorption equilibrium at 72 h) and much higher than impreg-nated Fe or Al oxide-shavings (Kuo and Bembenek, 2008) that ad-sorbed 0.0194 and 0.0186 mmol/g (pH 6 and adsorption equilibrium at 4 h). In contrast, the rate constant k0
2 for cell 3
(0.072 g/mmol min) was smaller than impregnated Fe or Al oxide-shavings (Kuo and Bembenek, 2008), which was equal to 2.95 and 3.77 g/mmol min and (CC), (AS), and (ASC) (Demirbas et al., 2004), whose rate constant k02 ranged from 0.0260 to
3.026 g/mmol min, depending on type of activated carbon and ini-tial concentration of Cr (VI) used.
Compared to CC, AS, ASC, and impregnated Fe or Al oxide-shav-ings, cell 3 was the most expensive material to be prepared by con-sidering the biopolymer matrix, reagents and preparation techniques used. Therefore, the preparation cost of cell 3 is a disad-vantage in relation to the compared materials, however cell 3 showed a good adsorption capacity as discussed previously and this could be an advantage of this material.
An advantage of impregnated Fe or Al oxide-shavings demon-strated byKuo and Bembenek (2008)was the rapid desorption rate of sorbed Cr (VI). However, after nine weeks of contact, more than 50% of sorbed Cr on Fe oxide-shavings was transformed into stable form not extractable by 0.1 mol/L NaOH and 1 mol/L HNO3. This
transformation did not happen to Al oxide-shavings system. On the other hand, cell 3 was resistant to acid and basic pHs and this could make possible successive desorption processes to re-cover sorbed Cr (VI) without significant loss of adsorption capacity.
3.3. Scanning electron microscopy (SEM/EDX)
Cell 3 surface was analyzed by SEM/EDX after adsorption stud-ies of Cr (VI).Fig. 8 shows cell 3 map containing adsorbed chro-mium (VI). As can be observed from cell 3 map, the adsorbed Cr (VI) appeared to be uniformly distributed onto the surface indicat-0 150 300 450 600 750 900 1050 1200 1350 1500 1650
0 250 500 750 1000 1250 1500 1750 2000 2250
t/q
t
(min.g/mmol)
Time (min)
Fig. 6.Pseudo-second-order kinetic plot for the adsorption of Cr (VI) onto cell 3.
0.0 0.1 0.2 0.3 0.4 0.5 0.6 0.7 0.8
0.0 0.1 0.2 0.3 0.4 0.5 0.6 0.7 0.8 0.9 1.0
Ce /qe
(g/L)
Ce (mmol/L)
Fig. 7.Langmuir plot for the adsorption of Cr (VI) onto cell 3.
Table 3
Langmuir parameters for Cr (VI) adsorption onto cell 3.
Qmax(mmol/g) b(L/mmol) R2
0.829 18.0 0.9985
Fig. 8.Scanning electron micrograph of cell 3-Cr (VI) sample.
ing that the adsorption sites were uniformly distributed and that chemical modification occurred in all extension of material.
4. Conclusions
Cell 2, containing ligands groups amine was synthesized with success through the reaction between succinylated mercerized cel-lulose (cell 1) and triethylenetetramine, a polydentate ligand. Cell 2 was obtained with a mass percent gain of 33.6%, a concentration of ammonium function of 2.8 mmol/g and nitrogen content of 6.07%. Cell 3, a surfactant containing ammonium groups, was syn-thesized by reaction of cell 2 with methyl-iodide, an alkylating agent. Cell 3 was obtained with a mass percent gain of 144.6%, a concentration of ammonium function of 0.9 mmol/g and nitrogen content of 2.13%.
The removal of chromium ions from aqueous solution by cell 3 was found to be effective. Equilibrium adsorption time was found to be 300 min and optimum pH for chromium removal was found to be 3.1. Equilibrium adsorption data fitted to the Langmuir model very well, the adsorption maximum capacity of Cr (VI) was found to be 0.829 mmol/g and the Langmuir constant related to the affin-ity of binding sites by Cr (VI) species was found to be 18.0 L/mmol. The adsorption process of Cr (VI) on cell 3 followed the pseudo-sec-ond-order kinetic model and the adsorption rate was found to be 7.2102g/mmol min.
Acknowledgements
The authors are grateful to UFOP - Universidade Federal de Ouro Preto, FAPEMIG – Fundação de Amparo à Pesquisa do Estado de Minas Gerais and CAPES – Coordenação de Aperfeiçoamento de Pessoal de Nível Superior.
References
Bingol, A., Ucun, H., Bayhan, Y.K., Karagunduz, A., Cakici, A., Keskinler, B., 2004. Removal of chromate anions from aqueous stream by a cationic surfactant-modified yeast. Bioresour. Technol. 94 (3), 245–249.
Busi, S., Lahtinen, M., Mansikkamäki, H., Valkonen, J., Rissanen, K., 2005. Synthesis, characterization and thermal properties of small R2R02N+Xtype quaternary
ammonium halides. J. Solid State Chem. 178 (6), 1722–1737.
Demirbas, E., Kobya, M., Senturk, E., Ozkan, T., 2004. Adsorption kinetics for removal of chromium(VI) from aqueous solutions on the activated carbons prepared from agricultural wastes. Water SA 30 (4), 533–539.
Gode, F., Pehlivan, E., 2005. Removal of Cr(VI) from aqueous solution by two Lewatit-anion exchange resins. J. Hazard. Mater. 119 (1–3), 175–182. Gupta, V.K., Ali, I., 2004. Removal of lead and chromium from wastewater using
bagasse fly ash-a sugar industry waste. J. Colloid Interf. Sci. 271 (2), 321–328. Gurgel, L.V.A., Karnitz Jr., O., Gil, R.P.F., Gil, L.F., 2008. Adsorption of Cu(II), Cd(II), and
Pb(II) from aqueous single metal solutions by cellulose and mercerized cellulose chemically modified with succinic anhydride. Bioresour. Technol. 99 (8), 3077–3083.
Ho, Y.S., Mckay, G., 1998. Kinetic models for the sorption of dye from aqueous solution by wood. Process Saf. Environ. Prot. 76 (B2), 183–191.
Ho, Y.S., Chiu, W.T., Wang, C.C., 2005. Regression analysis for the sorption isotherms of basic dyes on sugarcane dust. Bioresour. Technol. 96 (11), 1285–1291. Karnitz Jr., O., Gurgel, L.V.A., Perin de Melo, J.C., Botaro, V.R., Melo, T.M.S., Gil, R.P.F.,
Gil, L.F., 2007. Adsorption of heavy metal ion from aqueous solution single metal solution by chemically modified sugarcane bagasse. Bioresour. Technol. 98 (6), 1291–1297.
Karthikeyan, T., Rajgopal, S., Miranda, L.R., 2005. Chromium(VI) adsorption from aqueous solution byHevea Brasilinesissawdust activated carbon. J. Hazard. Mater. 124 (1–3), 192–199.
Khezami, L., Capart, R., 2005. Removal of chromium(VI) from aqueous solutions by activated carbons: kinetic and equilibrium studies. J. Hazard. Mater. 123 (1–3), 223–231.
Kotas´, J., Stasicka, Z., 2000. Chromium occurrence in the environment and methods of its speciation. Environ. Pollut. 107 (3), 263–283.
Krishna, B.S., Murthy, D.S.R., Jaiprakash, B.S., 2000. Thermodynamics of chromium(VI) anionic species sorption onto surfactant-modified montmorillonite. J. Colloid Interf. Sci. 229 (1), 230–236.
Kuo, S., Bembenek, R., 2008. Sorption and desorption of chromate by wood shavings impregnated with iron or aluminum oxide. Bioresour. Technol. 99, 5617–5625. Lagergren, S., 1898. Zur theorie der sogenannten adsorption geloester stoffe.
Kungliga Svenska Vetenskapsa. Handl. 24, 1–39.
Langmuir, I., 1918. Adsorption of gases on plain surfaces of glass, mica and platinum. J. Am. Chem. Soc. 40, 1361–1403.
Leyva-Ramos, R., Juarez-Martinez, A., Guerrero-Coronado, R.M., 1994. Adsorption of chromium(VI) from aqueous solutions on activated carbon. Water Sci. Technol. 30 (9), 191–197.
Li, Z., 2004. Influence of solution pH and ionic strength on chromate uptake by surfactant-modified zeolite. J. Environ. Eng. 130, 205–208.
Li, Z., Bowman, R.S., 2001. Retention of inorganic oxyanions by organo-kaolinite. Water Res. 35 (16), 445–451.
Mallick, S., Dash, S.S., Parida, K.M., 2006. Adsorption of hexavalent chromium on manganese nodule leached residue obtained from NH3–SO2leaching. J. Colloid
Interf. Sci. 297 (2), 419–425.
Mallon, S., Hill, C.A.S., 2002. Covalent bonding of wood through chemical activation. Int. J. Adhes. Adhes. 22 (6), 465–469.
Namasivayam, C., Sureshkumar, M.V., 2008. Removal of chromium(VI) from water and wastewater using surfactant modified coconut coir pith as a biosorbent. Bioresour. Technol. 99 (7), 2218–2225.
Navarro, R.R., Sumi, K., Matsumura, M., 1999. Improved metal affinity of chelating adsorbents through graft polymerization. Water Res. 33 (9), 2037–2044. Oliveira, E.A., Montanher, S.F., Andrade, A.D., Nóbrega, J.A., Rollemberg, M.C., 2005.
Equilibrium studies for the sorption of chromium and nickel from aqueous solutions using raw rice bran. Process Biochem. 40 (11), 3485–3490. Sarin, V., Pant, K.K., 2006. Removal of chromium from industrial waste by using
eucalyptus bark. Bioresour. Technol. 97 (1), 15–20.
Spinelli, V.A., Laranjeira, M.C.M., Fávere, V.T., 2004. Preparation and characterization of quaternary chitosan salt: adsorption equilibrium of chromium(VI) íon. React. Funct. Polym. 61 (3), 347–352.
Stasinakis, A.S., Thomaidis, N.S., Lekkas, T.D., 2003. Speciation of chromium in wastewater and sludge by extraction with liquid anion exchanger Amberlite LA-2 and electrothermal atomic absorption spectrometry. Anal. Chim. Acta 478 (1), 119–127.
Torres, J.D., Faria, E.A., Prado, A.G.S., 2005. Thermodynamic studies of the interaction at the solid/liquid interface between metal ions and cellulose modified with ethylenediamine. J. Hazard. Mater. 129 (1–3), 239–243.
Yoshitake, H., Yokoi, T., Tatsumi, T., 2002. Adsorption of chromate and arsenate by amino-functionalized MCM-41 and SBA-1. Chem. Mater. 14 (11), 4603–4610. Yusof, A. M., Malek, N.A.N.N., 2008. Removal of Cr(VI) and As (V) from aqueous
solutions by HDTMA-modified zeolite Y. J. Hazard. Mater. doi:10.1016/ j.jhazmat.2008.05.134.