Outubro , 2016
Rúben Ro drigues Ferreira
Licenciado em Química Aplicada
Flavylium-Func tio nalized Carbo n Quantum Do ts
Disse rtação para o btenção do Grau de Mestre em Química Bioo rgânica
Orientado r: Jo rge Parola, Profe ssor Asso ciado, LAQV-REQUIMTE-FCT/UNL
Co -o rie ntado r: César Laia, Inve stigado r Auxiliar, LAQV-REQUIMTE-FCT/UNL
Júri:
Presidente : Professora Doutora Paula Cristina de Sério
Branco
Argue ntes: Professor Doutor José Ricardo Ramos Franco
Tavares
2
Flavylium-Functionalized Carbon Quantum Dots
Copyright © Rúben Rodrigues Ferreira, Faculdade de Ciências e Tecnologia, Universidade Nova de Lisboa.
3
“The real
friendship is like fluorescence,
5
Agradecimentos
Gostaria de começar por agradecer aos meus orientadores, César Laia e Jorge Parola, pela orientação dada durante o decorrer desta tese de mestrado, bem como durante o meu projeto de licenciatura e projetos de Química Física. Já são 4 anos a aturar-me, a acreditar em mim e a ensinar-me.
Queria também agradecer ao grupo de fotoquímica, pela amabilidade com que me receberam e o apoio que me deram sempre que precisei.
Aos meus pais, pelo suporte financeiro que me permitiu ter esta formação académica.
Aos meus amigos/colegas que estiveram comigo nos bons e maus momentos, com os quais tive a oportunidade de trocar conhecimentos e crescer como pessoa.
6
Abstract
The goal of this master thesis was the functionalization of carbon quantum dots (CQDs) with flavylium salts. CQDs were synthesized through the hydro-thermal method using citric acid as a carbon precursor and ethylenediamine as a basic catalyst and passivation agent. Since these CQDs are known to bear pri-mary amines groups at their surface, flavylium derivatives with tails containing carboxyl groups were synthesized, 7-hydroxy-4’-methylcarboxyflavylium and 7-hydroxy-4’-methylcarboxy-4-phenylflavylium, in order to functionalize the CQDs with these kind of molecules, using EDC as coupling agent.
CQDs were successfully functionalized with these two flavylium, however, the focus of this thesis was the study of CQDs functionalized with 7-hydroxy-4’ -methylcarboxy-4-phenylflavylium, due to its simplest equilibrium between AH+
and A. CQDs were characterized by UV-Vis and steady-state fluorescence spec-troscopy.
7
Resumo
O objetivo desta tese de mestrado foi a funcionalização de quantum dots de carbono (CQDs) com sais de flavílio. Os CQDs foram sintetizados através do método hidrotérmico usando ácido cítrico como precursor de carbono e etilenodiamina como catalisador e agente de emcapsulamento. Uma vez que os CQDs possuem aminas primárias na sua superfície, foram sintetizados derivados de flavílio com caudas contendo grupos carboxilo, 7-hidroxi-4'-metilcarboxiflavilio e 7-hidroxi-4'-metilcarboxi-4-phenilflavilio, a fim de funcionalizar os CQDs com este tipo de moléculas, usando EDC como agente de acoplamento.
Os CQDs foram funcionalizados com êxito com estes dois flavílios, no entanto, o foco desta tese foi o estudo de CQDs funcionalizados com o 7-hidroxi-4'-metilcarboxi-4-phenilflavilio, uma vez que possuí um equilíbrio mais simples, entre AH+ e A. Os CQDs funcionalizados foram caracterizados por
espectroscopia de UV-Vis e fluorescência no estado estacionário.
8
List of abbreviations and symbols
δ Chemical shift
ε Molar absorptivity
φ Quantum yield
A- Ionized quinoidal base
AH+ Flavylium cation
AIBN Azobisisobutyronitrile
ANS 1-Anilinonaphthalene-8-Sulfonic Acid
B Hemiacetal
Bt Benzotriazole
Cc Cis-chalcone
CD Carbon dot
CEE Crosslink enhanced emission CND Carbon nanodot
CNP Carbon nanoparticle CQD Carbon quantum dot
Ct Trans-chalcone
9 DCC N,N'-Dicyclohexylcarbodiimide
EA Elemental analysis EDA Ethylenediamine
EDC 1-Ethyl-3-(3-dimethylaminopropyl)carbodiimide EDTA Ethylenediaminetetraacetic acid
ESI/MS Electrospray Ionisation / Mass Spectrometry ESPT Excited state proton transfer
GQD Graphene quantum dot
HOMO Highest occupied molecular orbital
HR-TEM High-resolution transmission electron microscopy LUMO Lowest unoccupied molecular orbital
MWCO Molecular weight cut-off NBS N-Bromosuccinimide NHS N-Hydroxysuccinimide NMR Nuclear magnetic resonance
PD Polymer dot
PL Photoluminescence
QD Quantum dot
QY Quantum yield
SPC Single Photon Counting
10
Table of Contents
CHAPTER 1: INTRODUCTION ... 17
1.1. SEMICONDUCTORS ... 17
1.2. QUANTUM DOTS ... 18
1.3. CDSE QUANTUM DOTS... 20
1.4. CARBON DOTS ... 21
1.5. CARBON DOTS PHOTOLUMINESCENCE ... 23
1.6. CARBON QUANTUM DOTS FUNCTIONALIZATION ... 25
1.7. FUNCTIONALIZATION OF CQDS WITH SPIROPYRAN ... 26
1.8. CARBON DOTS DOPING ... 26
1.9. FLAVYLIUM SALTS ... 27
1.10. RESULTS AND DISCUSSION ... ERROR!BOOKMARK NOT DEFINED. CHAPTER 2: CARBON QUANTUM DOTS ... 29
1.1. SYNTHESIS OF CQDS ... 30
1.2. STUDY OF CQDS OPTICAL PROPERTIES ... 31
1.3. STUDY OF THE INFLUENCE OF PRECIPITATION/CENTRIFUGATION CYCLES ON CQDS OPTICAL PROPERTIES ... 34
1.4. STUDY OF PH INFLUENCE ON CQDS OPTICAL PROPERTIES ... 35
1.5. FLUORESCENCE LIFETIME MEASUREMENTS ... 37
1.6. TEM MEASUREMENTS OF QCDS ... 38
CHAPTER 3: FLAVYLIUM SALTS ... 39
1.1. SYNTHESIS OF 4’-METOXYFLAVYLIUM (1) ... 40
1.2. SYNTHESIS OF 4-BENZOTRIAZOL-4’-METOXYFLAVYLIUM (2) ... 42
1.3. SYNTHESIS OF 4-ETHYLACETATE-4’-METOXYFLAVYLIUM (3)... 43
1.4. SYNTHESIS OF 4-(BROMOMETHYL)ACETOPHENONE (4) ... 45
11
1.6. SYNTHESIS OF (4-ACETYLPHENYL)ACETIC ACID (6) ... 48
1.7. SYNTHESIS OF 4’-METHYLCARBOXYFLAVYLIUM (7) ... 49
1.8. SYNTHESIS OF 7-HYDROXY-4’-METHYLCARBOXYFLAVYLIUM (8) ... 50
1.9. SYNTHESIS OF 4’-METHYLCARBOXYCHALCONE (9) ... 51
1.10. SYNTHESIS OF 7-HYDROXY-4’-METHYLCARBOXY-4-PHENYLFLAVYLIUM (10) ... 52
1.11. UV-VIS TITRATION OF 7-HYDROXY-4’-METHYLCARBOXYFLAVYLIUM (8) ... 54
1.12. UV-VIS TITRATION OF 7-HYDROXY-4’-METHYLCARBOXY-4-PHENYLFLAVYLIUM (10) ... 58
1.13. FLUORESCENCE OF 7-HYDROXY-4’-METHYLCARBOXY-4-PHENYLFLAVYLIUM (10) ... 61
CHAPTER 4: FLAVYLIUM-FUNCTIONALIZED CQDS ... 63
1.1. FUNCTIONALIZATION OF CQDS WITH FLAVYLIUM SALTS ... 64
1.2. CQDS FUNCTIONALIZED WITH 7-HYDROXY-4’-METHYLCARBOXY-4-PHENYLFLAVYLIUM ... 65
CHAPTER 5: CONCLUSIONS ... 69
CHAPTER 6: EXPERIMENTAL PART ... 70
1.1. MATERIALS ... 70
1.2. EQUIPMENT ... 71
1.3. GENERALS PROCEDURES ... 72
A. SYNTHESIS OF 4’-METOXYFLAVYLIUM (1) ... 72
B. SYNTHESIS OF 4-BENZOTRIAZOL-4’-METOXYFLAVYLIUM (2) ... 72
C. SYNTHESIS OF 4-ETHYLACETATE-4’-METOXYFLAVYLIUM (3) ... 73
D. SYNTHESIS OF 4-(BROMOMETHYL)ACETOPHENONE (4) ... 73
E. SYNTHESIS OF (4-ACETYLPHENYL)ACETONITRILE (5) ... 74
F. SYNTHESIS OF (4-ACETYLPHENYL)ACETIC ACID (6) ... 74
G. SYNTHESIS OF 4’-METHYLCARBOXYFLAVYLIUM (7) ... 75
H. SYNTHESIS OF 7-HYDROXY-4’-METHYLCARBOXYFLAVYLIUM (8) ... 75
I. SYNTHESIS OF 4’-METHYLCARBOXYCHALCONE (9) ... 76
J. SYNTHESIS OF 7-HYDROXY-4’-METHYLCARBOXY-4-PHENYLFLAVYLIUM (10) ... 76
APPENDICES ... 77
12
Figures Index
FIGURE 1 – SCHEMATIC REPRESENTATION OF AN EXCITON AND THE CORRESPONDING ENERGY LEVELS ... 17
FIGURE 2 – SPLITTING OF ENERGY LEVELS IN QUANTUM DOTS DUE TO THE QUANTUM CONFINEMENT EFFECT ... 18
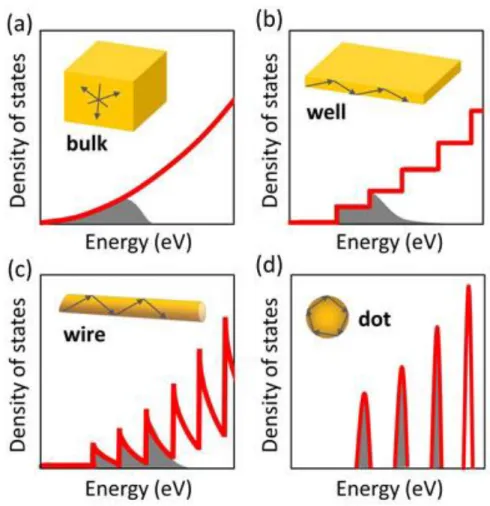
FIGURE 3 – VARIATION IN DENSITY OF STATES AND THEIR ENERGY WITH PARTICLE SHAPE ... 19
FIGURE 4 – CDSE QUANTUM DOTS UNDER UV LIGHT (TOP) AND DAYLIGHT (BOTTOM) WITH DIFFERENT SIZES, GROWING FROM LEFT TO RIGHT ... 20
FIGURE 5 – SCHEMATIC ILLUSTRATION OF DIFFERENT TYPES OF CDS ... 21
FIGURE 6 – SCHEMATIC ILLUSTRATION OF CDS PREPARATION VIA “TOP-DOWN” AND “BOTTOM-UP”... 22
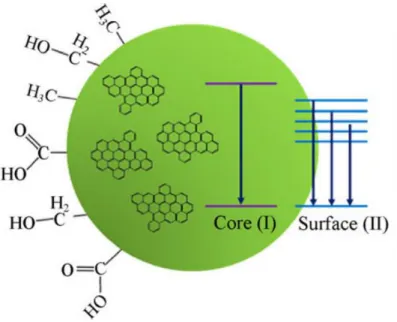
FIGURE 7 – SCHEMATIC ILLUSTRATION OF CORE AND SURFACE-STATE EMISSION ... 23
FIGURE 8 – REPRESENTATION OF PDS PL MECHANISM (CEE EFFECT) ... 24
FIGURE 9 – UV-VIS SPECTRA (DASHED LINE) AND PL EMISSION SPECTRA (SOLID LINES) AS A FUNCTION OF EXCITATION WAVELENGTH ... 31
FIGURE 10 – PL EXCITATION SPECTRA OF CQDS COLLECTING AT DIFFERENT WAVELENGTHS ... 32
FIGURE 11 – PL EMISSION SPECTRA, EXCITING THE C-BAND (LEFT) AND THE S-BAND (RIGHT) ... 33
FIGURE 12 – 3D FLUORESCENCE SPECTRA OF CQDS ... 33
FIGURE 13 – PL SPECTRA AND FLUORESCENCE QY (INSET) AS A FUNCTION OF PURIFICATION CYCLES (ΛEX =360 NM) ... 34
FIGURE 14 – UV-VIS SPECTRA (DASHED LINES) AND PL SPECTRA (SOLID LINES) AS A FUNCTION OF PH, FROM PH 1.2 TO PH 7 (ΛEX = 360 NM) ... 35
FIGURE 15 – FLUORESCENCE QY AS A FUNCTION OF PH, FROM PH 1.2 TO PH 7 (ΛEX = 360 NM)... 36
FIGURE 16 – FLUORESCENCE LIFETIME DECAYS COLLECTED AT 450NM (LEFT) AS A FUNCTION OF PH, AND AT PH 5.01 (RIGHT) AS A FUNCTION OF COLLECTED WAVELENGTH ... 37
FIGURE 17 – TEM IMAGE OF CQDS ... 38
FIGURE 18– REACTION MIXTURE BEFORE (LEFT) AND AFTER (RIGHT) ELECTROPHILE ADDITION ... 44
FIGURE 19 – MASS SPECTROSCOPY OF 7-HYDROXY-4’-METHYLCARBOXYFLAVYLIUM ... 51
FIGURE 20 – MASS SPECTROSCOPY OF 7-HYDROXY-4’-METHYLCARBOXY-4-PHENYLFLAVYLIUM ... 53
FIGURE 21 – ABSORPTION SPECTRA OF 7-HYDROXY-4’-METHYLCARBOXYFLAVYLIUM (8) AFTER PH JUMP, AS A FUNCTION OF PH, FROM PH 0.58 TO 8.73. ARROWS INDICATE THE ABSORBANCE VARIATION WITH INCREASE IN PH ... 54
13
FIGURE 23 –VARIATION OF ABSORBANCE AT 440NM: EXPERIMENTAL VALUES AFTER PH JUMP (▲) AND AFTER
EQUILIBRATE IN THE DARK (■); AND VALUES CALCULATED USING EQUATION 5, AFTER PH JUMP (DASHED
LINE) AND AFTER EQUILIBRATE IN THE DARK (SOLID LINE) ... 57 FIGURE 24 – MOLE FRACTION DISTRIBUTION AS A FUNCTION OF PH FOR THE 7-HYDROXY-4’
-METHYLCARBOXYFLAVYLIUM COMPOUND, AFTER PH JUMP (DASHED LINES) AND AFTER EQUILIBRATE IN THE DARK (SOLID LINES) ... 57 FIGURE 25 – ABSORPTION SPECTRA OF 7-HYDROXY-4’-METHYLCARBOXY-4-PHENYLFLAVYLIUM AFTER PH JUMP, AS
A FUNCTION OF PH, FROM PH 0.60 TO 9.28. ARROWS INDICATE THE ABSORBANCE VARIATION WITH INCREASE IN PH, FOR THE SOLID LINES ... 58 FIGURE 26 – ABSORPTION SPECTRA OF 7-HYDROXY-4’-METHYLCARBOXY-4-PHENYLFLAVYLIUM (8) AFTER
EQUILIBRATE IN THE DARK, AS A FUNCTION OF PH, FROM PH 0.60 TO 8.34 (SOLID LINES) AND FROM PH 8.92 TO 9.28 (DASHED LINES). ARROWS INDICATE THE ABSORBANCE VARIATION WITH INCREASE IN PH, FOR THE SOLID LINES... 59 FIGURE 27 – VARIATION OF ABSORBANCE AT 440NM: EXPERIMENTAL VALUES AFTER PH JUMP (▲) AND AFTER
EQUILIBRATE IN THE DARK (■); AND VALUES CALCULATED USING (EQ 5), AFTER PH JUMP (DASHED LINE) AND
AFTER EQUILIBRATE IN THE DARK (SOLID LINE) ... 59 FIGURE 28 – MOLE FRACTION DISTRIBUTION AS A FUNCTION OF PH FOR THE 7-HYDROXY-4’
-METHYLCARBOXY-4-PHENYLFLAVYLIUM COMPOUND, AFTER PH JUMP (DASHED LINES) AND AFTER EQUILIBRATE IN THE DARK (SOLID LINES) ... 60 FIGURE 29 – FLUORESCENCE EMISSION SPECTRA AT THE EXCITATION WAVELENGTH 460 NM (ISOSBESTIC POINT) AS A FUNCTION OF PH, FROM 0.60 TO 9.28... 61 FIGURE 30 – FLUORESCENCE EXCITATION SPECTRA COLLECTING AT 600NM (A EMISSION) AS A FUNCTION OF PH,
FROM 0.60 TO 9.28 ... 62 FIGURE 31 – FLUORESCENCE EMISSION SPECTRA AT THE EXCITATION WAVELENGTH 430 NM (AH+) AS A FUNC-TION
OF PH, FROM 0.60 TO 9.28 ... 62 FIGURE 32 – ABSORPTION SPECTRA OF CQDS FUNCTIONALIZED WITH 7-HYDROXY-4’
-METHYLCARBOXY-4-PHENYLFLAVYLIUM AFTER EQUILIBRATE IN THE DARK, AS A FUNCTION OF PH, FROM PH 0.57 TO 7.98. ARROWS INDICATE THE ABSORBANCE VARIATION WITH INCREASE IN PH. INSET: MOLE FRACTION OF AH+ AND
A ... 65 FIGURE 33 – VARIATION OF ABSORBANCE: EXPERIMENTAL VALUES AT 490 NM (▲) AND AT 435 NM (■); AND
VALUES CALCULATED USING (EQ 9), AT 490 NM (DASHED LINE) AND AT 435 NM (SOLID LINE) ... 66 FIGURE 34 – FLUORESCENCE EMISSION SPECTRA AT THE EXCITATION WAVELENGTH 460 NM (ISOSBESTIC POINT) AS A FUNCTION OF PH, FROM 0.57 TO 7.98... 66 FIGURE 35 – FLUORESCENCE EMISSION SPECTRA AT THE EXCITATION WAVELENGTH 430 NM (LEFT) AND 490 NM
(RIGHT) AS A FUNCTION OF PH, FROM 0.57 TO 7.98... 67 FIGURE 36 – FLUORESCENCE EXCITATION SPECTRA COLLECTING AT 520 NM (LEFT) AND AT 600 NM (RIGHT) AS A
15
Schemes Index
SCHEME 1 – CROSSLINKING CHEMISTRY USING EDC AND NHS ... 25
SCHEME 2 - SCHEMATIC ILLUSTRATION OF LIGHT-INDUCED FLUORESCENCE MODULATION OF THE SPIROPYRAN-FUNCTIONALIZED CNPS ... 26
SCHEME 3 – STRUCTURE OF ANTHOCYANIN COMPOUNDS AND THE FLAVYLIUM CATION (GL = GLYCOSIDE) ... 27
SCHEME 4 – FLAVYLIUM NETWORK OF CHEMICAL REACTIONS ... 28
SCHEME 5 – HYDROTHERMAL REACTION ... 30
SCHEME 6 – ENGINEERING OF BENZOPYRYLIUM SALTS BY INDIRECT ELECTROPHILIC SUBSTITUTION... 39
SCHEME 7 – CONDENSATION BETWEEN PHENOL AND UNSATURATED KETONE IN ACIDIC CONDITIONS ... 39
SCHEME 8 – CONDENSATION REACTION BETWEEN SALICYLALDEHYDE AND AN ACETOPHENONE ... 40
SCHEME 9 – NUCLEOPHILIC ADDITION OF BENZOTRIAZOLE ... 42
SCHEME 10 – ELECTROPHILIC SUBSTITUTION FOLLOWED BY ACID-PROMOTED DEBENZOTRIAZOLYLATION AND ESTER HYDROLYZE ... 43
SCHEME 11 – WOHL-ZIEGLER BROMINATION REACTION ... 45
SCHEME 12 – DECOMPOSITION OF AIBN ... 45
SCHEME 13 – INITIATION STEP ... 45
SCHEME 14 – PROPAGATION STEPS ... 46
SCHEME 15 – GENERATION OF BR2 FROM NBS ... 46
SCHEME 16 – NUCLEOPHILIC SUBSTITUTION OF BR FOR CN ... 47
SCHEME 17 – ACID CATALYSED HYDROLYSIS REACTION ... 48
SCHEME 18 – CONDENSATION REACTION OF (4-ACETYLPHENYL)ACETIC ACID WITH 2-HIDROXYBENZALDEHYDE ... 49
SCHEME 19 – CONDENSATION REACTION OF (4-ACETYLPHENYL)ACETIC ACID WITH 2,4-HIDROXYBENZALDEHYDE 50 SCHEME 20 – CONDENSATION REACTION OF 4-ACETYLPHENYL)ACETIC ACID WITH BENZALDEHYDE ... 51
SCHEME 21 – CONDENSATION REACTION OF 4’-METHYLCARBOXYCHALCONE WITH RESORCINOL ... 52
16
Tables Index
17
Introduction
1.1. Semiconductors
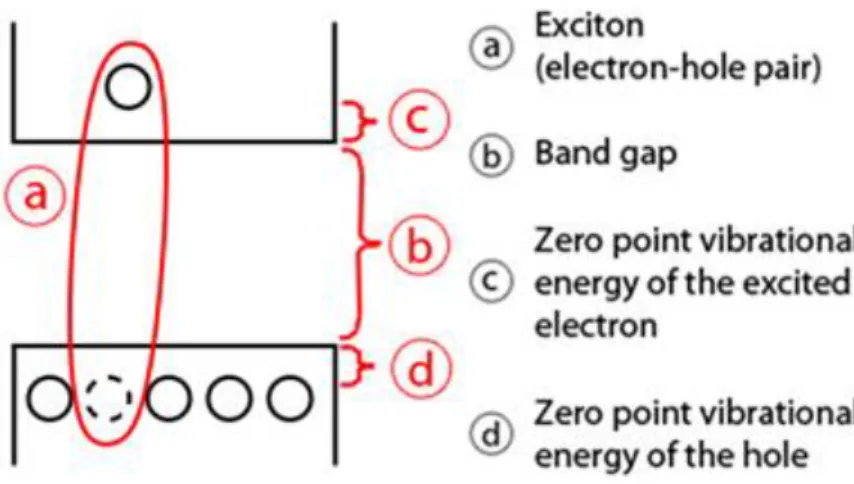
In semiconductors, light absorption generally leads to an electron being ex-cited from the valence to the conduction band, leaving behind a hole. The elec-tron and the hole can still be attracted to each other by electrostatic Coulomb forces, forming an exciton (the electron-hole pair). When this exciton recombines i.e. the electron resumes its ground state, the exciton's energy can be emitted as light. This phenomenon is commonly known as photoluminescence (PL).1
In a simplified model, the energy of the emitted photon can be understood as the sum of the band gap energy between the highest occupied level and the lowest unoccupied energy level, the confinement energies of the hole and the excited electron, and the bound energy of the exciton.
Figure 1 –Schematic representation of an exciton and the corresponding energy levels
18
1.2. Quantum dots
Quantum dots (QDs) are semiconductor spherical nanoparticles, with a size typically under 10 nm.2,3 These nanoparticles exhibit optical and electronic
prop-erties different from those observed in bulk particles. One property with special interest is their size-dependent fluorescence. This is due to a phenomena known as “quantum confinement”.4, 5
Quantum confinement results from electrons and electron holes being squeezed into a dimension that approaches a critical quantum measurement, called the exciton Bohr radius, this represents the distance between the electron and the hole. As the confining dimension decreases and reaches a certain limit, the energy spectrum becomes discrete. This means that instead of having a con-tinuous energy band, composed of various energy states closely staked together, QDs have discrete energy states. This discretization results in electronic transi-tions that vary by QD size. Larger QD have closer electronic states than smaller quantum dots which means that the energy required to excite an electron from HOMO to the LUMO is lower than the same electronic transition in a smaller QD. This quantum confinement effect can be observed as a red shift in absorb-ance spectra for nanocrystals with larger diameters.
19 As a consequence, larger QDs (radius of 5 – 6 nm) emit at longer wave-lengths resulting in emission colours such as orange or red. Smaller QDs (radius of 2 – 3 nm) emit shorter wavelengths resulting in colours like blue and green, although the specific colours and sizes vary depending on the exact composition of the QD.
A spherical nanoparticle can have quantum confinement in three dimen-sions, but is also possible to have quantum confinement in only two dimensions (quantum wire) and in one dimension (quantum well). This indicates that the nanoparticles shape may also play an important role in the optical and electronic proprieties.6
20
1.3. CdSe Quantum dots
The most famous and well-studied type of quantum dots are cadmium-sele-nide (CdSe) QDs.7,8 These are semiconductor nanocrystals composed of a CdSe
core and a ligand shell. Ligands play important roles in the stability and solubil-ity of these nanoparticles. During synthesis, ligands stabilize growth to prevent aggregation and precipitation of the nanocrystals. These capping ligands also af-fect the quantum dots electronic and optical properties by passivating surface electronic states.9
To improve fluorescence quantum yield (QY), quantum dots can be made with "shells" of a larger bandgap semiconductor material around them, like CdS. The improvement is suggested to be due to the reduced access of electron and hole to non-radiative surface recombination pathways in some cases, but also due to reduced auger recombination in others.10
Figure 4 –CdSe Quantum dots under UV light (top) and daylight (bottom) with different sizes,
growing from left to right
CdSe quantum dots have been implemented in a wide range of applications including solar cells11, light emitting diodes10, and biofluorescent tagging.12
CdSe-based materials also have potential uses in biomedical imaging.13
21
1.4. Carbon dots
Carbon dots (CDs), also called carbon nanoparticles (CNPs), are one emerg-ing new type of material that have shown great potential. They were first ob-tained accidently by Xu et al. in 2004 during the purification of single-walled car-bon nanotubes (sw-CNTs) through preparative electrophoresis.15 In 2006 Sun et
al. reported the synthesis of this type of material via laser ablation of graphite powder, he was also the first to use the term “carbon quantum dots” (CQDs) to define these fluorescent carbon nanoparticles.16
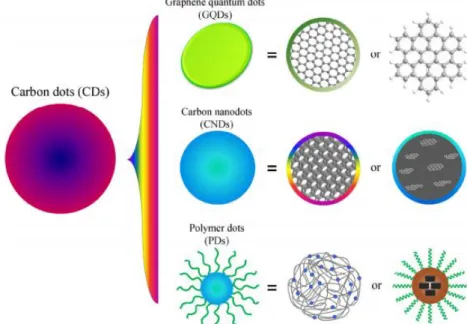
CDs are normally divided into graphene quantum dots (GQDs), carbon quantum dots (CQDs) and polymer dots (PDs). The main difference between these types of carbon materials is their structure: GQDs have a single layer carbon (graphene) core with connected chemical groups on the surface or edge17; PDs
possess aggregated polymer structures18; and CQDs, sometimes also referred to
as carbon nanodots (CNDs), comprise all other types of carbon nanoparticles.
Figure 5 –Schematic illustration of different types of CDs
Contrary to traditional quantum dots, these type of material are not made of semiconductor materials but instead small organic molecules condensed to-gether to form nanoparticles (< 10nm). 19,20
22 biocompatibility, low cost and chemical inertness, which makes them very attrac-tive for several applications.20,21
There are, however, some difficulties to overcome before CDs can really re-place traditional semiconductors QDs, among them are the complex procedures for their separation, purification and functionalization, their generally low quan-tum yields, and ambiguity in their geometry, composition and structure.
A wide variety of methods have been used to synthesize CQDs, which can be classified into “top-down” and “bottom-up”.
Figure 6 –Schematic illustration of CDs preparation via “top-down” and “bottom-up”
Top-Down methods typically involve the cleavage of bulk materials like graphene sheets, graphite particles, carbon nanotubes and nanodiamonds, fol-lowed by surface passivation of the as prepared CDs. Most used top-down meth-ods are laser ablation22, electrochemical carbonization23 and arc discharge.24
Bottom-Up methods consist in assembling CDs from small organic mole-cules like citric acid, EDTA or some alcohols, also followed by surface pas-sivation. Examples of this type of synthetic methods are hydrothermal treat-ment25, microwave irradiation26 and size control-confined pyrolysis.27
Although many new synthetic methods of preparing CDs have emerged in recent years, there are still some room to improving, namely in the size control, aggregation prevention and surface proprieties.
23
1.5. Carbon dots photoluminescence
Most CDs exhibit PL, however, the origin of this PL is not always clear and is still open for debate within the scientific community.
Four different types of emissive states have been confirmed (i) carbon core states; (ii) surface states; (iii) molecule states; and (iv) states formed by the cross-link enhanced emission (CEE) effect.18,28
The carbon core state is caused by the quantum confinement effect of con-jugated π-domains determined by the carbon core. As mention before, this effect occurs when quantum dots are smaller than their exciton Bohr radius. This is thought to be the true intrinsic PL centre in GQDs since they have a perfect gra-phene core and less surface chemical groups. This PL emission can be tuned by the size of the conjugated π-domains i.e. the GQD.
The surface state (also called defect state) arises from the functional groups present at CDs surface. These functional groups have various energy levels, which may result in a series of emissive traps. In CQDs, a higher degree of surface oxidation or other effective modification can result in more surface defects, re-sulting in a red-shifted emission, which supports the theory that in CQDs the emission is dominated by the surface state emissive traps. These surface states do not consist of isolated chemical groups but rather the hybridization of the car-bon backcar-bone and connected chemical groups.
24 At first glance, molecule and surface state seems to refer to the same thing, however, the two should not be confused. As mention above, the surface state is the PL centre, formed by the synergetic hybridization of the chemical groups and the carbon core, whereas the molecule state is the PL centre formed solely by an organic fluorophore; the fluorophore is connected on the surface or interior of the carbon backbone and can exhibit PL emission directly. These organic fluoro-phores are formed in the first stages of CDs formation, at low reaction tempera-tures, and then as the carbonization temperature increases, the carbon core is formed by dehydration of the initial molecules or consumption of the formed fluorophores.
The molecule state is the emerging PL centre for a CDs prepared by small-molecule carbonization, like CQDs. These CDs typically exhibit strong PL emis-sion with high QYs, whereas the carbon-core state possesses weak PL behaviour with high photostability.
In PDs, owing to the crosslinked skeleton, the vibration and rotation of the amino-based fluorophores is restricted, and the percentage of radiative processes increased (CEE effect). These PDs exhibit temperature-dependent PL, higher temperatures aggravate the vibration and rotation, thus increasing the non-radi-ative process.
25
1.6. Carbon quantum dots functionalization
After synthesis, it is possible to tune and improve CQDs properties through surface modification. There are many approaches for functionalizing the surface of CQDs, like covalent bonding, coordination, π–π interactions, and sol–gel tech-nology. 9,16,19
Most CQDs are rich in functional groups, like carboxylic acids, ketones, es-ters, and amines, which makes them suitable for covalent bonding. Surface pas-sivation via covalent bonding of carboxyl-containing agents is a common method to improve the PL of CQDs, which showed an important influence on the prop-erties of CQDs. 29
Carbodiimide compounds provide the most popular and versatile method for crosslinking amines to carboxylic acids. The most readily available and com-monly used carbodiimides are the water-soluble EDC for aqueous crosslinking and the water-insoluble DCC for non-aqueous organic synthesis methods.
Carbodiimide conjugation works by activating carboxyl groups for direct reaction with primary amines via amide bond formation. Because no portion of their chemical structure becomes part of the final bond between conjugated mol-ecules, carbodiimides are considered zero-length carboxyl-to-amine crosslinkers.
N-hydroxysuccinimide (NHS) is often included in EDC coupling protocols to improve efficiency and/or create dry-stable (amine-reactive) intermediates. EDC couples NHS to carboxyls, forming an NHS ester that is considerably more stable than the O-acylisourea intermediate while allowing for efficient conjuga-tion to primary amines.
26
1.7. Functionalization of CQDs with spiropyran
Liao et al. reported the functionalization of CQDs, obtained by hydrother-mal carbonization of EDTA, with spiropyrans.29 The emission of the
functional-ized CQDs centred at 510 nm could be switched off, while being turned on at 650 nm via energy transfer between the CQDs and spiropyrans after irradiation with ultraviolet (UV) light. The process could be reversed using irradiation with visi-ble light. The functionalized CQDs show excellent photo-reversibility and high stability.
Scheme 2 - Schematic illustration of light-induced fluorescence modulation of the spiropyran-functionalized CNPs
1.8. Carbon dots doping
Doping is a widely-used approach to tune the PL properties of photolumi-nescent materials. Various doping methods with dozens of elements such as N, S, and P have been reported to tune the properties of CQDs.30,31 N-doping is the
most studied way to enhance the emission of the CQDs by inducing an upward shift in the Fermi level and electrons in the conduction band.31 It was
27
1.9. Flavylium salts
Flavylium compounds are versatile molecules that can be found in nature in the form of anthocyanidins and anthocyanins, pigments that are responsible for the colours of many flowers.32 Anthocyanidins are the sugar-free counterparts
of anthocyanins, common plant pigments that may appear red, purple, or blue depending on the pH. Flavylium is the name given to the 2-phenylbenzopy-rylium ion, a derivative of benzopy2-phenylbenzopy-rylium with a phenyl group attached in posi-tion 2 (see Scheme 3).
Scheme 3 – Structure of anthocyanin compounds and the flavylium cation (Gl = glycoside)
In solution flavylium salts can undergo various structural transformations that can be driven by pH changes or light excitation.33,34 These transformations
are normally accompanied by colour change or disappearance.
28
Scheme 4 –Flavylium network of chemical reactions
Something very interesting in this type of systems is that AH+ and B can be
interconverted by pH changes, while Cc and Ct can be interconverted by photo-excitation. In sufficient basic pH Cc and Ct can undergo deprotonation to give the Cc- and Ct- monoanions, respectively, which can also be interconverted by
light excitation.35
At equilibrium, this system behaves as a single acid–base equilibrium be-tween the flavylium cation and a conjugate base, CB, defined as the sum of the concentrations of the other species in the network, [CB] = [A] + [B] + [Cc] + [Ct].
29
Carbon Quantum Dots (CQDs)
In this chapter it is discussed the synthesis and characterization of CQDs, following a method previous described by Sun et al.31 The characterization was
done by UV-vis absorption spectroscopy, steady-state and time-resolved fluores-cence spectroscopy, and transmission electron microscopy (TEM).
The main goal was the synthesis of highly fluorescent CQDs using well de-fined starting materials (single molecules instead of complex organic matrixes like biomass), and with functional groups attached to their surface so that they can be easily functionalized.
30
1.1. Synthesis of CQDs
The synthesis of this QDs was accomplish by hydrothermal treatment of citric acid and Ethylenediamine (EDA) in water. The citric acid acts as a carbon source while the EDA acts as a basic catalyst and passivation agent.
Scheme 5 –Hydrothermal reaction
The reaction conditions (temperature, reaction time and concentration of reagents) where already optimized by Sun et al.31 Is was chosen the reactions
con-ditions that yielded the higher fluorescence QY (94%).
Purification of the as-synthesized CQD is a critical step in the overall fabri-cation process. The presence of unreacted precursors or excess surfactants can limit charge transfer and decrease the fluorescence QY.
CQDs were purified by multiple cycles of precipitation with anhydrous eth-anol followed by centrifugation and discard of the precipitate. The final step was the filtration of the supernatant using a nylon membrane with a pour opening of 200 nm.
It was also attempted to use dialysis was purification method, however, it was found that both CQDs and citric acid/EDA could pass through the mem-brane (1 kD). Some authors claim to use such a memmem-brane to purify similar CQDs29, 36, however in your case that was not possible. Because no membrane
with a lower molecular weight cut-off (MWCO) was available, this purification method was abandoned.
Regarding the precipitation/centrifugation cycles, this method was also used by Sun et al.31, in their case the supernatant was discarded and the CQDs
31
1.2. Study of CQDs optical properties
The absorption spectrum shows strong absorption bands in the UV region with a tail extending to the visible region. The absorption shoulder at 250 nm correspond to π –π* transition of the carbon core. Another absorption shoulder appears at 355 nm corresponding to n –π* transition of the surface functionalized C=O bonds or other connected groups.
Figure 9 – UV-Vis spectra (dashed line) and PL emission spectra (solid lines) as a function of
excitation wavelength
CQDs exhibit a wide emission peak wide with large stocks shift (≈ 6349 cm -1) when compared with that of organic dyes. This emission peak seems to be
ex-citation wavelength-dependent, which means that the emission maxima changes with the excitation wavelength. This may result from the wide distributions of differently sized dots and surface chemistry.
By exciting at the optimal excitation wavelength (350 nm), the strongest emission peak is observed at 450 nm. This emission maximum then shifts to-wards higher wavelengths with increasing in the excitation wavelength. In the excitation spectra below (Figure 10) it is possible to see this shift, as well as evi-dence of a second excitation band in the UV region (< 270 nm).
0 0.1 0.2 0.3 0.4 0.5 0.6 0.7 0.8 0.9 1 0 0.02 0.04 0.06 0.08 0.1 0.12 0.14 0.16
220 320 420 520 620
32
Figure 10 –PL excitation spectra of CQDs collecting at different wavelengths
The longer wavelength excitation band (290 – 470 nm) can be attributed to surface defects or states and it is referred to as the S-band. The second excitation band observed at the lower wavelength region (< 270 nm) can be attributed to the π–π* transition of the carbon core and it is referred to as the C-band.
It is observed that the S-band shows relatively broad absorption (285–470 nm) and a continuous shift in its excitation maximum relative to the monitoring wavelength. This is an indication that the different surface states, due to CQDs surface heterogeneity, are responsible for the observed excitation-dependent emission maximum.
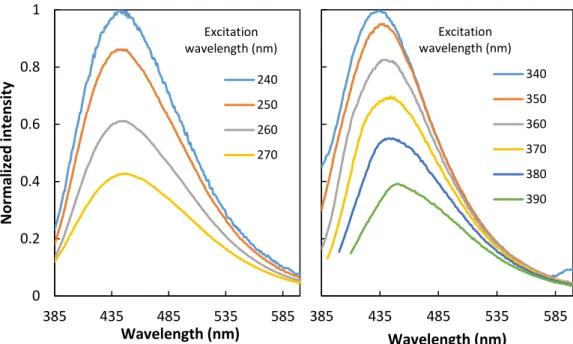
Figure 11 shows a side-by-side comparison of CQDs emission, exciting the C-band (240 – 270 nm) and the S-band (340 – 390 nm). Unfortunately, our spec-trofluorimeter is unable to irradiate samples below 240 nm (the lamp correction file was generated above 240 nm), so it was not possible to fully characterized the C-band, however, the acquired data showed no shift on the emission band, which indicates that the π–π* transition of the carbon core has no influence on the exci-tation-dependent emission behaviour.
0 0.2 0.4 0.6 0.8 1
250 300 350 400 450 500
33
Figure 11 –PL emission spectra, exciting the C-band (left) and the S-band (right)
The 3D fluorescence spectra (Figure 12) show two distinct contours (corre-sponding to C-band and S-band) of almost equal intensity appearing at the same emission maximum (450 nm), i.e., excitation of the C-band or the S-band lead to the same PL maximum. This clearly indicates that, even when the excitons are generated at the carbon core, they get trapped and relax at the surface defects before recombination, this explains why both bands have the same emission curve and the large stokes shifted observed.
Figure 12 –3D fluorescence spectra of CQDs
385 435 485 535 585
Wavelength (nm) 340 350 360 370 380 390 0 0.2 0.4 0.6 0.8 1
385 435 485 535 585
34
1.3. Study of the influence of precipitation/centrifugation cycles on CQDs optical
properties
In order to determine the ideal number of precipitation/centrifugation cy-cles, CQDs from the same batch were subjected to the same purification steps, varying the number of purification/centrifugation cycles.
The as purified CQDs were then dried in a rotary evaporator and re-dis-persed in water at pH 5 (as seen before, there is no significant variation of PL intensity or fluorescence QY around this pH value, which eliminates the need to correct small changes in pH). The absorbance values of these solutions were ad-justed to roughly 0.1 and the PL spectra was obtained. Fluorescence QY was cal-culated by the relative method using 8-Anilinonaphthalene-1-sulfonic acid (ANS) as standard.
Figure 13 –PL spectra and fluorescence QY (Inset) as a function of purification cycles (λex =360
nm)
Figure 13 shows that the first two purification/centrifugation cycles led to a slight increase in PL intensity (≈11%) and QY (≈13%), however following cycles drastically diminished PL intensity (≈64%) and QY (≈61%). This can be explained by the loss of ligands attached to CQDs surface, which interfere with the surface states responsible for PL.
0.0 0.2 0.4 0.6 0.8 1.0
400 450 500 550 600 650
N o rmali ze d I n ten si ty ( a .u .) Wavelength (nm)
0 1 2 3 4
0.00 0.04 0.08 0.12 0.16
0 1 2 3 4
35
1.4. Study of pH influence on CQDs optical properties
Since flavylium salts are pH-sensitive, it was also important to determine how pH changes influence CQDs optical properties like absorbance and PL.
This was done by preparing a stock solution of CQDs in water at pH 1 and then transferring 1 mL to several plastic cuvettes. In each cuvette 1 mL of NaOH 1 M was added and 1 mL of phosphate buffer with the desired pH value. Ab-sorbance, fluorescence emission and excitation spectra of each sample were rec-orded, and the fluorescence QY was later calculated using the same method as before.
Perchloric acid (HClO4) was used to adjust the buffer pH instead of
hydro-chloric acid (HCl) because in very acidic conditions (pH < 2) Cl- ions can quench
fluorescence.
Figure 14 –UV-Vis spectra (dashed lines) and PL spectra (solid lines) as a function of pH, from pH 1.2 to pH 7 (λex = 360 nm)
As shown in the above chart, although no significant change was possible to observe in the absorbance spectra, there is a clear dependence of PL with the pH value. This can be explained by the protonation and deprotonation of surface oxygen-containing groups, responsible for oxygen-related surface states where luminescence originates. This protonation and deprotonation can also cause elec-trostatic doping/charging of the CQDs, which can also influence the PL.
0 0.2 0.4 0.6 0.8 1 0 0.2 0.4 0.6 0.8 1
250 350 450 550 650
36 Figure 14 shows that the PL intensity of CQDs increased drastically (≈102%) as the pH increased from 1.2–7. A similar behaviour was observed for the fluo-rescence QY (Figure 15), which increased significantly (≈57%) as the pH in-creased, however, after pH 3 there was almost no variation of QY.
Figure 15 –Fluorescence QY as a function of pH, from pH 1.2 to pH 7 (λex = 360 nm)
0.03 0.04 0.04 0.05 0.05 0.06 0.06
0 1 2 3 4 5 6 7
Fl
uo
resc
en
ce
QY
37
1.5. Fluorescence lifetime measurements
Fluorescence lifetime measurements were made in a custom single photon counting (SPC) apparatus, irradiating a solution of CQDs with a pulsed LED (λex=370 nm) and collecting the emitted photons at three different wavelengths:
430, 450, and 470 nm. Measurements were also made at four different pH values. Fluorescence lifetime were calculated by making a global fit of the three decays collected at different wavelengths, for each pH value (Figure 16, left). All samples exhibited double exponential lifetime decay, indicating that fluores-cence may originate from two different species.
Figure 16 –Fluorescence lifetime decays collected at 450nm (left) as a function of pH, and at pH 5.01 (right) as a function of collected wavelength
The calculated mean fluorescence lifetimes are greater at higher pH values, i.e., the fluorescence intensity decays at shorter timescale in the lower pH values and at longer timescale in the higher pH range (Table 1).
At the same pH value (exciting at 370 nm) there is no considerable variation in the fluorescence lifetime decay while monitoring at the different emission wavelengths (Figure 16, right). This indicate that the longer wavelength excita-tion selectively excites only the relaxed state/surface state.
1E+0 1E+1 1E+2 1E+3 1E+4
0 5 10 15 20 25 30
C o u n ts Time (ns) IRF pH 1.45 pH 4.35 pH 5.01 pH 6.88
0 5 10 15 20 25 30
Time (ns)
38
Table 1 –Fluorescence lifetime measurements
pH τ1 (ns) τ2 (ns) τav (ns) χ2
1.45 2.932 8.570 4.304 1.192
5.01 2.992 8.427 5.373 1.118
6.88 2.902 9.062 5.388 1.174
1.6. TEM measurements of QCDs
TEM microscopy was fundamental to confirm the formation of CQDs and to assess the particle uniformity and size distribution. The measurements shown great uniformity with sizes ranging from 2.2 to 2.4 nm in diameter. Because the sample was too diluted, and CQDs are so small, it was only possible to observe a few CQD at a time. However, there was no sign of CQDs aggregation, which can happen in more concentrated solutions.
In more powerful TEM, like high resolution TEM (HR-TEM), it is even pos-sible to measure the lattice fringes, which can be used to determine the crystal structure of the carbon cores.
Figure 17 –TEM image of CQDs
2.33 nm
39
Flavylium Salts
In this chapter, it is discussed the various attempts to synthesize flavylium salts suitable for CQDs functionalization, and their characterization. The main goal was the incorporation of a carboxylic tail in the flavylium skeleton in order to attach it to primary amines present at CQDs surface.
The first synthetic approach was based in a strategy proposed by Katritzky
et al37. This strategy consists in synthesizing a flavylium salt and then attach it a
molecule containing a carboxylic acid, at position 4.
Scheme 6 –Engineering of benzopyrylium salts by indirect electrophilic substitution
The second synthetic approach was based in a strategy proposed by Robin-son and Walker38. In this strategy the carboxylic tail is incorporated in an α,β–
unsaturated ketone, which then react with a phenol to form a flavylium salt with the carboxylic tail in position 4’.
Scheme 7 –Condensation between phenol and unsaturated ketone in acidic conditions
40
1.1. Synthesis of 4’-metoxyflavylium (1)
The first step in synthesizing flavylium cations suitable for CQD function-alization was the synthesis of simple and well-studied flavylium. The chosen fla-vylium was the 4’-metoxyflavylium, since its reported absorption maximum is 450 nm, the emission maximum of CQDs. The synthesis was done following a method previously reported by Robinson and Walker38, through the
condensa-tion reaccondensa-tion between a salicylaldehyde and an acetophenone in acidic medium. Tetrafluorboronic acid (HBF4) was used because the tetrafluoroborate anion
(BF4-) makes the flavylium salts more soluble in organic solvents, needed for
fur-ther steps. Furfur-thermore, BF4− is less nucleophilic and basic than nitrates and hal-ides. BF4− owes its inertness to its symmetry, the negative charge is distributed equally over four atoms, and it is composed of highly electronegative fluorine atoms, which diminish the basicity of the anion.
Scheme 8 –Condensation reaction between salicylaldehyde and an acetophenone
The reaction yields were in the range 30-40%. This low yield is due to the difficulty in precipitating the flavylium salt, which is more soluble in organic sol-vents due to the reasons stated above.
After the initial precipitation with diethyl ether (yielding a bright orange powder), the remaining dark solution was dried in the rotary evaporator and redissolved in a small amount of acetic acid. This solution was then frozen with liquid nitrogen (-195.79 °C) and a small amount of diethyl ether was added. After reaching room temperature it was possible to collect more flavylium salt by fil-tration.
41 the precipitation of more flavylium salt but also allowed some impurities to be-come trapped in the crystalline structure. For this reason, only the first precipi-tated flavylium was used in the next reaction.
42
1.2. Synthesis of 4-benzotriazol-4’-metoxyflavylium (2)
In order to attach a carboxylic tail to the flavylium skeleton, necessary for CQDs functionalization, it was used a method previously reported by Katritzky
et al37. This method consists of an benzotriazole-mediated indirect nucleophilic
substitution in the position 4 (position para to the oxygen atom) of the flavylium. The first step was the nucleophilic addition of benzotriazol at the position 4.
Scheme 9 –Nucleophilic addition of benzotriazole
Sodium benzotriazolate was generated in situ by deprotonation of the ben-zotriazole with sodium hydride (NaH), this reaction releases H2 and was
per-formed under a N2 flow. When no more H2 bubbles were observed (≈30 min) the
previous synthesized 4’-metoxyflavylium was added and the solution stirred for another 30 min. Almost immediately after flavylium addition there was a loss of colour, something expected since the addition of benzotriazole at the position 4 breaks the conjugation in the system.
43
1.3. Synthesis of 4-ethylacetate-4’-metoxyflavylium (3)
After attaching benzotriazole in the position 4, the ring reactivity is inverted and can now act as a nucleophile. For this to happen it is first necessary to remove the proton in position 4, which is now the more acidic proton due to the inductive effect of the benzotriazole group. This proton can be removed using a strong base like n-Butyllithium, forming a carbanion that can react with an electrophile like alkyl bromides.
Scheme 10 –Electrophilic substitution followed by acid-promoted debenzotriazolylation and es-ter hydrolyze
The deprotonation reaction with n-BuLi must be done at very low temper-atures (-95 °C) in order to stabilize the carbanion formed and to avoid a violent reaction. This low temperature can be achieved using a freezing bath of acetone. It is also important to use oven-dried glassware and a dry N2 flow, in order to
44 (deep blue). This is typical of carbanions and is a good indicator of the deproto-nation reaction.
After addition of the electrophile, ethyl 2-bromoacetate, the reaction follows a SN2 mechanism, with the leaving group Br- being substituted by the
4-benzotri-azol-4’-metoxyflavylium. This is again accompanied by a colour change (deep blue to bright orange)
Figure 18 – Reaction mixture before (left) and after (right) electrophile addition The last step in this reaction is the acid-promoted debenzotriazolylation, achieved by the addition of diluted acetic and perchloric acid. The addition of these acids also promotes the hydrolysis of the acetate group, yielding the car-boxylic acid.
45
1.4. Synthesis of 4-(bromomethyl)acetophenone (4)
The first step in this synthetic route was the bromination of 4-methylaceto-phenone using the Wohl-Ziegler reaction, this reaction follows a radical pathway and allows to selectively bromate benzylic C-H bonds.
Scheme 11 –Wohl-Ziegler bromination reaction
It is very important to keep the concentration of Br2 and HBr low to prevent
side reactions. These reagents are therefore generated in situ from N-bromosuc-cinimide (NBS). To kick-start the reaction a radical initiator is used: Azobisisobu-tyronitrile (AIBN).
When heated, AIBN decomposes eliminating a molecule of nitrogen gas to form two 2-cyanoprop-2-yl radicals:
Scheme 12 –Decomposition of AIBN
It is important that the NBS sample have already some Br2 present to start
the reaction. Pure NBS have a white colour but with time and/or moisture it starts to become yellow, this is an indication of Br2 presence and it is preferable
to use such sample.
In the initiation step of this reaction, the 2-cyanoprop-2-yl radicals react with Br2 molecules to generate Br radicals.
46 The propagation reaction can be divided in two steps: (i) first the bromine radical breaks the C-H bond, forming the benzylic radical and HBr (ii) then the benzylic radical attacks Br2 to re-generate bromine radical.
Scheme 14 –Propagation steps
After the initial Br2 molecules are consumed, Br2 starts to be generated from
the reaction between HBr and NBS.
Scheme 15 –Generation of Br2 from NBS
Since one equivalent of HBr generates one equivalent of Br2, bromide will
be generated only after the completion of the first propagation step, this keeps the concentration of Br2 low.
NBS is poorly soluble in acetonitrile and the resulting succinimide is insol-uble and floats to the surface. This keeps the concentration of reagents low and is a signal that the reaction is finished.
47
1.5. Synthesis of (4-Acetylphenyl)acetonitrile (5)
After the bromination reaction the bromine was exchanged with a cyanide group, making a new C-C bond. This reaction is a simple nucleophilic substitu-tion.
Scheme 16 – Nucleophilic substitution of Br for CN
Although being a simple reaction, it is a very dangerous one due to the for-mation of hydrogen cyanide, a colourless, extremely poisonous and flammable liquid that boils slightly above room temperature.
One way to minimize the risk of working with cyanide, is to perform the reaction in a closed apparatus, with a gas outlet connected to a trap containing an alkaline solution of potassium permanganate. In this way, any HCN gas that escapes the reaction vessel, must first pass through the potassium permanganate solution, were it is oxidized to potassium cyanate, a much safer to handle salt.
48
1.6. Synthesis of (4-Acetylphenyl)acetic acid (6)
The last step was the transformation of the nitrile group into a carboxylic acid, this was done by acid catalysed hydrolysis.
Scheme 17 –Acid catalysed hydrolysis reaction
49
1.7. Synthesis of 4’-methylcarboxyflavylium (7)
Using the acetophenone (6), it was synthesized a flavylium salt by a simple condensation reaction with 2-hidroxybenzaldehyde, as described for compound (1).
Scheme 18 –Condensation reaction of (4-Acetylphenyl)acetic acid with 2-hidroxybenzaldehyde
This flavylium salt was also precipitated with ethyl ether, with a reaction yield of almost 80%.
50
1.8. Synthesis of 7-hydroxy-4’-methylcarboxyflavylium (8)
In order to synthesize a more stable flavylium, the previous reaction was repeated using 2,4-dihydroxybenzaldehyde. This allowed for the integration of a hydroxyl group in the position 7.
Scheme 19 – Condensation reaction of (4-Acetylphenyl)acetic acid with 2,4-hidroxybenzalde-hyde
The final flavylium was precipitated as described before, but with a lower yield: 38%. The compound structure was confirmed by NMR, elemental analysis and mass spectroscopy (ESI/MS). This flavylium was then used to functionalize CQDs.
Table 2 –Elemental analysis of 7-hydroxy-4’-methylcarboxyflavylium
Formula: C23H17ClO4•H2O
Calculated Determined
C: 52.88 C: 52.64
51
Figure 19 –Mass spectroscopy of 7-hydroxy-4’-methylcarboxyflavylium
1.9. Synthesis of 4’-methylcarboxychalcone (9)
In order to synthesize a flavylium substituted in the position 4 another syn-thetic approach was needed. The first step was the synthesis of a chalcone con-taining the carboxylic tail. This was accomplished by the same condensation re-action as reported before for compounds (1), (7) and (8), but this time the rere-action was done in alkaline medium.
Scheme 20 –Condensation reaction of 4-Acetylphenyl)acetic acid with benzaldehyde
52
1.10. Synthesis of 7-hydroxy-4’-methylcarboxy-4-phenylflavylium (10)
Using the chalcone synthesized in the previous reaction, it was possible to synthesized a flavylium with a carboxylic tail in position 4’ and a phenyl ring in position 4. This was accomplished by making another condensation reaction with resorcinol, in acidic conditions.
Scheme 21 –Condensation reaction of 4’-methylcarboxychalcone with resorcinol
Chloranil, also known as tetrachloro-1,4-benzoquinone, is a chlorinated quinone that can be used as a mild oxidant and serves as a hydrogen acceptor in aromatization reactions. In this reaction, the presence of chloranil facilitates the ring closure needed to form the flavylium.
In this reaction, HCl was chosen instead of tetrafluorboronic acid used in previous flavylium synthesis. Robinson and Walker38 reported a similar reaction,
in which he used HCl to make a flavylium cation substituted in the position 4. Moreover, in our lab, flavylium synthesized using HCl gas usually have higher reaction yields. This HCl gas is normally generated using the Sulfuric Acid (H2SO4) method, in which an aqueous solution of HCl is added drop-wise to a
flask containing an aqueous solution of H2SO4, when the two solutions mix the
HCl solubility in water is decreased and HCl gas is released.
This way of generating HCl gas can be as efficient as 90%, however it re-quires the use of a complex apparatus, the need for additional security precau-tions, and produce more waste, mainly H2SO4. For these reasons, it was used a
53 Since this is a new flavylium its structure was confirmed by elemental anal-ysis and mass spectroscopy.
Table 3 –Elemental analysis of 7-hydroxy-4’-methylcarboxy-4-phenylflavylium
Formula: C23H17ClO4•(1/2)H2O
Calculated Determined
C: 68.75 C: 68.91
H: 4.51 H: 4.88
Figure 20 –Mass spectroscopy of 7-hydroxy-4’-methylcarboxy-4-phenylflavylium
F:FTMS + c ESI SIM ms [347.11-367.11]
348 349 350 351 352 353 354 355 356 357 358 359 360 361 362 363 364 365 366 367 m/z 0 5 10 15 20 25 30 35 40 45 50 55 60 65 70 75 80 85 90 95 100 357.11175 358.11475 359.11750 362.32511 352.25987 353.26680
54
1.11. UV-Vis titration of 7-hydroxy-4’-methylcarboxyflavylium (8)
A solution of 7-hydroxy-4’-methylcarboxy-4-phenylflavylium was pre-pared in water at pH 1 and 1 mL of this solution was transferred to several plastic cuvettes containing 1 mL of NaOH 1 M and 1 mL of phosphate buffer with dif-ferent pH values. Absorption spectra was obtained for each cuvette immediately after flavylium addition (Figure 21). This technique is known as pH jump and it allows to study the formation and disappearing of intermediate species, like the quinoidal base.
Figure 21 –Absorption spectra of 7-hydroxy-4’-methylcarboxyflavylium (8) after pH jump, as a function of pH, from pH 0.58 to 8.73. Arrows indicate the absorbance variation with increase in
pH
After pH jump, two main absorption bands are observed in the visible re-gion, one at 490 nm and other at 440 nm. The band at 440 nm can be attributed to the flavylium cation AH+since it’s the major band at low pH and disappear with
the increase in pH. Similarly, the band at 490 nm can be attributed to the quinoidal base A, the absorption of this band increase with the pH and is red-shifted. It is also observed an isosbestic point at 460 nm (wavelength at which the total absorbance of the sample does not change).
0 0.2 0.4 0.6 0.8
300 350 400 450 500 550
Abso
rb
a
n
ce
55 The cuvettes were left in the dark overnight to equilibrate and the absorp-tion spectra was recorded in the next day. (Figure 22) Again, two main absorpabsorp-tion bands were observed in the visible region, one at 440 nm and other at 370 nm.
The band at 440 nm has its maximum intensity at pH 0.58 and can be as-signed to AH+ since it is the only species stable at this low pH. With the increase
in pH, this band disappears and gives rise to the band at 370 nm, which was not visible after the pH jump. This indicates that the species responsible for such band must have been formed during the equilibrium, so it can be assigned to the
Ct species, since this is the most stable species when the system reaches the ther-modynamic equilibrium. The absorption in the UV is also compatible with a chal-cone species.
At basic pH (> 7), it is also possible to see the formation of a broad absorp-tion band centred at 445 nm (Figure 22, dashed lines), this band is probably due to the formation of Ct-, since the increase in this band is accompanied by a
de-crease in the Ct band.
Figure 22 – Absorption spectra of 7-hydroxy-4’-methylcarboxyflavylium (8) after equilibrate in the dark, as a function of pH, from pH 0.58 to 6.6 (solid lines) and from pH 7.04 to 8.73 (dashed lines). Arrows indicate the absorbance variation with increase in pH
The isosbestic point located at 460 nm disappeared and a new isosbestic point appeared at 395 nm.
0 0.2 0.4 0.6
300 350 400 450 500 550
Abso
rb
a
n
ce
56 The various flavylium equilibria in aqueous solution can be described as:
(eq 1)
Immediately after pH jump, we can consider a simple acid-base equilibrium between the flavylium cation AH+ and the quinoidal base A:
(eq 2)
The mole fractions of these species, as a function of pH, can be calculated using the following equations:
χAH+ = [H
+]
[H+] + Ka
(eq 3)
χA= [H+Ka] + Ka
(eq 4)
After equilibrate in the dark, we have to consider the formation of other species and can ignore the presence of A:
(eq 5)
The mole fractions of these species, as a function of pH, can be calculated using the following equations:
𝛘𝐀𝐇+ = [𝐇
+]𝟐
[𝐇+] + [𝐇+]𝐊′𝐚+ 𝐊′𝐚𝐊𝐜𝐭−
(eq 6)
𝛘𝐂𝐭 = [𝐇
+]𝐊′𝐚
[𝐇+] + [𝐇+]𝐊′𝐚+ 𝐊′𝐚𝐊𝐜𝐭−
(eq 7)
𝛘𝐂𝐭− = 𝐊′𝐚𝐊𝐜𝐭−
[𝐇+] + [𝐇+]𝐊′𝐚+ 𝐊′𝐚𝐊𝐜𝐭−
57 The equilibrium constants Ka, K’a, and Kct- can be determined by fitting the
absorbance at the flavylium absorption maximum (440nm), calculated using (eq 9), with the experimental data. (Figure 23)
A = χAH+×AAH++ χ𝐴×A𝐴+ χCt×ACt+ χCt−×ACt−
(eq 9)
Figure 23 –Variation of absorbance at 440nm: experimental values after pH jump (▲) and after equilibrate in the dark (■); and values calculated using equation 5, after pH jump (dashed line) and after equilibrate in the dark (solid line)
Fitting was achieved for pKa = 3.54 (Ka = 2.85 × 10⁻⁴), after pH jump, and for
pK’a = 2.53 (K’a = 2.96 × 10⁻³) and pKct- = 8.17 (Kct- = 6.80 × 10⁻⁹), after equilibrate
in the dark.
Figure 24 –Mole fraction distribution as a function of pH for the 7-hydroxy-4’
-methylcarbox-yflavylium compound, after pH jump (dashed lines) and after equilibrate in the dark (solid lines)
0 0.2 0.4 0.6
0 1 2 3 4 5 6 7 8 9
A440 n n pH 0 0.2 0.4 0.6 0.8 1
0 1 2 3 4 5 6 7 8 9
M o le fr a cti o n pH
58
1.12. UV-Vis titration of 7-hydroxy-4’-methylcarboxy-4-phenylflavylium (10)
The UV-Vis titration was made using the pH jump technique described in 1.11. The obtained absorption spectra are represented in Figure 25.
Figure 25 – Absorption spectra of 7-hydroxy-4’-methylcarboxy-4-phenylflavylium after pH jump, as a function of pH, from pH 0.60 to 9.28. Arrows indicate the absorbance variation with
increase in pH, for the solid lines
Similar to flavylium (8), after pH jump two main absorption bands are ob-served in the visible region, one at 490 nm and other at 440 nm. The band at 440 nm can again be attributed to the flavylium cation AH+since it’s the major band
at low pH and disappear with the increase in pH. Similarly, the band at 490 nm can be attributed to the quinoidal base A since the absorption of this band in-crease with the pH and coincide with the disappearing of AH+. Furthermore, is
well known that quinoidal bases present a red-shifted absorbance related to the flavylium cation. It is also observed an isosbestic point at 460 nm.
The cuvettes were left in the dark overnight to equilibrate and the absorp-tion spectra was recorded in the next day (Figure 26). Again, two main absorpabsorp-tion bands were observed in the visible region, one at 490 nm and other at 400 nm. In the pH range 0.60 – 8.34 there is no significant change in the absorption spectra after the system reached equilibrium. This was expected since it is well known that the addition of a phenyl ring (or a methyl group) in position 4 stabilizes the
0 0.1 0.2 0.3 0.4
300 350 400 450 500 550 600
59
AH+ species and make the quinoidal base A both the kinetic and the
thermody-namic product in a wide pH range. Only at pH 8.92 the A band started to decrease (Figure 26, dashed lines), presumably because of the formation of Ct, however, no absorption band of this species were detected.
Figure 26 –Absorption spectra of 7-hydroxy-4’-methylcarboxy-4-phenylflavylium (8) after equil-ibrate in the dark, as a function of pH, from pH 0.60 to 8.34 (solid lines) and from pH 8.92 to 9.28 (dashed lines). Arrows indicate the absorbance variation with increase in pH, for the solid lines
Mole fractions were calculated as described in 1.11.
Figure 27 –Variation of absorbance at 440nm: experimental values after pH jump (▲) and after equilibrate in the dark (■); and values calculated using (eq 5), after pH jump (dashed line) and after equilibrate in the dark (solid line)
0 0.1 0.2 0.3 0.4
300 350 400 450 500 550 600
Ab sor ba nc e Wavelenght (nm) 0 0.1 0.2 0.3 0.4
0 1 2 3 4 5 6 7 8 9 10
A440
n
m
60 Fitting was achieved for pKa = 4.03 (Ka = 9.26 × 10⁻⁵), after pH jump, and for
pKa = 4.17 (Ka = 6.69 × 10⁻⁵) and pK’a= 9.66 (K’a = 2.18 × 10⁻¹⁰), after equilibrate in
the dark.
Figure 28 –Mole fraction distribution as a function of pH for the 7-hydroxy-4’
-methylcarboxy-4-phenylflavylium compound, after pH jump (dashed lines) and after equilibrate in the dark (solid lines)
0 0.2 0.4 0.6 0.8 1
0 1 2 3 4 5 6 7 8 9 10
M
o
le
fr
a
cti
o
n
pH
61
1.13. Fluorescence of 7-hydroxy-4’-methylcarboxy-4-phenylflavylium (10)
Steady state fluorescence measurements were performed in order to fully characterize the optical proprieties of 7-hydroxy-4’ -methylcarboxy-4-phe-nylflavylium, the same solutions used in the UV-Vis titration were used. Each solution was transferred to a quartz fluorescence cell before spectra acquisition.
In order to compare the emission of AH+ and A, the fluorescence emission
spectra were recorded exciting at the isosbestic point, 460 nm. (Figure 29)
Figure 29 –Fluorescence emission spectra at the excitation wavelength 460 nm (isosbestic point) as a function of pH, from 0.60 to 9.28
Even at low pH values (0.60), there is only a major broad emission band centred around 600 nm. At 480 nm, there is a slight emission band that decreases with the increase in pH, indicating that this band might originate from the AH+
species. That means the broad emission band at 600 nm must be the emission from the base A, which makes sense since it is well known that in phenols the fluorescence emission from the basic species is red-shifted in comparison with the emission from the acidic one.
However, as determined before by UV-Vis titration, at low pH there is only
AH+ present in solution, so, the emission observed from the base, at low pH,
must arise from excited state proton transfer (ESPT), from AH+ to A. This was
confirmed by the florescence excitation spectra collected monitoring the emission at 600 nm. (Figure 30)
0 0.2 0.4 0.6 0.8 1
470 520 570 620 670 720 770
62 These excitation spectra almost coincide with the absorption spectra (Figure 26), indicating that the base emission arises from ESPT, at low pH values, and as the pH increases it originate from direct base excitation.
Figure 30 –Fluorescence excitation spectra collecting at 600nm (A emission) as a function of pH, from 0.60 to 9.28
In order to observe emission from AH+ species, fluorescence spectra were
recorded exciting only the flavylium cation, at 430 nm. (Figure 31)
Figure 31 –Fluorescence emission spectra at the excitation wavelength 430 nm (AH+) as a
func-tion of pH, from 0.60 to 9.28
Even exciting at 430 nm, the major emission band continues to be the emis-sion from the base species, indicating a very efficient ESPT. There is a small band around 490-510 nm that can be the emission of flavylium cation.
0 0.2 0.4 0.6 0.8 1
300 350 400 450 500 550
No rm a li ze d i n te n si ty Wavelength (nm) 0 0.2 0.4 0.6 0.8 1
440 490 540 590 640 690 740 790
63
Flavylium-Functionalized CQDs
In this chapter, it is discussed the functionalization of CQDs with two dif-ferent novel flavylium salts. The functionalization was made by covalently at-taching flavylium salts at the CQDs surface. This was accomplished using EDC as a crosslinking agent between the flavylium carboxyl tail and primary amines present at CQDs surface.
The CQDs functionalized with 7-hydroxy-4’ -methylcarboxy-4-phe-nylflavylium were then submitted to the same optical characterization as dis-cussed before for the free CQDs and flavylium, in order to understand how the attachment of flavylium at the CQD surface influence these optical proprieties.
64
1.1. Functionalization of CQDs with flavylium salts
The QCDs functionalization were performed as described before, using EDC and NHS to covalently bond the flavylium carboxyl tail to primary amines at CQD surface, forming an amide.
Scheme 22 –General scheme for crosslinking reaction using EDC and NHS
65
1.2. CQDs functionalized with 7-hydroxy-4’-methylcarboxy-4-phenylflavylium
First, the flavylium functionalized CQDs were characterized by UV-Vis ti-tration. This titration was made using the pH jump technique described before. The obtained absorption spectra are represented in Figure 32.
Figure 32 –Absorption spectra of CQDs functionalized with 7-hydroxy-4’
-methylcarboxy-4-phenylflavylium after equilibrate in the dark, as a function of pH, from pH 0.57 to 7.98. Arrows indicate the absorbance variation with increase in pH. Inset: Mole fraction of AH+ and A
Similar to the UV-Vis titration of the free flavylium, two main absorption bands are observed in the visible region, one at 490 nm and other at 440 nm. The band at 440 nm can again be attributed to the flavylium cation AH+ and the band
at 490 nm can be attributed to the quinoidal base A. It is also observed an isos-bestic point at 460 nm.
Fitting was achieved for pKa = 4.05 (Ka = 8.93 × 10⁻⁵), which represent a
shift in pKa of only 0.02, compared to free flavylium. Therefore, is possible to conclude that the attachment of CQDs did not disturbed the equilibrium between
AH+ and A.
0 0.04 0.08 0.12 0.16
300 350 400 450 500 550 600 650
Abso rb a n ce Wavelenght (nm) 0 0.2 0.4 0.6 0.8 1
0 1 2 3 4 5 6 7 8
66
Figure 33 –Variation of absorbance: experimental values at 490 nm (▲) and at 435 nm (■); and
values calculated using (eq 9), at 490 nm (dashed line) and at 435 nm (solid line)
Steady-state fluorescence measurements were also made in order to study how CQDs functionalization influenced the photoluminescence properties.
Figure 34 –Fluorescence emission spectra at the excitation wavelength 460 nm (isosbestic point)
as a function of pH, from 0.57 to 7.98
0 0.04 0.08 0.12 0.16
0 1 2 3 4 5 6 7 8
Abso rb a n ce pH 0 0.2 0.4 0.6 0.8 1
470 520 570 620 670 720