Article
0103 - 5053 $6.00+0.00*e-mail: [email protected]
Lipid Fraction Quality Evaluation of Brazilian Meat-based Products
Sueli R. Baggioa and Neura Bragagnolo*,b
aInstituto de Tecnologia de Alimentos, Centro de Pesquisa e Desenvolvimento de Química de Alimentos e
Nutrição Aplicada, Av. Brazil 2880,13070-178 Campinas-SP, Brazil
bDepartamento de Ciência de Alimentos, Faculdade de Engenharia de Alimentos,
Universidade Estadual de Campinas, 13083-862 Campinas-SP, Brazil
A fração lipídica de produtos cárneos foi avaliada através das análises de colesterol, óxidos
de colesterol e a composição em ácidos graxos, com ênfase nos isômeros trans. Foram analisados
126 amostras, sendo 45 de produtos cárneos bovinos, 36 de produtos cárneos suínos e 45 de produtos cárneos mistos. O colesterol e os óxidos de colesterol foram determinados por HPLC. A composição em ácidos graxos foi determinada por cromatografia gasosa usando coluna capilar
CP-SIL 88. O 7-cetocolesterol (µg g-1) foi encontrado em uma amostra de hambúrguer (3.2),
em duas amostras de salsichas (1.6 e 2.0) e em uma amostra de mortadela(2.6). Quantidades
significantes de ácidos graxos trans foram encontradas em dois produtos cárneos bovinos. O teor
de colesterol variou de 220 no apresuntado a 590 mg kg-1 no salame e o lipídio total de 28 no
presunto a 250 g kg-1 no salame. A baixa degradação oxidativa da fração lipídica pode ser atribuída
à presença do antioxidante eritorbato de sódio nas amostras.
Lipid fraction components of meat-based products were evaluated by analysis of cholesterol,
cholesterol oxidation products and fatty acid composition, with emphasis in the trans isomer. 126
samples were analyzed: being 45 of processed beef products, 36 of pork products and 45 of mixed meat products. Cholesterol and cholesterol oxides were determined by HPLC. The fatty acids
were determined by gas chromatography using a CP-SIL 88 capillary column. 7-ketocholesterol
(µg g-1) was found in one sample of hamburger (3.2), in two samples of frankfurter (1.6 and 2.0)
and in one sample of mortadella(2.6). Significant amounts of trans fatty acids were found in two
processed beef products. The cholesterol content varied from 220 in the spam to 590 mg kg-1 in
the salami and the total lipid contents from 28 in the ham to 250 g kg-1 in the salami. The low
oxidative degradation of the lipid fraction could be attributed to the presence of the antioxidant sodium erythorbate in the samples.
Keywords: meat products, cholesterol oxide, cholesterol, fatty acids, lipids
Introduction
The international scientific community gives a special emphasis to lipid fraction in the definition of the quality characteristics of meat-based products. Lipid oxidation in food affects the quality and the safety of the human diet by generation of compounds with biological activities that can adversely affect health. Cholesterol can be found in foods associated with other lipids and fatty acids. The extent of cholesterol oxidation in foods depends on the lipid composition, especially the polyunsaturated fatty acid content.1 According to Smith,2 the hydroperoxides formed
from polyunsaturated fatty acids during lipid oxidation
may be necessary to initiate cholesterol oxidation, and may increase cholesterol oxidation synergically. Osada et al.3
showed that cholesterol oxidation increased as the linoleic acid content decreased. 7-ketocholesterol has been used as an indicator of cholesterol oxidation since it is produced in the initial stages of cholesterol oxidation.4
Cholesterol oxidation in processed foods deserves considerable attention with respect to the implications of how cholesterol oxides might affect human health. Various studies carried out with model cell systems and with animals have shown the potential of these compounds to produce adverse effects to human health.5, 6 Cholesterol
Some processed meat products, such as meatballs and hamburger, may contain hydrogenated fat in their composition, thus becoming a potential source of trans
fatty acids. In addition to the industrial hydrogenation of vegetable oils, trans fatty acids are formed by bacterial action in the rumen of ruminants,9 so these fatty acids
are found in the meat and milk fat of such animals and in products containing hydrogenated vegetable oil. Diets with high trans fatty acid contents are considered to be hypercholesteremic and are associated with the development of arteriosclerosis and heart diseases.10
The two main parameters currently used to assess nutritional quality in foods lipid fraction are polyunsaturated/ saturated (P/S) and n6/n3 polyunsaturated fatty acids (PUFA) ratios. The P/S ratio is recommended, nowadays, to be above 0.4511 in order to prevent both, an excess of
saturated and of polyunsaturated fatty acids. The excess of saturated fatty acids is related to the increase of LDL cholesterol plasmatic level and some polyunsaturated fatty acids are precursors of powerful clotting agents and also are involved in the etiology of some cancers. The ideal n6/n3 PUFA ratio in the daily diet has still not been quite established; however the British Department of Health11
suggests an optimal balance below of 4 to avoid the prothrombotic and proagregatory state induced by a high level of n6/n3 PUFA. In addition, a balanced n6/n3 ratio in the diet is important for normal growth and development and should lead to decrease in cardiovascular disease and other diseases and should improve mental health.12
The objective of this research was evaluated components of the lipid fraction of Brazilian meat-based products based on measuring the cholesterol oxidation products and trans
fatty acids. Furthermore, was determined the levels of cholesterol, total lipids and the composition of fatty acids.
Experimental
Materials
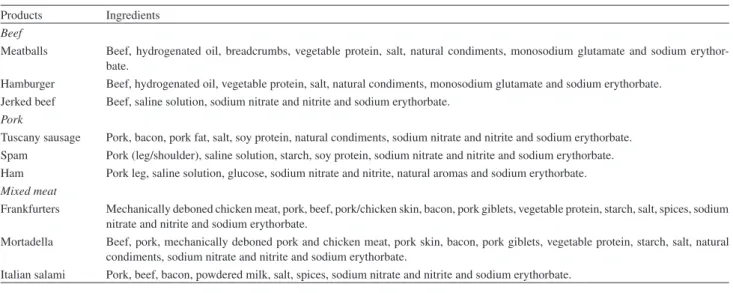
Processed beef products (meatballs, hamburger and jerked beef), pork products (Tuscany sausage, traditional spam and traditional ham) and mixed meat products (frankfurters, traditional mortadella and Italian type salami) were analyzed. The last group was called mixed because their meat composition consisted of beef, pork and mechanically deboned poultry meat in the case of frankfurters and beef and pork in the case of the mortadella and Italian salami. Table 1 shows the basic composition of these products.
For each product, five different commercial brands were analyzed with the exception of the jerked beef, for which only two brands were analyzed. Three batches with different expired dates of each commercial brand were analyzed and each sample consisted of three units of the same batch.
The samples were analyzed immediately after their acquisition from supermarkets in the city of Campinas, State of Sao Paulo, Brazil. The samples were ground up and homogenized in a multiprocessor until a homogenous mass was obtained and 50 g aliquots were taken in duplicate for the analyses.
Methods
The lipids were extracted and determined as described by Folch et al.13 The cholesterol oxides and cholesterol were
determined according to the method described by Baggio
et al.14 using high performance liquid chromatography
(HPLC). An HPLC apparatus (Shimadzu, Kyoto, Japan),
Table 1. Basic composition of processed meat products
Products Ingredients Beef
Meatballs Beef, hydrogenated oil, breadcrumbs, vegetable protein, salt, natural condiments, monosodium glutamate and sodium erythor-bate.
Hamburger Beef, hydrogenated oil, vegetable protein, salt, natural condiments, monosodium glutamate and sodium erythorbate. Jerked beef Beef, saline solution, sodium nitrate and nitrite and sodium erythorbate.
Pork
Tuscany sausage Pork, bacon, pork fat, salt, soy protein, natural condiments, sodium nitrate and nitrite and sodium erythorbate. Spam Pork (leg/shoulder), saline solution, starch, soy protein, sodium nitrate and nitrite and sodium erythorbate. Ham Pork leg, saline solution, glucose, sodium nitrate and nitrite, natural aromas and sodium erythorbate. Mixed meat
Frankfurters Mechanically deboned chicken meat, pork, beef, pork/chicken skin, bacon, pork giblets, vegetable protein, starch, salt, spices, sodium nitrate and nitrite and sodium erythorbate.
Mortadella Beef, pork, mechanically deboned pork and chicken meat, pork skin, bacon, pork giblets, vegetable protein, starch, salt, natural condiments, sodium nitrate and nitrite and sodium erythorbate.
consisting of a quaternary solvent delivery system (LC-10ATVP) and equipped with a Rheodyne injector valve, a 20 µL fixed loop, a photodiode array (SPD-M10AVP) and a refractive index (RID-10A) detectors, a oven heated column (CTO-10ASVP) and a software (CLASS – LC 10), was employed for the analysis. Separation was achieved on a Nova Pak CN HP column (300 x 3.9 mm column, 4 µm; Waters, Milford, MA, USA) at 32 oCand preceded by
a Hypersil BDS CN guard column (7.5 x 4.6 mm, 5 µm). The mobile phase consisted of hexane/isopropanol (96+4) at a flow rate of 1.0 mL min-1. Absorption spectra were taken
from 200 to 400 nm and the chromatograms at 210 nm. The standard of cholesterol, cholesta-4,6-dien-3-one, 20α-hydroxycholesterol, 25-hydroxycholesterol, 7-ketocholesterol, 5,6α and 5,6β-epoxycholestrol and 7β-hydroxycholesterol were purchased from Sigma Chemical Company (St. Louis, MO, USA). 7α-Hydroxycholesterol was obtained from Steraloids Inc. (Wilton, CT, USA).
Cholesterol and its oxides were identified on the basis of the retention time of known standards, co-chromatography and the characteristics of the absorption spectrum. The identities were confirmed using a gas chromatograph-mass spectrometer.15 Quantification was achieved by
using external standards, with a concentration range from 0.5 to 2.22 mg mL-1 for cholesterol and from 0.5
to 64.0 µg mL-1 for the cholesterol oxides. Cholesterol
and 5,6α e 5,6β-epoxycholesterol were quantified using a refractive index detector, since in this case cholesterol is better separated from interfering substances and 5,6α e 5,6β-epoxycholesterols because they do not absorb ultraviolet light. The other cholesterol oxides were quantified using the photodiode array detector.
The accuracy of the method was evaluated from the recovery by adding 10 mg of cholesterol and 40 µg of 7-ketocholesterol to 50 g of the sample. The percent recoveries for cholesterol and 7-ketocholesterol were 90.2 ± 0.2 % and 91.2 ± 0.0 %, respectively. The values for the coefficient of variation between duplicates of the samples varied from 0.0 to 0.04 % for 7-ketocholesterol, demonstrating the good precision of the method. The detection limits were 0.14 µg g-1 to 20α-hydroxycholesterol
and 25-hydroxycholesterol, 0.12 µg g-1 to 5,6α and
5,6β-epoxycholestrol and 7α and 7β-hydroxycholesterol and 0.09 µg g-1 to 7-ketocholesterol and
cholesta-4,6-dien-3-one, calculated according to Keith et al.16
The fatty acid methyl esters were prepared according to Hartman and Lago17 and analyzed by gas chromatograph
(Konik HRGC, model 4000A, Barcelona, Spain) equipped with a flame ionization detector and workstation (Borwin, Fontaine, France). Chromatography was performed using a
fused silica capillary column (50 m x 0.25 mm i.d., 0.20 µm film thickness) (CP-SIL 88, Chrompack, Middelburg, The Netherlands). The initial column temperature was 180 °C for 2 minutes and then programmed to increase at 5 oC min-1
to 225 oC; the injector temperature was set at 270 oC and the
detector temperature at 300 oC. The split ratio was 1/75. The
carrier gas was hydrogen at a flow rate of 0.5 mL min-1 and
nitrogen was used as the make-up gas at 30 mL min-1. The
fatty acids were identified by comparison of the retention times of the sample with those of the standards and by spiking. To verify the identity and accuracy of the method a total of 37 saturated, monounsaturated and polyunsaturated fatty acid standards (37 FAME Mix 47885-U, SulpecoTM,
Bellefonte, PA, USA) were used. Quantification was done as area percentages.
Results and Discussion
Cholesterol oxides
Amongst all the cholesterol oxides examined (cholesta-4,6-dien-3-one, 20α-hydroxycholesterol, 2 5 - h y d r o x y c h o l e s t e r o l , 7 - k e t o c h o l e s t e r o l ,
7β-hydroxycholesterol, 7α-hydroxycholesterol,
5,6α-epoxycholesterol and 5,6β-epoxycholesterol) in the various samples of processed meat products analyzed, only 7-ketocholesterol was found in only 4 samples, which were one brand of hamburger, two brands of frankfurters and one brand of mortadella. The content of 7-ketocholesterol varied from 1.6 in the frankfurter to 3.2 µg g-1 in the
hamburger.
Many authors have shown that 7-ketocholesterol is produced in the initial stages of the oxidation process, and can therefore be used as an indicator of cholesterol oxidation.4 Considering that a total of 126 samples
were analyzed and only 4 showed the presence of 7-ketocholesterol, presumably the oxidation process had not been initiated due probable to the presence of the antioxidant sodium erythorbate and the sodium nitrate and nitrite in the samples (Table 1). According to Tai et al.,18 the formation of cholesterol oxidation products can
be avoided or reduced by using appropriate concentrations of antioxidants. Osada et al.,3 concluded that cholesterol
oxidation in sausage was inhibited by the addition of sodium nitrite and apple polyphenols, through the stabilization of coexisting polyunsaturated fatty acids and radical scavenging. Zanardi et al.19 observed that the
presence of ascorbic acid and/or nitrite were important for cholesterol protection in fermented sausages. Torres et al.,20 working with jerked beef prepared using refined salt
reduction in the cholesterol oxide concentrations present, as compared to samples prepared without the addition of antioxidants. Park and Addis21 also failed to find cholesterol
oxides in hamburger, jerked beef or liver sausage. According to Paniangvait et al.,1 the extent of cholesterol
oxidation depends on the lipid composition, principally on the polyunsaturated fatty acid content. Among products containing 7-ketocholesterol, mortadellasand frankfurters showed the highest polyunsaturated fatty acid contents (Table 7). However, the hamburger sample containing 7-ketocholesterol showed one of the lowest polyunsaturated fatty acid contents (Table 3). According to some authors, the presence of sodium nitrite may be related to the stability of polyunsaturated fatty acids against various oxidative factors.22,23 Only meatballs and hamburgers did not contain
sodium nitrate and nitrite (Table 1).
The literature reports the incidence of oxides in processed meat products.19,24-28 However, some samples
have no addition of antioxidants and others do not indicate whether antioxidants were present in the formulation.
Processed beef products
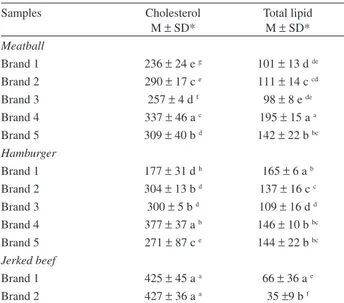
Table2 shows the cholesterol and total lipid contents in the samples of meatballs, hamburger and jerked beef of the different brands. The cholesterol and total lipid contents were significantly different between different brands of meatball, varying from 236 ± 24 (Brand 1) to 337 ± 46
mg kg-1 (Brand 4) and from 98 ± 08 (Brand 3) to 195 ± 15
g kg-1 (Brand 4), respectively. In the hamburger samples
the cholesterol content varied from 177 ± 31 (Brand 1) to 377 ± 37 mg kg-1 (Brand 4) and the total lipid content
from 109 ± 16 (Brand 3) to 165 ± 6 g kg-1 (Brand 1), there
being no significant difference between brands. The jerked beef samples did not present significant differences for cholesterol content, giving average values of 426 ± 40 mg kg-1. The total lipid contents varied from 35 ± 9 to 66 ±
36 mg kg-1.
The cholesterol and total lipid contents varied significantly between the different processed beef products from 177 to 427 mg kg-1 and 35 to 195 g kg-1,
respectively.
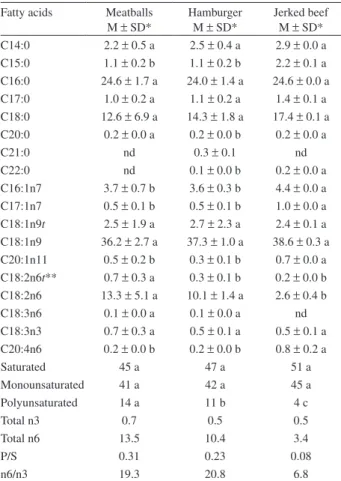
Table 3 shows the fatty acids (% area) found in the processed beef products. The main fatty acids found were: C18:1n9, C16:0, C18:0, C18:2n6, C16:1n7 and C14:0. Considering the total lipid contents of the samples analyzed, the fatty acids C16:0, C18:0 and C18:1n9 were found in greater amounts in the hamburger. The meatballs showed the highest amounts of C18:2n6 and the jerked beef the lowest amounts of the main fatty acids found. With respect to the minor fatty acids, the fatty acids C21:0 and C22:0 were not detected in the meatballs and C21:0 and C18:3n6 were absent in the jerked beef.
The trans fatty acid isomers C18:1n9 and C18:2n6 (9c, 12t + 9t, 12c) were detected in all the analyzed samples. The C18:1n9t contents detected varied from 1 g kg-1 in
the jerked beef to 4 g kg-1 in the hamburger. The greatest
amounts of C18:2n6t were found in the meatball (0.9 g kg-1)
and the smallest in the jerked beef (0.1 g kg-1).
The saturated and monounsaturated fatty acid concentrations found in the jerked beef, meatballs and hamburger were about 26 and 23; 58 and 53; and 66 and 59 g kg-1 product, respectively. The polyunsaturated fatty
acid contents were lowest in the jerked beef (2 g kg-1) and
highest in the meatballs (18 g kg-1). In the present study, the
polyunsaturated/saturated fatty acid ratio was lowest in the jerked beef (0.08) and highest in the meatballs (0.31). The C18:3n3 was the only n3 fatty acid found in the processed beef products, varying from 20 mg kg-1 in the jerked beef
to 90 mg kg-1 in the meatball. The n6/n3 ratio was lowest in
the jerked beef (6.8) and highest in the hamburger (20.8).
Processed pork products
The results in Table 4show the amounts of cholesterol and total lipids found in the Tuscany sausage, spam and ham samples of the five different brands. The amount of cholesterol in the sausages varied from 274 ± 33 (Brand 1) to 367 ± 3 mg kg-1 (Brand 3), with no significant difference
Table 2. Cholesterol (mg kg-1) and total lipid (g kg-1) contents of the
processed beef meat products
Samples Cholesterol
M ± SD*
Total lipid M ± SD* Meatball
Brand 1 236 ± 24 e g 101 ± 13 d de
Brand 2 290 ± 17 c e 111 ± 14 c cd
Brand 3 257 ± 4 d f 98 ± 8 e de
Brand 4 337 ± 46 a c 195 ± 15 a a
Brand 5 309 ± 40 b d 142 ± 22 b bc Hamburger
Brand 1 177 ± 31 d h 165 ± 6 a b
Brand 2 304 ± 13 b d 137 ± 16 c c
Brand 3 300 ± 5 b d 109 ± 16 d d
Brand 4 377 ± 37 a b 146 ± 10 b bc
Brand 5 271 ± 87 c e 144 ± 22 b bc Jerked beef
Brand 1 425 ± 45 a a 66 ± 36 a e
Brand 2 427 ± 36 a a 35 ±9 b f
between two brands. However, there was a significant difference in total lipids between the brands of sausage, varying from 134 ± 18 (Brand 4) to 290 ± 39 g kg-1 (Brand
5). The amount of cholesterol varied between 173 ± 41 (Brand 4) and 262 ± 23 mg kg-1 (Brand 5) for the spam,
with no significant difference between two brands. The total lipid contents of the spam samples varied from 39 ± 6 (Brand 3) to 80 ± 5 g kg-1 (Brand 2), two brands showing
significantly higher values. No significant difference was found for cholesterol content between the different brands of ham, the values varying from 230 ± 20 (Brand 4) to 262 ± 27 mg kg-1 (Brand 5). The total lipid contents varied
from 21 ± 2 (Brand 4) to 37 ± 10 g kg-1 (Brand 2), with no
significant difference between brands 1 and 3 and between 4 and 5. In general the sausage showed the highest values for cholesterol and total lipids, the spam the lowest values for cholesterol and the ham the lowest values for total lipids.
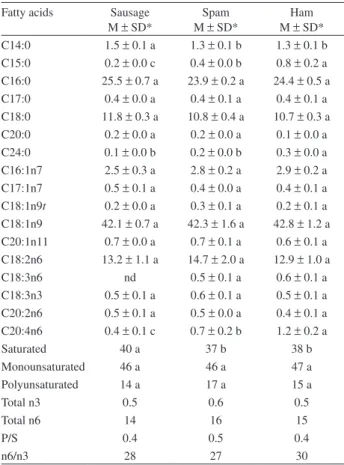
The amount of the fatty acids (% area) in the processed pork products are found in Table 5. Considering the
total lipid contents of the samples analyzed, the Tuscany sausages showed the highest values for the main fatty acids found (C18:1n9, C16:0, C18:2n6, C18:0, C16:1n7 and C14:0) and the ham, the lowest values. With respect to the minor fatty acids, the fatty acid C18:3n6 was not detected in the sausage. The C18:1n9 was the only trans isomer found in the processed pork products, varying from 6 in the ham to 40 mg kg-1 in the Tuscany sausage.
High values for saturated fatty acids (88 g kg-1),
monounsaturated fatty acids (101 g kg-1) and polyunsaturated
fatty acids (31 g kg-1) were found in the Tuscany sausage.
These values were lowest for the ham samples, being 11, 14 and 5 g kg-1, respectively. The ratio of n6/n3 and
polyunsaturated/saturated fatty acid was similar for all the samples. The ω3 fatty acid contents varied from 0.2 in the ham to 1 g kg-1 in the Tuscany sausage.
Processed mixed meat products
Table 6shows the values found for cholesterol and total lipids in the samples of frankfurters, mortadella and Italian salami of the five different brands. The cholesterol contents of the frankfurters varied from 443 ± 80 (Brand 5) to 711 ± 58 mg kg-1 (Brand 3), there were no significant difference
between four brands. The total lipid values varied from
Table 3. Fatty acid compositions (% area) of the processed beef products
Fatty acids Meatballs M ± SD*
Hamburger M ± SD*
Jerked beef M ± SD* C14:0 2.2 ± 0.5 a 2.5 ± 0.4 a 2.9 ± 0.0 a C15:0 1.1 ± 0.2 b 1.1 ± 0.2 b 2.2 ± 0.1 a C16:0 24.6 ± 1.7 a 24.0 ± 1.4 a 24.6 ± 0.0 a C17:0 1.0 ± 0.2 a 1.1 ± 0.2 a 1.4 ± 0.1 a C18:0 12.6 ± 6.9 a 14.3 ± 1.8 a 17.4 ± 0.1 a C20:0 0.2 ± 0.0 a 0.2 ± 0.0 b 0.2 ± 0.0 a
C21:0 nd 0.3 ± 0.1 nd
C22:0 nd 0.1 ± 0.0 b 0.2 ± 0.0 a
C16:1n7 3.7 ± 0.7 b 3.6 ± 0.3 b 4.4 ± 0.0 a C17:1n7 0.5 ± 0.1 b 0.5 ± 0.1 b 1.0 ± 0.0 a C18:1n9t 2.5 ± 1.9 a 2.7 ± 2.3 a 2.4 ± 0.1 a C18:1n9 36.2 ± 2.7 a 37.3 ± 1.0 a 38.6 ± 0.3 a C20:1n11 0.5 ± 0.2 b 0.3 ± 0.1 b 0.7 ± 0.0 a C18:2n6t** 0.7 ± 0.3 a 0.3 ± 0.1 b 0.2 ± 0.0 b C18:2n6 13.3 ± 5.1 a 10.1 ± 1.4 a 2.6 ± 0.4 b C18:3n6 0.1 ± 0.0 a 0.1 ± 0.0 a nd C18:3n3 0.7 ± 0.3 a 0.5 ± 0.1 a 0.5 ± 0.1 a C20:4n6 0.2 ± 0.0 b 0.2 ± 0.0 b 0.8 ± 0.2 a
Saturated 45 a 47 a 51 a
Monounsaturated 41 a 42 a 45 a
Polyunsaturated 14 a 11 b 4 c
Total n3 0.7 0.5 0.5
Total n6 13.5 10.4 3.4
P/S 0.31 0.23 0.08
n6/n3 19.3 20.8 6.8
*Means and standard deviations of 30 samples in duplicate (5 brands, 3 batches, analyzed in duplicate). **(9c, 12t + 9t, 12c); nd = not detected; P/S = polyunsaturated/saturated. Values in the same line with the same letter are not significantly different at the 5% level.
Table 4. Cholesterol (mg kg-1) and total lipid (g kg-1) contents of the
processed pork products
Samples Cholesterol
M ± SD*
Total lipid M ± SD* Sausage
Brand 1 274 ± 33 d c 185 ± 53 d d
Brand 2 358 ± 53 a a 215 ± 43 c c
Brand 3 367 ± 3 a a 259 ± 30 b b
Brand 4 336 ± 16 b b 134 ± 18 e e
Brand 5 287 ± 30 c c 290 ± 39 a a Spam
Brand 1 228 ± 16 b f 45 ± 13 b h
Brand 2 220 ± 64 b f 80 ± 5 a f
Brand 3 203 ± 49 b g 39 ± 6 b h
Brand 4 173 ± 41 c h 42 ± 2 b h
Brand 5 262 ± 23 a d 74 ± 11 a g Ham
Brand 1 261 ± 30 a d 30 ±4 b hi
Brand 2 250 ± 13 a e 37 ± 10 a h
Brand 3 232 ± 21 a f 27 ± 8 b i
Brand 4 230 ± 20 a f 21 ± 2 c i
Brand 5 262 ± 27 a d 23 ± 2 c i
150 ± 5 (Brand 1) to 249 ± 6 g kg-1 (Brand 2), with no
significant difference between two brands. The cholesterol and total lipid contents in the mortadella samples showed no significant difference between four brands, varying from 394 ± 16 (Brand 4) to 498 ± 5 mg kg-1 (Brand 3) and from 185 ± 15 (Brand 1) to 236 ± 11 g kg-1 (Brand 4), respectively.
The cholesterol contents of the salami varied from 524 ± 25 (Brand 1) to 655 ± 44 mg kg-1 (Brand 2), with no significant
difference between brands 1 and 3 and between 2, 4 and 5. The total lipid contents varied from 225 ± 48 (Brand 3) to 278 ± 7 g kg-1 (Brand 4), with no significant difference between
two brands. In general, the highest cholesterol content was found in the Italian type salami and while the lowest, in the mortadella. The frankfurters showed lower total lipid contents while the salami samples were higher.
Table 7 shows the amount of the fatty acids (% area) found in the processed mixed meat products. The main fatty acids found in the frankfurter, mortadella and Italian type salami samples were: C18:1n9, C16:0, C18:2n6, C18:0 and C16:1n7. Considering the total lipid values found, the
Italian salami showed the highest values for the fatty acids C16:0, C18:0 and C18:1n9, while the fatty acids C16:1n7 and C18:2n6 showed the highest values in the mortadella. The C18:1n9 was the only trans fatty acid isomer found in the processed mixed meat products, showing similar values in the frankfurter and mortadella (0.4 g kg-1) and higher
values in the salami (1 g kg-1).
The concentrations of saturated and monounsaturated fatty acids varied, respectively, from 59 to 77 in the frankfurters to 97 to 115 g kg-1 in the Italian salami. The
polyunsaturated fatty acid contents were similar for the frankfurters (43 g kg-1) and mortadella (44 g kg-1) and lower
for the Italian type salami (37 g kg-1). The polyunsaturated/
saturated fatty acid ratio was lower in the Italian salami (0.38) and higher in the frankfurter (0.73). The frankfurter and mortadella presented n3 fatty acid contents of about 2 g kg-1, whereas the Italian salami contained 1 g kg-1 only.
The n6/n3 ratio was lower in the frankfurter (17.8) and higher in the salami (30.0).
Comparison of the cholesterol and total lipid contents and fatty acid compositions in the processed meat products
Table 8 shows the average values for the cholesterol and total lipid contents in 30 samples of each of the processed
Table 5. Fatty acid compositions (% area) of the processed pork products
Fatty acids Sausage M ± SD*
Spam M ± SD*
Ham M ± SD* C14:0 1.5 ± 0.1 a 1.3 ± 0.1 b 1.3 ± 0.1 b C15:0 0.2 ± 0.0 c 0.4 ± 0.0 b 0.8 ± 0.2 a C16:0 25.5 ± 0.7 a 23.9 ± 0.2 a 24.4 ± 0.5 a C17:0 0.4 ± 0.0 a 0.4 ± 0.1 a 0.4 ± 0.1 a C18:0 11.8 ± 0.3 a 10.8 ± 0.4 a 10.7 ± 0.3 a C20:0 0.2 ± 0.0 a 0.2 ± 0.0 a 0.1 ± 0.0 a C24:0 0.1 ± 0.0 b 0.2 ± 0.0 b 0.3 ± 0.0 a C16:1n7 2.5 ± 0.3 a 2.8 ± 0.2 a 2.9 ± 0.2 a C17:1n7 0.5 ± 0.1 a 0.4 ± 0.0 a 0.4 ± 0.1 a C18:1n9t 0.2 ± 0.0 a 0.3 ± 0.1 a 0.2 ± 0.1 a C18:1n9 42.1 ± 0.7 a 42.3 ± 1.6 a 42.8 ± 1.2 a C20:1n11 0.7 ± 0.0 a 0.7 ± 0.1 a 0.6 ± 0.1 a C18:2n6 13.2 ± 1.1 a 14.7 ± 2.0 a 12.9 ± 1.0 a
C18:3n6 nd 0.5 ± 0.1 a 0.6 ± 0.1 a
C18:3n3 0.5 ± 0.1 a 0.6 ± 0.1 a 0.5 ± 0.1 a C20:2n6 0.5 ± 0.1 a 0.5 ± 0.0 a 0.4 ± 0.1 a C20:4n6 0.4 ± 0.1 c 0.7 ± 0.2 b 1.2 ± 0.2 a
Saturated 40 a 37 b 38 b
Monounsaturated 46 a 46 a 47 a
Polyunsaturated 14 a 17 a 15 a
Total n3 0.5 0.6 0.5
Total n6 14 16 15
P/S 0.4 0.5 0.4
n6/n3 28 27 30
*Means and standard deviations of 30 samples in duplicate (5 brands, 3 batches analyzed in duplicate). nd = not detected; P/S = polyunsaturated/ saturated. Values in the same line with the same letter are not significantly different at the 5% level.
Table 6. Cholesterol (mg kg-1) and total lipid (g kg-1) contents of the
processed mixed meat products
Samples Cholesterol
M ± SD*
Total lipids M ± SD* Frankfurter
Brand 1 460 ± 111 b cd 150 ± 5 d f
Brand 2 460 ± 56 b cd 249 ± 6 a ab
Brand 3 711 ± 58 a a 168 ± 7 c e
Brand 4 516 ± 17 b bc 181 ± 3 b d
Brand 5 443 ± 80 b cd 166 ± 5 c e Mortadella
Brand 1 421 ± 68 b cd 185 ± 15 b d
Brand 2 411 ± 55 b d 231 ± 15 a c
Brand 3 498 ± 5 a c 229 ± 22 a c
Brand 4 394 ± 16 b e 236 ± 11 a c
Brand 5 420 ± 38 b cd 212 ± 1 a cd Salami
Brand 1 524 ± 25 b bc 275 ± 18 a a
Brand 2 655 ± 44 a a 235 ± 6 c c
Brand 3 530 ± 53 b bc 225 ± 48 d c
Brand 4 608 ± 67 a b 278 ± 7 a a
Brand 5 642 ± 21 a ab 242 ± 17 b b
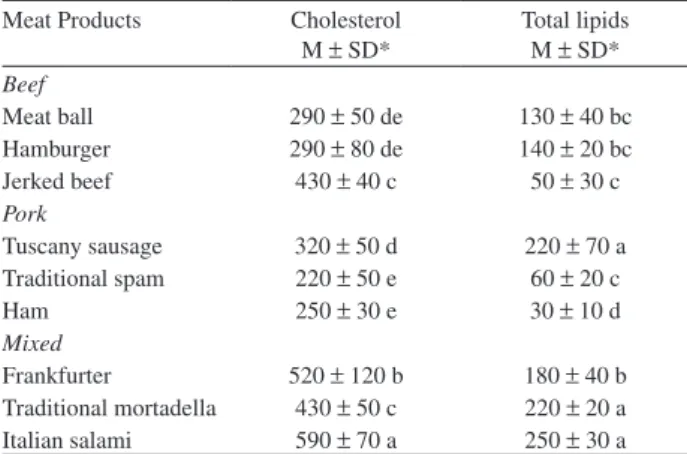
meat products, with exception of jerked beef of which only 12 samples were analyzed. The cholesterol contents (mg kg-1) varied from 220 ± 50 in the traditional spam to
590 ± 70 in the Italian salami. There were no significant differences between the meatballs and the hamburger, between the jerked beef and the mortadella or between the spam and the ham. The total lipid contents (g kg-1)
varied from 30 ± 10 in the ham to 250 ± 30 in the Italian salami. There was no significant difference between the meatball and hamburger, between the jerked beef and spam or between the Tuscany sausage, mortadella and Italian salami. It can be observed, from the standard deviations, that the greatest variation of the cholesterol content between batches and between brands was for the frankfurter, and the smallest for the ham. In the total lipids content the highest variation between brands and their respective batches was for the ham, jerked beef and Tuscany sausage. The variation in cholesterol and total lipid contents found between brands and between the three batches of the same brand, could be related to breed, sex, age and diet of the slaughtered animals, and also to the ingredients used in product processing as well as to the quality and composition (meat and sub-products) of the raw material.
Table 7. Fatty acid compositions (% area) of the processed mixed meat products
Fatty acids Frankfurter M ± SD*
Mortadella M ± SD*
Italian salami M ± SD* C14:0 0.7 ± 0.1 c 1.0 ± 0.1 b 1.5 ± 0.1 a C15:0 0.3 ± 0.0 a 0.2 ± 0.0 a 0.2 ± 0.1 a C16:0 24.2 ± 0.8 a 24.3 ± 0.8 a 24.6 ± 1.1 a C17:0 0.3 ± 0.1 b 0.3 ± 0.0 b 0.5 ± 0.0 a C18:0 7.2 ± 1.5 c 9.3 ± 0.7 b 11.7 ± 0.9 a C20:0 0.3 ± 0.1 a 0.1 ± 0.0 b 0.4 ± 0.0 a C24:0 0.2 ± 0.1 a 0.2 ± 0.1 a 0.1 ± 0.0 a C16:1n7 4.7 ± 1.0 a 3.5 ± 0.4 b 2.6 ± 0.3 b C17:1n7 0.3 ± 0.0 b 0.3 ± 0.0 b 0.4 ± 0.1 a C18:1n9t 0.2 ± 0.0 b 0.2 ± 0.0 b 0.4 ± 0.1 a C18:1n9 37.2 ± 2.3 a 40.1 ± 0.3 a 42.7 ± 0.9 a C20:1n11 0.5 ± 0.1 a 0.5 ± 0.1 a 0.6 ± 0.1 a C18:2n6 22.3 ± 2.0 a 18.8 ± 0.9 b 13.5 ± 0.3 c C18:3n6 0.2 ± 0.1 b 0.1 ± 0.0 c 0.5 ± 0.1 a C18:3n3 1.4 ± 0.2 a 1.0 ± 0.0 b 0.6 ± 0.1 c C20:2n6 0.3 ± 0.1 b 0.3 ± 0.1 b 0.5 ± 0.1 a C20:4n6 0.4 ± 0.1 a 0.3 ± 0.1 a 0.4 ± 0.0 a
Saturated 33 b 36 b 39 a
Monounsaturated 43 a 44 a 46 a
Polyunsaturated 24 a 20 b 15 c
Total n3 1.3 1.0 0.5
Total n6 23.2 19.5 15.0
P/S 0.73 0.55 0.38
n6/n3 17.8 19.5 30.0
*Mean and standard deviation of 30 samples in duplicate (5 brands, 3 batches analyzed in duplicate). P/S = polyunsaturated/saturated; values in the same line with the same letter are not significantly different at the 5% level.
Table 8. Cholesterol (mg kg-1) and total lipid (g kg-1) contents of the
processed meat products
Meat Products Cholesterol M ± SD*
Total lipids M ± SD* Beef
Meat ball 290 ± 50 de 130 ± 40 bc
Hamburger 290 ± 80 de 140 ± 20 bc
Jerked beef 430 ± 40 c 50 ± 30 c
Pork
Tuscany sausage 320 ± 50 d 220 ± 70 a Traditional spam 220 ± 50 e 60 ± 20 c
Ham 250 ± 30 e 30 ± 10 d
Mixed
Frankfurter 520 ± 120 b 180 ± 40 b Traditional mortadella 430 ± 50 c 220 ± 20 a Italian salami 590 ± 70 a 250 ± 30 a *Mean and standard deviation of 30 samples (5 brands, 3 batches analyzed in duplicate). Values in the same line with the same letter are not significantly different at the 5% level.
The results found in the literature were conflicting.4,19,25,27-29
However, these results could be explained by the fact that the lipids and cholesterol level vary with age and breed of the animal, sex, diet and rearing system, as well as to different analytical methods and variation in the formulation.
Considering the total lipid contents, the highest saturated fatty acid concentration was found in the Italian salami (97 g kg-1) and lowest in the ham (11 g kg-1), the C16:0 fatty acid
was found in the highest concentration, followed by C18:0. The lowest monounsaturated fatty acid concentration was found in the ham (14 g kg-1) and the highest in the Italian
salami (115 g kg-1). The C18:1n9 was the fatty acid found in
the highest concentrations, followed by C16:1n7. The lowest total polyunsaturated fatty acid content was in the jerked beef (2 g kg-1) and highest in the mortadella (44 g kg-1), C18:2n6
was the fatty acid found in greatest amounts.
Torres et al.20 analyzing jerked beef samples, found
higher percentages of monounsaturated and polyunsaturated fatty acids and lower saturated fatty acid percentages when compared to the results of this study. Pereira et al.29
found lower saturated fatty acid percentages and higher monounsaturated and polyunsaturated fatty acids in samples of normal sausage, than the percentages found in Tuscany sausage. Zanardi et al.,19 analyzing four types of fermented
sausages, found higher saturated fatty acid percentages, similar monounsaturated fatty acid percentages and lower polyunsaturated fatty acid percentages, when compared to the percentages found in Tuscany sausage.
The trans fatty acid isomer C18:1n9 was found in all the analyzed samples, varying from 60 mg kg-1 in the ham to
4000 mg kg-1 in the hamburger. C18:2n6t was detected in the
presence of the trans fatty acid in our diet is derived from two sources. The first one is industrial hydrogenation of vegetal oil and the second from foods containing ruminant fat for example, butter, cheese and beef fat which contain trans fatty acids as a result of microbial biohydrogenations occurring in the ruminant stomach.30 The highest C18:1n9t contents
found in the meatballs and hamburgers could be due to the presence of hydrogenated fat in their composition (Table 1). The standard deviations showed high values for the fatty acid C18:1n9t in the hamburger and meatball due to the variation between the analyzed batches and brands.
The polyunsaturated/saturated fatty acid ratios found in the present study were lowest in the jerked beef (0.08) and highest in the frankfurter (0.73). The C18:3n3 was the only n3 found, which was higher in the frankfurter and mortadella (2 g kg-1) and lower in all the other products. The n-3 PUFA
are considered beneficial to human health and there are evidences that C18:3n-3 independent reduces the risks of heart diseases.31 Thus the amount found in frankfurter
and mortadella can be considered significantly healthy, comparing, for example, with a salmon pates that contains 7.5 g kg-1 of total n-3 PUFA.32 The n6/n3 ratio varied from
6.8 in the jerked beef to 30 in ham and salami.
Acknowledgments
The authors wish to thank the Fundação de Amparo à Pesquisa do Estado de São Paulo (FAPESP) and the Conselho Nacional de Desenvolvimento Científico e Tecnológico (CNPq) for their financial assistance.
References
1. Paniangvait, P.; King, A. J.; Jones, A. D.; German, B. G.; J. Food Sci.1995, 60, 1159.
2. Smith, L. L.; Chem. Phys. Lipids1987, 44, 87.
3. Osada, K.; Hoshina, S.; Nakamura, S.; Sugano, M.;J. Agric. Food Chem.2000, 48,3823.
4. Rodriguez-Estrada, M. T.; Penazzi, G.; Caboni, M, F.; Bertacco, G.; Lercker, G.; Meat Sci.1997, 45, 365.
5. Imai, H.; Werthessen, N. T.; Taylor, B.; Lee, K. T.; Arch. Pathol. Med.1976, 100, 565.
6. Taylor, B.; Peng, S. K.; Werthessen, N. T.; Tham, P.; Lee, K. T.; Am. J. Clin. Nutr. 1979, 32, 40.
7. Sevanian, A. N.; Peterson, A. R.; Food Chem. Toxicol. 1986, 24, 1103.
8. Guardiola, F.; Peng, S. K.; Werthessen, N. T.; Tham, P.; Lee, B.; Food Chem. Toxicol. 1996, 34, 193.
9. Kepler, C. R.; Hirons, K. P.; McNeill, J. J.; Tove, S. B.; J. Biol. Chem. 1966, 241, 1350.
10. Roberts, W. C.; Atherosclerosis1992, 79, 1146.
11. Report on Health and Social Subjects; Nutritional Aspects of Cardiovascular Disease, British Department of Health: London, 1994, v 46.
12. Simopoulos, A. P.; Am. J. Clin. Nut.1999, 70, 560S. 13. Folch, J.; Less, M.; Stanley, S.; J. Biol. Chem. 1957, 226, 497. 14. Baggio, S. R.; Miguel, A. M. R.; Bragagnolo, N.; Food Chem.
2005, 89, 475.
15. Baggio, S. R.; Vicente, E.; Bragagnolo, N.; J. Agric. Food Chem.
2002, 50, 5981.
16. Keith, L. H.; Crummett, W.; Deegan, J. J.; Libby, R. O.; Taylor, J. K.; Wentler, G.; J. Am. Chem. Soc. 1983, 55, 2210. 17. Hartman, L.; Lago, R. C. A.; Laboratory Practies1973, 22, 475. 18. Tai, C. Y.; Chen, Y. C.; Chen, B. H.; J. Food Drug Anal.1999,
7, 243.
19. Zanardi, E.; Ghidini, S.; Battaglia, A.; Chizzolini, R.; Meat Sci. 2004, 66, 415.
20. Torres, E.; Pearson, A. M.; Gray, J. L.; Ku, P. K.; Food Chem.
1989, 32, 257.
21. Park, S. W.; Addis, P. B.; J. Food Sci. 1985, 50, 1437. 22. Zubillaga, M. P.; Maerker, G.; J. Am. Oil Chem. Soc.1987, 64,
757.
23. Goutefongea, R. ; Cassens, R. G. ; Woolford, G. ; J. Food Sci. 1977, 42, 1637.
24. Higley, N. A.; Taylor, S. L.; Herian, A. M.; Lee, K.; Meat Sci.
1986, 16, 175-188.
25. Novelli, E.; Zanardi, E.; Ghiretti, G. P.; Campanini, G.; Dazzi, G.; Madarena, G.; Chizzolini, R.; Meat Sci.1998, 48, 29. 26. Schmarr, H.; Gross, H. B.; Shibamoto, T.; J. Agric. Food Chem.
1996, 44, 512.
27. Larkeson, B.; Dutta, P. C.; Hansson, I.; J. Am. Oil Chem. Soc. 2000, 77, 675.
28. Petrón, M. J.; García-Reguero, J. A.; Martín, L.; Muriel, E.; Antequera, T.; J. Agric. Food Chem. 2003, 51, 5786.
29. Pereira, N. R.; Tarley, C. R. T.; Matsushita, M.; Souza, N. E.; J. Food Comp. Anal.2000, 13, 915.
30. Smith, L. M.; Dunkley, W. L.; Franke, A.; Daiikin, T.; J. Am. Oil Chem. Soc.1978, 55, 257.
31. Renaud, S. C.; Lanzmann-Petithory, D.; World Rev. Nutr. Diet. 2001, 88, 79.
32. Echarte, M.; Conchillo, A.; Ansorena, D.; Astiasarán, I.; Food Chem. 2004, 86, 47.
Received: May 18, 2007
Web Release Date: February 27, 2008