Renata Bertazzi LevyI Rafael Moreira ClaroII Lenise MondiniIII Rosely SichieriIV
Carlos Augusto MonteiroV
I Departamento de Medicina Preventiva. Faculdade de Medicina. Universidade de São Paulo (USP). São Paulo, SP, Brasil II Núcleo de Pesquisas Epidemiológicas em
Nutrição e Saúde. USP. São Paulo, SP, Brasil III Instituto de Economia Agrícola. Secretaria
de Agricultura e Abastecimento do Estado de São Paulo. São Paulo, SP, Brasil IV Departamento de Epidemiologia. Instituto
de Medicina Social. Universidade do Estado do Rio de Janeiro. Rio de Janeiro, RJ, Brasil V Departamento de Nutrição. Faculdade de
Saúde Pública. USP. São Paulo, SP, Brasil Correspondence:
Renata Bertazzi Levy
Departamento de Medicina Preventiva Faculdade de Medicina da USP Av. Dr. Arnaldo, 455 – 2º andar Cerqueira Cesar
01246-903 São Paulo, SP, Brasil E-mail: [email protected] Received: 1/20/2011 Approved: 8/18/2011
Article available from: www.scielo.br/rsp
Regional and socioeconomic
distribution of household food
availability in Brazil, in
2008-2009
ABSTRACT
OBJECTIVE: To describe the regional and socioeconomic distribution of household food availability in Brazil.
METHODS: Data from the 2008-2009 Household Budget Survey on food and beverage acquisition for household consumption, conducted by the Instituto Brasileiro de Geografi a e Estatística (Brazilian Institute of Geography and Statistics), were analyzed. The amounts of foods, recorded during seven consecutive days in the 55,970 sample households, were converted into calories and nutrients. Food quality indicators were constructed and analyzed according to the regional and socioeconomic strata of the Brazilian population.
RESULTS: The amount of energy from protein was adequate in all regional and socioeconomic strata. On the other hand, an excess of free sugars and fats was observed in all regions of the country, especially in the Southern and Southeastern regions. The proportion of saturated fats was high in urban areas and consistent with the greater contribution of animal-derived products. Limited availability of fruits and vegetables was found in all regions. An increase in the fat content and reduction in carbohydrate content of the diet were observed with the increase in income.
CONCLUSIONS: The negative characteristics of the Brazilian diet observed at the end of the fi rst decade of the 21st century indicate the need to prioritize
public policies for the promotion of healthy eating.
DESCRIPTORS: Food Habits. Food Consumption. Budgets. Socioeconomic Factors. Diet Surveys.
INTRODUCTION
Favorable conditions for the occurrence of malnutrition and infectious diseases have been gradually replaced by a context of growing epidemic of obesity and other non-communicable chronic diseases associated with excessive and/or imbalanced food consumption.13 The analysis of the evolution of the Brazilian
adult population’s nutritional status showed that, whereas the prevalence of low weight has decreased, the prevalences of overweight and obesity have continually increased in recent decades.a
The World Health Organization (WHO) Global Strategy on Diet, Physical Activity and Health emphasizes the need for adequate world dietary standards,
one of the factors directly responsible for the increase in global load of obesity and non-communicable chronic diseases. The WHO stresses the need to reduce the consumption of foods with a high energy value, low nutrient content, and high content of sodium, saturated fats, trans fats and refi ned carbohydrates.b
The description of a population’s dietary patterns must be preferably made through direct investigation of individual food consumption. Recently, the Instituto Brasileiro de Geografi a e Estatística (IBGE – Brazilian Institute of Geography and Statistics) introduced a specifi c section that investigates individual food consumption in a sub-sample of the total number of households in Household Budget Surveys (HBS).
Regular surveys with data on household food availabi-lity derived from HBSs enable the characterization of changes in the Brazilian population’s dietary habits in recent decades. These contributions are valuable as they provide information about the adequacy of household diet composition and enable specifi c comparisons of consumption of certain foods to be made, among other things. The following are examples of unfavorable aspects: the reduction in household availability of traditional food staples in the Brazilian diet such as rice and beans, the increase in the amount of energy from fats in this diet, and the continuous excessive contri-bution of sugar and reduced contricontri-bution of fruits and vegetables to it. On the other hand, the increase in the protein content in the diet, especially that from animal products, is an example of a positive aspect.5,c
The present study aimed to describe the regional and socioeconomic distribution of household food availa-bility in Brazil.
METHODS
The study was conducted with secondary data derived from the 2008-2009 HBS in a probabilistic sample of 55,970 households.d
The 2008-2009 HBS used two-stage cluster sampling with a random selection of census tracts in the fi rst stage and another of households in the second stage. All 12,800 sectors of the set of census tracts (Master Sample of Household Surveys and Common Sample)d
were previously grouped to obtain household strata with high geographical and socioeconomic homogeneity.
b World Health Organization. Integrated prevention of noncommunicable diseases: global strategy on diet, physical activity and health. Geneva; 2004[cited 2011 Jan 04]. Available from: http://www.who.int/dietphysicalactivity/strategy/eb11344/en/index.html
c Instituto Brasileiro de Geografi a e Estatística. Pesquisa de orçamentos familiares 2002-2003: análise da disponibilidade domiciliar de alimentos e estado nutricional no Brasil. Rio de Janeiro; 2004.
d Instituto Brasileiro de Geografi a e Estatística. Pesquisa de Orçamentos Familiares 2008-2009: despesas, rendimentos e condições de vida. Rio de Janeiro; 2010.
e List based on the publication entitled “Pesquisa de Orçamentos Familiares 2008-2009 Quantidades de Aquisição Alimentar domiciliar per capita”, published by the IBGE, which describes the methodology used to establish the amounts (in kg) associated with the list of 334 items analyzed in the present study.
Sector location (region, state, capital city or country-side, urban or rural area) and the range of variation in the economic level of families in each geographical locus, according to the individual responsible for the household (information obtained from the 2000 Demographic Census) were taken into consideration. The number of tracts randomly selected from each stratum was proportional to the number of households in this stratum, with least three tracts in the sample of each stratum. Households of each tract were selected by simple random sampling without replacement. The number of households with interviews per tract was established according to the research area (12 households in urban census tracts, 16 in rural census tracts). Interviews were uniformly distributed throu-ghout four three-month periods to reproduce the seasonal variation in income and acquisition of food (and other products) in each stratum.
The weights required to obtain the estimated quantities of interest were calculated at the end of the data collec-tion. Weights were calculated according to the sampling plan used, including adjustments to compensate for the lack of response of certain units. These weights were adjusted so that the sample could be proportional to the population projection, according to gender and age group on January 15th, 2009.d
We analyzed records of foods and beverages acquired for domestic consumption (approximately 850,000), noted down in a notebook by the household members them-selves (or by the interviewer, if necessary) during seven consecutive days. In the majority of cases, the amount of products acquired could be measured (in kg or l); in the remaining cases, the amount was imputedaccording to the value spent and mean price of the product.
The description of relative contribution of foods to household availability resulted from 334 items of consumption (foods or groups of foods) categorized according to information from the HBSe and divided
into 15 groups (cereals and derivatives; beans and other legumes; roots, tubers and derivatives; meat and deriva-tives; milk and derivaderiva-tives; eggs; fruits and natural juices; vegetables; vegetable oils and fats; animal fats; table sugar and sodas; alcoholic beverages; oilseeds; condi-ments; processed food preparations and ready meals).
f Instituto Brasileiro de Geografi a e Estatística. Tabela de composição de alimentos. 4.ed. Rio de Janeiro; 1996.
g Universidade Estadual de Campinas. Núcleo de Estudos e Pesquisas em Alimentação. Tabela Brasileira de Composição de Alimentos – TACO – versão 1. Campinas; 2004.
h United States Department of Agriculture. Agricultural Research Service. Beltsville; 2002. (USDA National Nutrient Database for Standard Reference. Release, 15).
i Ministério da Saúde. Secretaria de Atenção à Saúde. Coordenação-Geral da Política de Alimentação e Nutrição. Guia alimentar para a população brasileira: promovendo a alimentação saudável. Brasília; 2006. (Série A. Normas e Manuais Técnicos).
according to the corresponding correction factors.f The
total amount of each food was converted into energy and macronutrients using the Tabela Brasileira de Composição de Alimentos (TACO – Brazilian Food Composition Table).g The official American food
composition table (USDA) was used when a certain food or nutrient was not available in the Brazilian table.h In
the case of food items comprised of more than one food, the food that had the highest proportion was considered.
Carbohydrates were subdivided into free sugars (table sugar, rapadura – a type of candy made from sugarcane juice) –, and honey, in addition to mono- and disaccha-rides added to processed foods) and other carbohydrates (including sugars naturally found in basic foods, such as milk and fruits). Proteins were subdivided into animal and vegetable, whereas fats were divided into monounsaturated, polyunsaturated and saturated fatty acids. Relative contribution in household availability was described according to the percentage of calories of a certain food or macronutrient in the total energy content available for consumption.
The mean total energy value of household food availa-bility (kcal per capita per day) and the relative contri-bution of groups of foods and macronutrients selected were estimated. The estimates were shown in terms of the group of Brazilian households and strata of such households, according to their urban or rural status, Brazilian regions and income level (quintiles of total monthly household income).
The assessment of contribution of fruits and vegetables and adequacy of composition of total proteins, carbo-hydrates and fats in household food availability was performed according to the WHO recommendations.13
We considered the Sociedade Brasileira de Cardiologia
(Brazilian Society of Cardiology) recommendations, which limit the proportion of calories from saturated fatty acids to a maximum of 7%.11 The adequate level
of consumption of fruits and vegetables in Brazil varied between 9% and 12% of the total energy value of a diet of 2,000 kcal/person/day, a value estimated according to the WHO recommendation of a minimum daily per capita consumption of 400 g.i
RESULTS
The mean food availability in Brazilian households was 1,611 kcal/person/day, 1,536 kcal in urban areas and 1,973 kcal in rural areas. Staple vegetables (cereals, legumes, roots and tubers) corresponded to 45% of
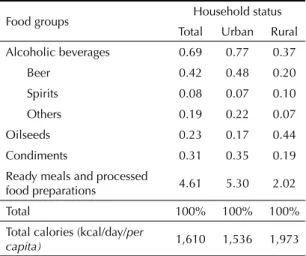
the calories available for consumption; high-energy foods (vegetable oils and fats, animal fats, sugar and sodas, and alcoholic beverages), 28%; and animal food products (meats, milk and derivatives and eggs), 19%. Fruits and vegetables contributed to 2.8% of total calories and processed food preparations and ready meals corresponded to 4.6%. The contributions of condiments (0.3%) and oilseeds (0.2%) were not signifi cant (Table 1).
The contribution of cereals and derivatives was similar in urban and rural areas (approximately 35%), although there were substantial differences in their components. Bread (7.4% of total calories in urban areas against 2.5% in rural areas) and cookies (3.6% against 2.8%) were more important in urban areas, while rice (19.3% of total calories in rural areas against 15.4% in urban areas), wheat fl our (3.1% against 1.9%) and other cereals and derivatives (5.1% against 4.2%) were more important in rural areas. The contribution of beans and other legumes, roots and tubers, and pork was greater in rural areas, whereas that of processed meats was greater in urban areas.
The contribution of fruits and vegetables to total food availability was almost two times greater in urban areas, but lower than the recommendations of 9% to 12% of total calories. The contribution of high-energy foods was similar in both areas (approximately 28%), the specifi c contribution of table sugar was greater in rural areas (14% against 10%) and the contribution of soft drinks was greater in urban areas (2.0% against 0.8%). The contribution of alcoholic beverages to total calories, although reduced, was more important in urban areas (0.8%) than in rural areas (0.4%). The contribution of processed food preparations and ready meals and condi-ments was 2.5 times greater in urban areas (Table 1).
alcoholic beverages, condiments and ready meals in the South and Southeast; and of oilseeds (Brazil nuts) in the North. Availability of milk and derivatives and vegetables in the North and Northeast was lower than the national mean value.
The effect of household income on the contribution of the majority of foods and food groups (Table 3) was signifi cant. The contribution of food groups comprised of milk and derivatives, fruits and vegetables, animal fats, alcoholic beverages and ready meals tended to increase consistently with the level of household income. Food groups comprised of beans and other legumes, cereals and derivatives (due to the reduction in the contribution of rice with income) and roots, tubers and derivatives (due to the reduction in the contribution of cassava fl our with income) had an inverse trend. Sugar and soft drinks and meats showed more complex consumption patterns with income: there was a decrease in the consumption of table sugar and an increase in the consumption of soft drinks with the increase in income and an increase in beef and processed meats and a reduction or stability in other types of meat were found.
Of the total calories in the diet analyzed, 59% were from carbohydrates, 12% from proteins and 29% from fats (Table 4), i.e. this diet met the nutritional recom-mendations (between 55% and 75% of calories from carbohydrates, between 10% and 15% from proteins, and between 15% and 30% from fats). However, imba-lances were caused by a relative excess of free sugars (16.4% of the total calories against a maximum of 10% established by the WHO/FAO nutritional recommen-dations) and saturated fatty acid content (8.3% of total calories against a maximum of 7% recommended by the Brazilian Society of Cardiology).
The total fat content (29.7%) was close to the maximum limit of 30%, while the maximum limit of saturated fats was surpassed (8.7%) in urban areas. Total energy Table 1. Relative contribution (%) of foods and food groups
to household total energy availability per household status. Brazil, 2008-2009.
Food groups Household status Total Urban Rural
Cereals and derivatives 35.21 35.19 35.27
White rice 16.24 15.43 19.30
French bread 6.39 7.42 2.50
Cookies 3.39 3.55 2.80
Spaghetti 2.65 2.71 2.43
Wheat fl our 2.14 1.89 3.09
Others 4.40 4.21 5.14
Beans and other legumes 5.44 5.08 6.82
Roots, tubers and derivatives 4.79 3.71 8.92
Potato 0.54 0.59 0.34
Cassava 0.33 0.26 0.60
Cassava fl our and others 3.92 2.85 7.97
Meats 12.34 12.58 11.43
Beef 4.42 4.58 3.80
Chicken 4.03 4.16 3.53
Pork 0.68 0.61 0.96
Fish 0.64 0.54 1.00
Processed meat 2.22 2.42 1.46
Others 0.36 0.27 0.69
Milk and derivatives 5.77 6.11 4.49
Milk 4.44 4.58 3.90
Cheeses 1.09 1.24 0.51
Others 0.25 0.29 0.08
Eggs 0.71 0.71 0.68
Fruits and natural juices 2.04 2.25 1.23
Bananas 0.87 0.94 0.59
Oranges 0.25 0.27 0.16
Others 0.83 0.93 0.46
Natural juices 0.09 0.11 0.02
Vegetables 0.80 0.87 0.55
Tomato 0.22 0.24 0.13
Lettuce 0.02 0.02 0.02
Others 0.57 0.61 0.41
Oils and fats 14.07 14.41 12.71
Soybean oil 9.71 9.67 9.86
Margarine 1.71 1.88 1.06
Butter 0.34 0.38 0.19
Bacon 0.55 0.49 0.77
Others 1.76 1.99 0.83
Sugar and sodas 12.99 12.49 14.88
Sugar 11.24 10.50 14.05
Soft drinks 1.75 1.99 0.83
To be continued
Table 1 continuation
Food groups Household status Total Urban Rural
Alcoholic beverages 0.69 0.77 0.37
Beer 0.42 0.48 0.20
Spirits 0.08 0.07 0.10
Others 0.19 0.22 0.07
Oilseeds 0.23 0.17 0.44
Condiments 0.31 0.35 0.19
Ready meals and processed
food preparations 4.61 5.30 2.02
Total 100% 100% 100%
Total calories (kcal/day/per
Table 2. Relative contribution (%) of foods and food groups to household total energy availability per region. Brazil, 2008-2009.
Food groups Regions
North Northeast South Southeast Central-West
Cereals and derivatives 29.71 37.23 34.23 35.03 37.59
White rice 15.41 16.68 12.37 16.45 23.32
French bread 5.54 6.80 4.65 7.27 4.83
Cookies 2.55 4.09 3.25 3.31 2.49
Spaghetti 2.19 2.88 2.87 2.61 1.98
Wheat fl our 1.12 0.71 6.56 1.63 1.90
Others 2.89 6.06 4.54 3.75 3.07
Beans and other legumes 5.15 7.36 3.53 4.98 5.19
Roots, tubers and derivatives 14.40 7.69 2.36 1.99 2.20
Potato 0.24 0.28 0.88 0.67 0.45
Cassava 0.46 0.26 0.70 0.20 0.40
Cassava fl our and others 13.69 7.15 0.78 1.13 1.35
Meats 16.21 11.95 13.61 11.41 11.26
Beef 5.44 4.43 5.10 3.79 5.07
Chicken 5.63 4.64 3.75 3.45 3.41
Pork 0.47 0.40 1.21 0.73 0.62
Fish 2.46 0.77 0.24 0.35 0.27
Processed meat 1.34 1.28 2.95 2.87 1.73
Others 0.88 0.43 0.37 0.22 0.17
Milk and derivatives 3.72 4.60 7.26 6.56 5.24
Milk 3.20 3.66 5.55 4.88 4.11
Cheeses 0.39 0.76 1.39 1.39 0.89
Others 0.12 0.18 0.32 0.30 0.24
Eggs 0.65 0.73 0.84 0.67 0.58
Fruits and natural juices 1.28 1.94 2.31 2.21 1.87
Bananas 0.58 0.95 0.96 0.87 0.74
Oranges 0.15 0.21 0.24 0.29 0.25
Others 0.48 0.73 1.03 0.92 0.76
Natural juices 0.07 0.05 0.08 0.13 0.11
Vegetables 0.54 0.65 0.88 0.92 0.88
Tomato 0.12 0.16 0.24 0.25 0.27
Lettuce 0.01 0.01 0.03 0.02 0.02
Others 0.42 0.48 0.61 0.64 0.59
Oils and fats 11.93 11.35 14.68 15.73 16.65
Soybean oil 8.90 7.78 9.46 10.78 13.02
Margarine 1.42 1.84 1.66 1.74 1.41
Butter 0.45 0.44 0.11 0.35 0.21
Bacon 0.15 0.21 0.99 0.68 0.62
Others 1.01 1.08 2.46 2.18 1.39
Sugar and sodas 11.79 13.12 12.10 13.51 13.11
Sugar 10.54 12.16 9.79 11.30 11.44
Soft drinks 1.25 0.96 2.31 2.21 1.67
from fats was adequate (approximately 25%) and the total energy from saturated fats was not higher than 7% in rural areas. The consumption of free sugars was excessive in both urban and rural areas (16.1% and 17.1%, respectively) (Table 4). The relative excess of saturated fats in urban areas was in agreement with the greater contribution of animal food products (beef, chicken, processed meats and milk and derivatives) in the acquisitions made by these households.
There was an adequate protein content in all regions (between 11% and 13%), an excess of energy from fats in the South and Southeast (higher than 30%), a high amount of saturated fats in all regions, except for the Northeast (7%), and an excess of free sugars in all regions (between 13.9% in the North and 17.4% in the Southeast) (Table 4).
The dietary fat content increased and that of carbo-hydrates decreased with the increase in income. The minimum recommendation for carbohydrates (55% of total calories) was practically met in the highest quintile of income and approximately 30% of dietary carbohydrates at this income level (16% of 55%) corresponded to free sugars. Consumption of saturated fats tended to increase with income (between 6.7% in the lowest quintile and 10% in the highest quintile). Only in the lowest quintile of income were the total calories from these fats lower than the maximum recom-mendation of 7%. The total energy from free sugars at all income levels was substantially higher than the maximum amount recommended. Although the protein content tended to increase with income, the proportion of proteins was adequate at all levels of income (Table 4).
DISCUSSION
The in-depth study of food acquisitions made by Brazilian families in 2008-2009 provides relevant information to describe the recent situation and the
regional and socioeconomic distribution of food quality in this country.
The protein content of the diets was adequate in all regions and income levels. However, there was an insuffi cient amount of fruits and vegetables and an excess of calories from free sugars and saturated fats.
An increase in the relative availability of ultra--processed foods such as French bread, cookies, soft drinks, alcoholic beverages, ready meals and food preparations was observed. In addition, there was a reduction in the availability of minimally processed foods and ingredients used to prepare these foods, such as rice, beans, milk, wheat and cassava fl ours, soybean oil and sugar, when compared to a previous study derived from the 2002-2003 HBS, considering the food processing level.7
One limitation to studies on food availability is that some of the foods were consumed out of the home. In 2008-2009, these foods corresponded to approximately 30% of total spending on food.j Although the 2008-2009
HBS calculated spending on each food item out of the home, the type and amount of foods acquired were not suffi ciently specifi ed to determine the percentage of calories coming from out of the home. Another limi-tation inherent in household budgets surveys was the fact that certain foods acquired but not consumed by household members were not taken into consideration.
The short period of reference (one week) to collect data on foods acquired by families determines that estimates of HBS should be calculated according to clusters of households rather than individual households. The impossibility of determining the variation in energy requirements of individuals from several strata of the population does not enable researchers to conclude, for example, that the probability of caloric defi cits in Brazil is higher in urban areas than rural areas. In this case, it is Table 2 continuation
Food groups Regions
North Northeast South Southeast Central-West
Alcoholic beverages 0.33 0.38 0.92 0.88 0.74
Beer 0.21 0.18 0.59 0.56 0.48
Spirits 0.05 0.09 0.08 0.07 0.09
Others 0.07 0.11 0.25 0.25 0.17
Oilseeds 1.25 0.13 0.17 0.12 0.11
Condiments 0.20 0.20 0.50 0.36 0.25
Ready meals and processed food preparations 2.85 2.67 6.61 5.63 4.33
Total 100% 100% 100% 100% 100%
Total calories (kcal/day/per capita) 1,818 1,602 1,785 1,530 1,530
possible that the lower availability of calories in urban areas refl ects a higher frequency of food consumption out of the home and, probably, lower energy require-ments, when compared to rural areas.
However, data on food acquisition can and have been used to establish food consumption patterns,4,9,12
espe-cially when the indicators used focus on the relative contribution of different foods and food groups rather than absolute amounts, as observed in the present study. Household budget surveys refl ect the beginning of the chain of consumption and enable the establishment of public policies that can change the availability of foods and population acquisition patterns.
Consumption patterns obtained according to household food acquisitions tend to approach the actual dietary pattern of populations, as shown in studies on food safety conducted in Cape Verde, Kenya and Armenia.2,3,6 In these studies, food acquisition was
closely associated with their effective consumption, with regard to both the contribution of food groups to the total calories consumed and the dietary macronu-trient composition profi le. In a study conducted in four European countries (Belgium, Greece, Norway and the United Kingdom), food consumption indicators derived from household budget surveys were highly correlated with indicators calculated from studies on individual consumption, identifying correlations higher than 0.80 for the consumption of meats, milk and derivatives, and fruits and vegetables.8 In a study
Table 3. Relative contribution (%) of foods and food groups to household total energy availability per quintiles of per capita household income. Brazil, 2008-2009.
Food groups
Quintiles of per capita household income
1st 2nd 3rd 4th 5th
Cereals and
derivatives 37.92 36.99 35.63 34.95 31.80
White rice 19.48 18.35 16.84 15.49 12.49
French bread 5.23 6.53 6.59 7.11 6.26
Cookies 3.45 3.29 3.09 3.39 3.70
Spaghetti 2.93 2.88 2.60 2.52 2.43
Wheat fl our 1.68 1.71 2.50 2.53 2.11
Others 5.15 4.23 4.01 3.90 4.81
Beans and other
legumes 7.00 6.20 6.02 4.68 3.96
Roots, tubers and
derivatives 7.30 5.73 5.21 3.82 2.84
Potato 0.29 0.45 0.51 0.65 0.71
Cassava 0.27 0.33 0.39 0.36 0.30
Cassava fl our and
others 6.75 4.95 4.31 2.80 1.83
Meats 11.24 11.87 12.32 12.91 12.98
Beef 3.81 4.25 4.43 4.59 4.80
Chicken 4.17 4.18 4.19 4.03 3.67
Pork 0.44 0.53 0.57 0.80 0.96
Fish 0.82 0.71 0.63 0.51 0.56
Processed meat 1.61 1.89 2.15 2.57 2.65
Others 0.38 0.32 0.35 0.41 0.33
Milk and derivatives 3.86 4.93 5.35 6.45 7.51
Milk 3.39 4.21 4.36 4.92 4.97
Cheeses 0.36 0.55 0.79 1.25 2.12
Others 0.11 0.17 0.20 0.28 0.41
Eggs 0.66 0.69 0.74 0.73 0.71
To be continued
Table 3 continuation
Food groups
Quintiles of per capita household income
1st 2nd 3rd 4th 5th Fruits and natural
juices 1.20 1.53 1.76 2.33 3.00 Bananas 0.67 0.77 0.80 0.99 1.04 Oranges 0.13 0.18 0.22 0.29 0.36 Others 0.37 0.55 0.70 0.97 1.38
Natural juices 0.02 0.03 0.04 0.08 0.23 Vegetables 0.52 0.68 0.75 0.91 1.04 Tomato 0.13 0.18 0.21 0.24 0.28 Lettuce 0.01 0.01 0.02 0.02 0.03 Others 0.37 0.48 0.52 0.65 0.73
Oils and fats 13.11 13.93 14.01 14.27 14.67 Soybean oil 10.10 10.38 10.42 9.73 8.28 Margarine 1.46 1.57 1.61 1.85 1.94 Butter 0.23 0.30 0.26 0.32 0.53
Bacon 0.42 0.66 0.51 0.69 0.45 Others 0.90 1.02 1.21 1.68 3.47 Sugar and sodas 14.33 13.90 13.74 12.39 11.24
Sugar 13.46 12.69 12.15 10.26 8.66
Soft drinks 0.87 1.21 1.58 2.13 2.57 Alcoholic beverages 0.32 0.45 0.49 0.71 1.28 Beer 0.13 0.23 0.31 0.47 0.82 Spirits 0.11 0.10 0.06 0.08 0.04 Others 0.08 0.12 0.12 0.16 0.42
Oilseeds 0.25 0.19 0.26 0.18 0.27 Condiments 0.19 0.23 0.30 0.38 0.42 Ready meals and
processed food preparations
2.11 2.67 3.44 5.28 8.29
Total 100 100 100 100 100
Total calories (kcal/
conducted in Sweden, the comparison between food acquisition and effective consumption showed a reaso-nable level of agreement for all food groups, except for confectionery products and alcoholic beverages.1
Studies with data on food availability can overcome relevant bias of individual methods, such as the unde-restimation of effective food consumption (particularly among overweight individuals).10 They enable the
observation of seasonal variations in food consumption,
as exemplifi ed in the IBGE Household Budget Surveys, whose data collection period lasts 12 months.
The household food availability pattern shown in the 2008-2009 HBS and the comparison made with a previous study are consistent with the relevant growing contribution of non-communicable chronic diseases to the morbi-mortality profi le of the Brazilian population and with the increasingly high prevalence of overweight and obesity in this country.k
k Instituto Brasileiro de Geografi a e Estatística. Pesquisa de orçamentos familiares 2008-2009: antropometria e estado nutricional de crianças e adolescentes e adultos no Brasil. Rio de Janeiro; 2010.
Table 4. Relative contribution (%) of macronutrients to household total energy availability per household status, regions and quintiles of per capita household income. Brazil, 2008-2009.
Macronutrients Household status
Total Urban Rural
Carbohydrates 59.22 58.01 63.80
Free sugars 16.36 16.15 17.15
Other carbohydrates 42.86 41.86 46.65
Proteins 12.08 12.26 11.38
Animal 6.69 6.88 5.98
Vegetal 5.39 5.38 5.40
Fats 28.71 29.73 24.82
Monounsaturated fatty acids 9.17 9.58 7.64
Polyunsaturated fatty acids 9.17 9.37 8.43
Saturated fatty acids 8.32 8.67 6.96
Regions
Macronutrients North Northeast South Southeast Central-West
Carbohydrates 59.97 63.41 55.71 57.56 58.88
Free sugars 13.89 15.79 16.31 17.36 16.26
Other carbohydrates 46.08 47.62 39.40 40.20 42.62
Proteins 12.91 11.90 12.69 11.86 11.52
Animal 8.18 6.14 7.54 6.50 6.12
Vegetal 4.74 5.77 5.15 5.36 5.41
Fats 27.12 24.69 31.60 30.58 29.61
Monounsaturated fatty acids 8.46 7.98 10.20 9.78 9.07
Polyunsaturated fatty acids 8.43 7.80 9.71 9.86 10.54
Saturated fatty acids 8.23 7.04 9.40 8.85 7.99
Quintiles of per capita household income
Macronutrients 1st 2nd 3rd 4th 5th
Carbohydrates 63.57 61.23 60.01 67.72 55.28
Free sugars 16.60 16.49 16.63 15.99 16.19
Other carbohydrates 46.97 44.74 43.38 41.73 39.09
Proteins 11.20 11.59 11.94 12.41 12.88
Animal 5.56 6.11 6.51 7.10 7.73
Vegetal 5.64 5.48 5.43 5.31 5.15
Lipids 25.23 27.18 28.05 29.87 31.84
Monounsaturated fatty acids 7.87 8.57 8.82 9.63 10.45
Polyunsaturated fatty acids 8.82 9.18 9.33 9.31 9.15
1. Becker W. Comparability of household and individual food consumption data – evidence from Sweden. Public Health Nutr. 2001;4(5b):1177-82.
2. Clodomir P, Troubat N, Sibrian R. Food data collected using acquisition and intake approaches in Cape Verde’s IDRF 2001/2002. In: Sibrian R, editor. Deriving food security information from national household budget survey: experiences, achievements, challenges. Roma: Food and Agriculture Organization; 2008. p. 81-9.
3. Kaara J, Ramasawmy S. Food data collected using acquisition and consumption approaches with a seven-day recall method in Kenya’s KIHBS 2005/2006. In: Sibrian R, editor. Deriving food security information from national household budget survey: experiences, achievements, challenges. Roma: Food and Agriculture Organization; 2008. p. 69-79.
4. Lagiou P, Trichopoulou A, DAFNE contributors. DAta Food NEtworking. The DAFNE initiative: the methodology for assessing dietary patterns across Europe using household budget survey data. Public Health Nutr. 2001;4(5B):1135-41.
5. Levy-Costa RB, Sichieri R, Pontes NS, Monteiro CA. Disponibilidade domiciliar de alimentos no Brasil: distribuição e evolução (1974-2003). Rev Saude Publica. 2005;39(4):530-40. DOI: 10.1590/S0034-89102005000400003
6. Martirosova D. Food data collected using acquisition and consumption approaches with daily diaries in Armenia’s 2004. In: Sibrian R, editor. Deriving food security information from national household budget survey: experiences, achievements, challenges. Roma: Food and Agriculture Organization; 2008. p. 59-67.
7. Monteiro CA, Levy RB, Claro RM, Castro IRR, Cannon G. A new classifi cation of foods based on the
extent and purpose of food processing. Cad Saude Publica. 2010;26(11):2039-49. DOI:10.1590/S0102-311X2010001100005
8. Naska A, Paterakis S, Eeckman H, Remaut AM, Trygg K. Methodology for rendering household budget and individual nutrition surveys comparable, at the level of the dietary information collected. Public Health Nutr. 2001;4(5B):1153-8.
9. Naska A, Fouskakis D, Oikonomou E, Almeida MD, Berg MA, Gedrich K, et al. Dietary patterns and their socio-demographic determinants in 10 European countries: data from the DAFNE databank. Eur J Clin Nutr. 2006;60(2):181-90. DOI: 10.1038/ sj.ejcn.1602284
10. Scagliusi FB, Ferriolli E, Pfrimer K, Laureano C, Cunha CS, Gualano B, Lourenco BH, Lancha Jr AH. Underreporting of energy intake in Brazilian women varies according to dietary assessment: a cross-sectional study using doubly labeled water. J Am Diet Assoc. 2008;108(12):2031-40. DOI: 10.1016/j. jada.2008.09.012
11. Sposito AC, Caramelli B, Fonseca FAH, Bertolami MC, Afi une Neto A, Souza AG, et al. IV Diretriz Brasileira sobre dislipidemias e prevenção da aterosclerose. Arq Bras Cardiol. 2007;88(Supl 1):2-19. DOI: 10.1590/ S0066-782X2007000700002
12. Trichopoulou A, Naska A. European food availability databank based on household budget surveys: the Data Food Networking initiative. Eur J Public Health. 2003;13(3 Suppl):24-8. DOI: 10.1093/eurpub/13. suppl_1.24
13. World Health Organization. Diet, nutrition and the prevention of chronic diseases. Geneva; 2003. [WHO - Technical Report Series, 916].
REFERENCES
The research project was funded by the Conselho Nacional de Desenvolvimento Científi co e Tecnológico (CNPq – National Council for Scientifi c and Technological Development – Process number 475628/2009-8).
Claro RM was supported by the Fundação de Amparo à Pesquisa do Estado de São Paulo (FAPESP – State of São Paulo Research Support Foundation – Process number 2010/08421-7; post-doctoral scholarship).
Authors declare no confl icts of interests.
The quality of the diet has relevant repercussions for the health of individuals and the negative aspects of the diet of the Brazilian population at the end of
the fi rst decade of the 21st century indicate the high