A
r
t
ic
le
*e-mail: [email protected]
Development and Validation of a HPLC Method for the Determination of Aldicarb, Aldicarb
Sulfoxide and Aldicarb Sulfone in Liquid Samples from Anaerobic Reactors
Leonardo H. S. Damasceno,* M. Angela T. Adorno, Julia S. Hirasawa, M. Bernadete A. Varesche and Marcelo Zaiat
Departamento de Hidráulica e Saneamento, Escola de Engenharia de São Carlos, Universidade de São Paulo, Bloco 4F, Av. João Dagnone, 1100, Santa Angelina, 13563-120 São Carlos-SP, Brazil
Este trabalho descreve o desenvolvimento e validação de um método de detecção de aldicarbe e seus metabólitos por cromatografia líquida de alta eficiência (HPLC) em amostras líquidas sem pré-tratamento. O sistema HPLC foi equipado com coluna C-18 e fase móvel composta de água e acetonitrila empregando gradiente de eluição linear. O detector UV foi operado em 210 nm. Metomil foi utilizado como padrão interno. Água e meio sintético foram utilizados como solventes. O método foi linear de 0,49-15,0 mg L-1 (r2 > 0,9985), 0,1-5,0 mg L-1 (r2 > 0,9974) e 0,1-5,0 mg L-1 (r2 > 0,9987) para o aldicarbe, sulfóxido de aldicarbe e sulfona de aldicarbe, respectivamente. A linearidade do método foi confirmada pelo teste F (ANOVA) através dos testes de ajuste do modelo linear, validade da regressão e eficiência da regressão. Os limites de detecção na água e em meio sintético foram de 0,391/0,440 mg L-1, 0,069/0,192 mg L-1 e 0,033/0,068 mg L-1 para o aldicarbe, sulfóxido de aldicarbe e sulfona de aldicarbe, respectivamente. O tempo total de análise foi de 22 minutos. Na aplicação do método, avaliou-se a degradação do aldicarbe no reator anaeróbio horizontal de leito fixo (RAHLF) em diferentes condições operacionais (metanogênese, sulfetogênese e desnitrificação).
This study describes the development and validation of a high-performance liquid chromatography (HPLC) method for detecting aldicarb and its residues in liquid samples without pretreatment. The HPLC system was equipped with a C-18 column and the mobile phase was composed of a mixture of water and acetonitrile using a linear gradient elution. The UV detector was utilized at 210 nm. Methomyl was used as an internal standard. Water and synthetic medium were used as solvents. The method was linear from 0.49-15.0 mg L-1 (r2 > 0.9985), 0.1-5.0 mg L-1 (r2 > 0.9974) and 0.1-5.0 mg L-1 (r2 > 0.9987) for aldicarb, aldicarb sulfoxide and aldicarb sulfone, respectively. The linearity of the method was confirmed by the ANOVA F-test through adjustment of the linear model, validity of the regression and efficiency of the regression tests. The limit of detection in water and synthetic medium were of 0.391/0.440 mg L-1, 0.069/0.192 mg L-1 and 0.033/0.068 mg L-1 for aldicarb, aldicarb sulfoxide and aldicarb sulfone, respectively. Total time of analysis was of 22 min. In the application of the method, the aldicarb degradation in horizontal-flow anaerobic immobilized biomass (HAIB) reactor was evaluated under different conditions (methanogenic, sulfidogenic and denitrifying).
Keywords: aldicarb, bioremediation, carbamate, HPLC, validation
Introduction
Aldicarb, the active ingredient in Temik®, is the common
name for 2-methyl-2-(methylthio)propionaldehyde O-(methylcarbamoyl)-oxime, represented by the molecular formula C7H14N2O2S. It is a systemic carbamate insecticide of broad-spectrum used to control a variety of insects, mites and nematodes. It inhibits the action
of acetylcholinesterase (AChE), which is an essential enzyme of a common metabolic pathway shared by insects and mammalians.1
potentially hazardous as a result of accidental spills and runoff from areas of application.3
In United States, aldicarb, aldicarb sulfoxide and aldicarb sulfone were detected in groundwater in the range of 0.08-1264.00 µg L-1, 0.01-1030.00 µg L-1 and
0.08-153.00 µg L-1, respectively.4 In Brazil, the lack of an
integrated management program of groundwater does not allow the control of the pollution caused by pesticides.5
However, the aldicarb was detected in maximum concentration of 5 µg L-1 in rural water supply.6
In the presence of microorganisms, aldicarb degradation occurs by two routes: oxidation to aldicarb sulfoxide and later to aldicarb sulfone (aerobic conditions); or hydrolysis of aldicarb and its residues to the corresponding oximes (anaerobic conditions).1
Aldicarb and its oxidation products can be determined in terms of their nitrile derivatives by capillary gas chromatography with a nitrogen-phosphorus detector.7
On the other hand, gas chromatographic procedures are difficult to perform due to several factors: (i) many of these
compounds are thermally unstable, (ii) samples must be
extracted and treated before analysis, and (iii) speciation of
the residues requires an additional liquid chromatographic clean-up step.8 The determination of carbamates by
capillary electrophoresis (CE)9 and micellar electrokinetic
chromatography (MEKC)10 has also been reported.
Aldicarb and its degradation products in water may be determined by high-performance liquid chromatography (HPLC).11 HPLC offers a simple and rapid method for
determination of aldicarb and its residues.8
EPA Method 531.1 is applicable to the determination of certain N-methylcarbamoyloximes and N-methylcarbamates in groundwater and finished drinking water. This method employs the direct analysis of a water sample with a HPLC separation and post-column derivatization to a compound detected with a fluorescence detector.12 The filtered sample
(400 µL) is injected into a reversed-phase HPLC column. Separation of the analytes is achieved using methanol and water as the mobile phase in gradient elution. After elution, the analytes are hydrolyzed with 0.05 mol L-1
sodium hydroxide (NaOH) at 95 °C. The methylamine formed is then reacted with o-phthalaldehyde (OPA) and
2-mercaptoethanol to form a highly fluorescent derivative which is measured by a fluorescence detector.
A method to determine an aldicarb and its residues by HPLC with UV detection (λ= 200 nm) in groundwater samples without pretreatment was developed earlier.8
Acetonitrile and water were used as the mobile phase in two isocratic runs (12:88/40:60) to separate all aldicarb compounds (aldicarb, aldicarb sulfoxide, aldicarb sulfone and its respective nitriles and oximes). This protocol was
adapted by using gradient elution in a single chromatographic run and using methomyl as an internal standard.13
In HPLC systems, different detectors have been evaluated, such as electrospray mass spectrometry (ES-MS)14 and atmospheric pressure chemical ionization
mass spectrometry (APCI-MS).15 Although the precision
increases with the use of these techniques, the cost of the equipment is significant.
Usually, the methods involve extraction or other sample preparation steps (solid-phase extraction (SPE)10,14,15 or
liquid-liquid extraction (LLE)15) that can cause spurious results
and that are time-consuming. Simpler approaches that do not require additional handling or previous sample preparation are reported to affect positively the precision of the chemical determination and experimental errors are reduced.8 Therefore,
the purpose of this work was to develop and validate a HPLC method for determination of aldicarb, aldicarb sulfoxide and aldicarb sulfone in liquid samples without pretreatment. This method was applied to evaluate the degradation of aldicarb in a packed-bed anaerobic reactor under different conditions (methanogenic, sulfidogenic and denitrifying).
Experimental
Instrumentation and analytical conditions
A Shimadzu® liquid chromatography system equipped
with a LC-10ADVP pump, a FCV-10ALVP valve, an ultraviolet detector with diode array (SPD-M10 AVP), a controller SCL-10AVP and a Rheodyne injector (100-µL loop) was used. The HPLC was equipped with an Agilent Zorbax ODS® C-18 column (mesh size: 5 µm; length:
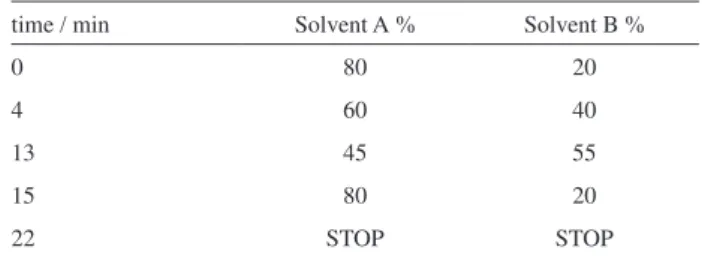
25 cm; internal diameter: 4.6 mm). Aldicarb and its residues were separated by using a linear gradient elution program and the mobile phase was a mixture of water and acetonitrile (Table 1). The flow rate was 1.2 mL min-1 and
the temperature of the oven was 40 ºC. The UV detector was fixed at λ=210 nm. The methomyl was used as an internal standard. This protocol was a modification of a procedure reported earlier.8,13
Table 1. HPLC programming showing the gradient of the mobile phase used to determine aldicarb and its residues
time / min Solvent A % Solvent B %
0 80 20
4 60 40
13 45 55
15 80 20
22 STOP STOP
Chemicals and solvents
Analytical standards of aldicarb (purity 99%), aldicarb sulfoxide (purity 99%), aldicarb sulfone (purity 99%) and methomyl (purity 95%) were obtained from Radian International®, Ultra Scientific®, ChemService® and
AccuStandard®, respectively. The acetonitrile was obtained
from JT Baker® (HPLC-grade) and the water was
ultra-purified in a Millipore MilliQ® system.
Preparation of samples
The samples were prepared in glass volumetric flasks (5 mL) by addition of 200 µL of a solution of methomyl in water (115.2 mg L-1) and by dilution of different volumes
of samples (2, 3 or 4 mL) in ultra-purified water. Before the injection, the samples were passed through a 0.2 µm-pore-size Millipore® filter.
Method validation
The HPLC method was validated by the determination of its precision within the linear range of the data, instrumental precision, and limits of detection (LOD) and quantification (LOQ) according to methodology developed previously.16
The standard calibration curves were obtained by the
dilution of three reference standard solutions (94.4 mg L-1,
20 mg L-1and 20 mg L-1, for aldicarb, aldicarb sulfoxide and
aldicarb sulfone, respectively) with three replicates each. The dilution was made in ultra-purified water and in synthetic medium17 to obtain the concentrations shown in Table 2.
Linearity
The linearity of the detector response for the prepared standards was assessed by means of linear regression analysis (least-square regression method), for the amounts of each standard, measured in mg L-1, and its response factor
(RF) (area of the corresponding peak/area of methomyl). The statistical significance of regression was evaluated using the ANOVA table constructed from equations shown in Table 3 and by adjustment of the linear model (ALM), validity of the regression (VR) and efficiency of the regression (ER) tests (Table 4), according to method developed previously.18,19
Table 2. Concentrations of analytes used in standard calibration curves
Analyte Concentrations / (mg L-1)
Aldicarb 0.49; 1.0; 2.49; 5.0; 10.0; 11.99; 15.0. Aldicarb sulfoxide 0.1; 0.3; 0.5; 1.0; 2.0; 4.0; 5.0. Aldicarb sulfone 0.1; 0.3; 0.5; 1.0; 2.0; 4.0; 5.0.
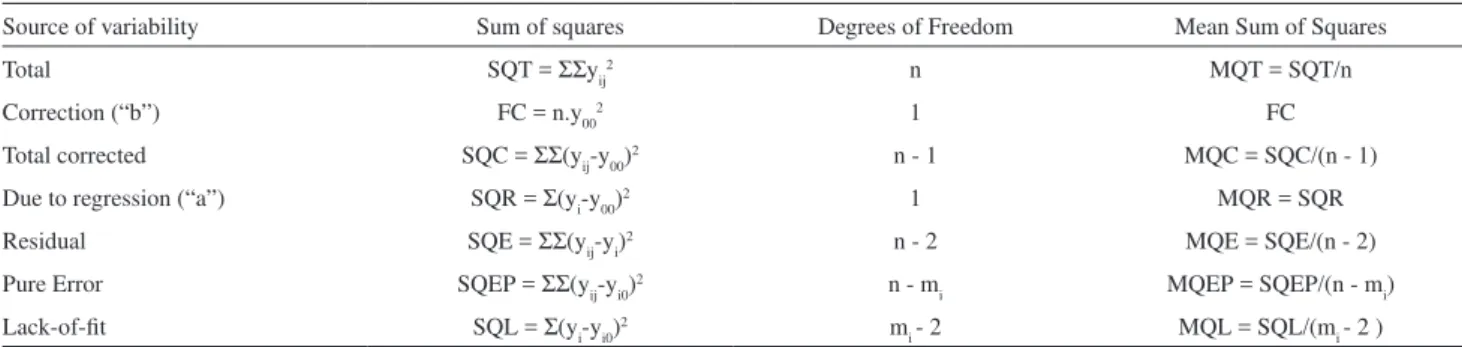
Table 3. Mean sum of squares and degrees of freedom used in F-test (ANOVA)
Source of variability Sum of squares Degrees of Freedom Mean Sum of Squares
Total SQT = ΣΣyij2 n MQT = SQT/n
Correction (“b”) FC = n.y002 1 FC
Total corrected SQC = ΣΣ(yij-y00)2 n - 1 MQC = SQC/(n - 1)
Due to regression (“a”) SQR = Σ(yi-y00)2 1 MQR = SQR
Residual SQE = ΣΣ(yij-yi)2 n - 2 MQE = SQE/(n - 2)
Pure Error SQEP = ΣΣ(yij-yi0)2 n - m
i MQEP = SQEP/(n - mi)
Lack-of-fit SQL = Σ(yi-yi0)2 m
i - 2 MQL = SQL/(mi - 2 )
n = total number of measurements; mi = i-concentration levels (7); yij = observed signal; y00 = mean of measured signals; yi = predicted dependent variable; yi0 = mean of replicates of i-concentration level; “i” index refers to x-independent variable; “j” index refers to replicates in x-levels. First summation Σ ranges from i=1 to i=mi. Second summation ΣΣ in SQC, SQE and SQEP ranges from i=1 to j=ni.
Table 4. Linearity and regression efficiency tests
Test Fcritical Fobtained Condition
Adjustment of the linear model (ALM) Fmi - 2;n- mi;α/2 MQL/MQEP Fobtained < Fcritical Validity of the regression (VR) F1;n - 2;α/2 MQR/MQE Fobtained >> Fcritical
Efficiency of the regression (ER)
Efficiency (r2) SQR/SQC
Maximum efficiency (r2
Limit of Detection (LOD) and Limit of Quantification (LOQ)
The LOD and LOQ for each standard were determined from the calibration curves, where the root mean square error (RMSE) was calculated according to the following expressions:20
LOD = (3 × RMSE) / m (1)
LOQ = (10 × RMSE) / m (2)
where RMSE is the root mean square error and m is the
slope of the linear regression equation.
Precision
The precision of the system was expressed as the coefficient of variation (CV%) of the retention times for each standard, at different concentrations (Table 2).
Instrumental precision
The instrumental precision of the assay (as coefficient of variation, CV%) was estimated by the retention time of ten repeated injections of the standard solution in synthetic medium with aldicarb, aldicarb sulfoxide and aldicarb sulfone at concentrations of 4 mg L-1.
Experimental samples collected from anaerobic packed-bed reactors treating aldicarb
The method was evaluated through analysis of aldicarb and its residues in different liquid samples
from influent and effluent streams of horizontal-flow anaerobic immobilized biomass (HAIB) reactors under different conditions (methanogenic, sulfidogenic and denitrifying). The 2L HAIB reactors were composed of a 1.0 m glass tube with diameter of 5 cm and length-to-diameter ratio (L/D) of 20.21 Intermediate sampling
ports were allocated along the reactor at L/D of 4, 8, 12 and 16. The three reactors were operated simultaneously at constant hydraulic detention time of 24 hours at a temperature of 30 ± 1 °C. The synthetic medium contained aldicarb (from commercial product - Temik®) as the sole
carbon and energy source (10 mg L-1), besides solutions
of salts, vitamins and trace metals.17 Sulphate (36 ±
2 mg L-1) and nitrate (20 ± 1 mg L-1) were added in the
sulfidogenic and denitrifying reactors, respectively. All reactors were filled with polyurethane foam cubic particles previously inoculated with anaerobic biomass. Aldicarb concentration data were obtained during operation to evaluate the process of degradation of aldicarb in anaerobic bioreactors.
Results and Discussion
Determination of aldicarb, aldicarb sulfoxide and aldicarb sulfone
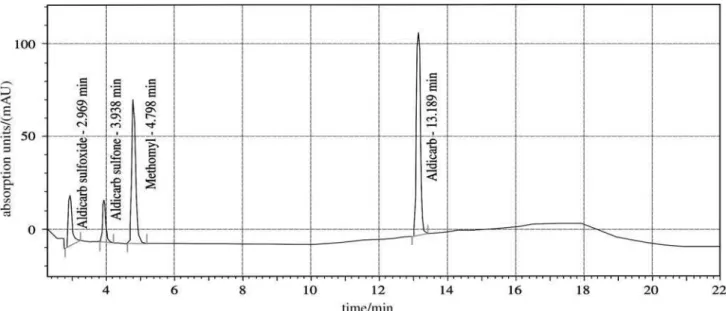
The selected chromatographic conditions were ideal for the identification of individual peaks, resulting in good and well-resolved separation of the analytes, as can be seen in a typical chromatogram shown in Figure 1. It was necessary to use a delay of 2.3 minutes to avoid the
interference of substances that are present in the synthetic medium. Although aldicarb peak come off at 13.16 min (Table 8), it was necessary to flush the column to avoid interference between samples, returning to the initial gradient of the mobile phase. Tests had been carried through to minimize the time, however without success, either for the variation of the retention times or for the appearance of ghost peaks.
Method validation
The standard calibration curves in the investigated range were linear, both with water and with synthetic medium as solvents for the standard solutions. Table 5 summarizes the regression data of the calibration curves, squares of correlation coefficients (r2) and maximum squares of
correlation coefficients (r2
max) of each analyte. Table 6
summarizes the results of linearity tests for a statistical significance of 95%.
According to method developed previously,18,19 in the
adjustment of the linear model (ALM) test, if the F-test values obtained from ANOVA (Fobtained) are inferior to the statistical F-test values (Fcritical) (Fobtained < Fcritical), then the adjustment of the model is considered satisfactory. The validity of the regression (VR) test demonstrates that the
slope of the linear regression equation is different than zero. If the F-test values obtained from ANOVA (Fobtained) are superior to the statistical F-test values (Fcritical) (Fobtained >> Fcritical), it is an indication that the m value is not null. The results showed that the squares of the linear correlation coefficients were above 0.99 (Table 5), evidencing the linearity occurrence.22 The regression of standard curves
in ultra-purified water and in synthetic medium was statistically significant since the statistical test did not exceed the critical value.
The values of r2 and maximum squares of correlation
coefficients (r2
max) were similar. This indicates that the
error due to regression is close to the pure error that must be due to the analytical procedure, validating the use of the linear model.
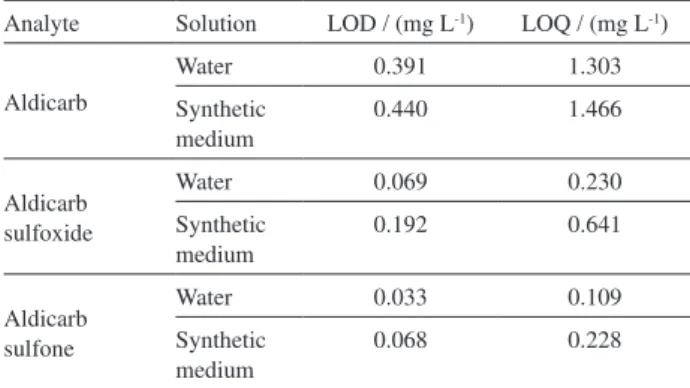
The LOD and LOQ values were smaller for the standard solutions in water than those obtained in synthetic medium as solvent (Table 7). The precision of the method and instrumental precision of the assay was estimated by coefficient of variation (CV) of retention times (Table 8). The precision of the method was measured from standard calibration curves in synthetic medium, with CV lower than 3.32%. The instrumental precision, estimated from ten injections of the same standard solution in synthetic medium, resulted in a range from 0.8% to 1.56%. Values below 5% demonstrate the precision of the method.22
Table 5. Regression curves and regression efficiency tests
Analyte Solution Equation r2 r2
max
Aldicarb Water y=0.2385x+0.0274 0.9985 0.9989
Synthetic medium y=0.2380x+0.0262 0.9989 0.9995
Aldicarb sulfoxide Water y=0.2458x-0.0125 0.9996 0.9997
Synthetic medium y=0.2590x+0.0611 0.9974 0.9983
Aldicarb sulfone Water y=0.2599x-0.0044 0.9987 0.9987
Synthetic medium y=0.2510x+0.0026 0.9997 0.9998
Table 6. Results of linearity tests for statistical significance at 95 percent
Analyte Solution ALM VR
F5;14;0.025 Fobtained F1;19;0.025 Fobtained
Aldicarb Water
3.66
1.07
5.92
12298.07
Synthetic medium
2.90 17938.19
Aldicarb sulfoxide
Water 1.12 46388.27
Synthetic medium
1.46 7142.34
Aldicarb sulfone
Water 0.06 14921.74
Synthetic medium
1.45 56144.86
Table 7. Limit of detection (LOD) and limit of quantification (LOQ) of analytes in water and synthetic medium
Analyte Solution LOD / (mg L-1) LOQ / (mg L-1)
Aldicarb
Water 0.391 1.303
Synthetic medium
0.440 1.466
Aldicarb sulfoxide
Water 0.069 0.230
Synthetic medium
0.192 0.641
Aldicarb sulfone
Water 0.033 0.109
Synthetic medium
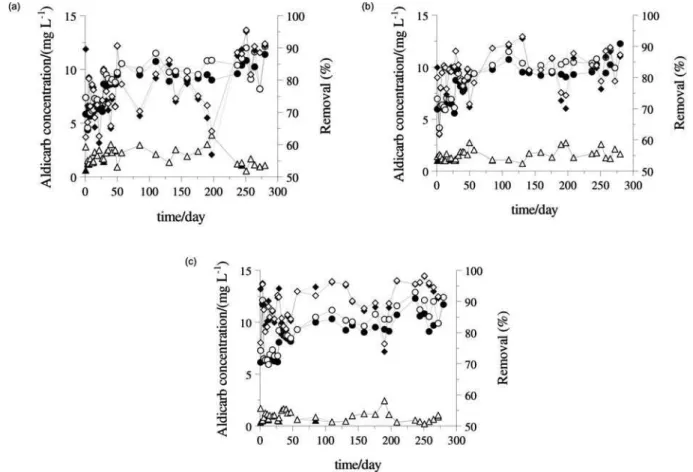
Figure 2. Temporal variation of aldicarb (influent - ; effluent - )/total aldicarb (influent - ; effluent - ) concentration and aldicarb (—)/total aldicarb (---) removal efficiency in methanogenic reactor (a), sulfidogenic reactor (b) and denitrifying reactor (c).
Table 8. Precision and instrumental precision of method for each analyte in synthetic medium
Analyte Precision Instrumental precision
tret / mina,b CV / (%)b t
ret / mina,c CV / (%)c
Aldicarb sulfoxide 2.949±0.098 3.32 2.946±0.038 1.29
Aldicarb sulfone 3.988±0.084 2.10 4.001±0.059 1.47
Methomyl 4.873±0.098 2.02 4.892±0.076 1.56
Aldicarb 13.166±0.129 0.982 13.270±0.106 0.80
aRetention times are mean ± SD. bValues obtained of standard calibration curves (n = 3). cValue obtained of repeated injections of the standard solution
(n = 10).
Application
Figure 2 shows the values of aldicarb concentrations in influent and effluent of the HAIB reactor in methanogenic, denitrifying and sulfidogenic conditions (to an initial concentration of 10 mg L-1). In the evaluation of the
process, the degradation/removal of total aldicarb (TA) must be considered (sum of aldicarb, aldicarb sulfoxide and aldicarb sulfone). This consideration is common in studies with aldicarb, since these substances present similar toxicity and therefore have to be removed in the bioremediation process. The
denitrifying reactor presented more stable TA removal than the other reactors, and with higher removal efficiency (Table 9).
At the beginning of the operation of the reactors, aldicarb sulfoxide and aldicarb sulfone were detected in the effluent streams. Later, this residues were not detected indicating the acclimatization of the anaerobic organisms to the established conditions.13 Their respective hydrolysis
products, oximes and subsequent products, are much less toxic.1 Assuming the degradation of the non-detected
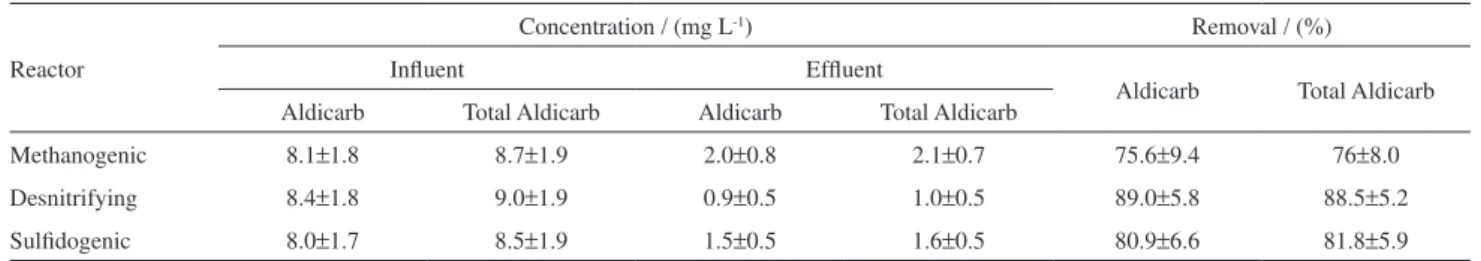
Table 9. Aldicarb concentration and aldicarb removal efficiency in methanogenic, denitrifying and sulfidogenic reactors
Reactor
Concentration / (mg L-1) Removal / (%)
Influent Effluent
Aldicarb Total Aldicarb Aldicarb Total Aldicarb Aldicarb Total Aldicarb
Methanogenic 8.1±1.8 8.7±1.9 2.0±0.8 2.1±0.7 75.6±9.4 76±8.0
Desnitrifying 8.4±1.8 9.0±1.9 0.9±0.5 1.0±0.5 89.0±5.8 88.5±5.2
Sulfidogenic 8.0±1.7 8.5±1.9 1.5±0.5 1.6±0.5 80.9±6.6 81.8±5.9
Conclusions
The HPLC method for the determination of aldicarb, aldicarb sulfoxide and aldicarb sulfone in liquid samples without pretreatment was shown to be specific, precise and accurate. The generated chromatograms were ideal for the identification of individual peaks with significant correlation and reproducibility regarding their readings of standard solutions.
The statistical analysis demonstrated that the standard curves in the investigated range were linear, from 0.49-15.0 mg L-1 (r2>0.9985), 0.1-5.0 mg L-1 (r2>0.9974) and
0.1-5.0 mg L-1 (r2>0.9987) for aldicarb, aldicarb sulfoxide
and aldicarb sulfone, respectively. The limit of detection in water and synthetic medium were of 0.391/0.440 mg L-1,
0.069/0.192 mg L-1 and 0.033/0.068 mg L-1 for aldicarb,
aldicarb sulfoxide and aldicarb sulfone, respectively. Total time of analysis was of 22 min.
The results provide evidence that the HPLC system and the method are adequate for monitoring biodegradation of aldicarb in anaerobic reactors.
Acknowledgments
This research was suppported by Fundação de Amparo à Pesquisa do Estado de São Paulo (FAPESP) (Process Number 03/10506-7) and Conselho Nacional de Desenvolvimento Científico e Tecnológico (CNPq) (Process Number 471764/20043). The authors are grateful to Bayer CropScience® for donation of the commercial product.
References
1. Andrawes, N. R.; Bagley, W. P.; Herret, R. A.; J. Agric. Food Chem. 1971, 19, 727.
2. Barbosa, T. M. L.; Rigitano, R. L. O.; Pesq. Agropec.Bras.
1994, 29, 955.
3. Chaudhry, G. R.; Wheeler, W. B.; Water Sci. Technol.1988, 20,
89.
4. USEPA; Pesticides in Groundwater Database, a Compilation of Monitoring Studies: 1971-1991. USEPA: Washington, DC, 1992.
5. Corrêa, M. M.; Lima, L. A.; Martinez, M. A.; Rigitano, R. L. O.; Sampaio, S. C.; Rev. Bras. Eng. Agríc. Ambient. 1999, 3,
217.
6. Rigitano, R. L. O.; Gouvêa, A. V.; Abstracts of the 15º Congresso Brasileiro de Entomologia, Caxambu, Brazil, 1995.
7. Zhong, W. Z.; Lemley, A. T.; Spalik, J.; J. Chromatogr., A1984,
299, 269.
8. Miles, C. J.; Delfino, J. J.; J. Chromatogr., A1984, 299, 275.
9. Jandik, P.; Bonn, G.; Capillary Electrophoresis of Small Molecules and Ions, VCH Publishers: New York, 1993.
10. Arraéz-Román, D.; Segura-Carretero, A.; Cruces-Blanco, C.; Fernández-Gutiérrez, A.; Pest Manage. Sci.2004, 60, 675.
11. WHO; Aldicarb, World Health Organization: Geneva, 1991. 12. M u n c h , J . W. ; M e t h o d 5 3 1 . 1 M e a s u re m e n t o f
N-methylcarbamoyloximes and n-Methylcabamates in Water by Direct Aqueous Injection HPLC with Post Column Derivatization (Revision 3.1), EPA: Cincinnati, 1995. 13. Kazumi, J.; Capone, D. G.; Appl. Environ. Microbiol. 1995, 61,
2820.
14. Di Corcia, A.; Nazzari, M.; Rao, R.; Samperi, R.; Sebastiani, E.; J. Chromatogr., A2000, 878, 87.
15. Nunes, G. S.; Alonso, R. M.; Ribeiro, M. L.; Barceló, D.;
J. Chromatogr., A2000, 888, 113.
16. Duarte, I. C. S.; Oliveira, L. L.; Buzzini, A. P.; Adorno, M. A. T.; Varesche, M. B. A.; J. Braz. Chem. Soc.2006, 17, 1360. 17. Angelidaki, I.; Petersen, S. P.; Ahring, B. K. Appl. Microbiol.
Biotechnol. 1990, 33, 469.
18. Chui, Q. S. H.; Zuchini, R.; Lichtig, J.; Quim. Nova2001, 24,
374.
19. Chui, Q. S. H.; J. Braz. Chem. Soc.2007, 18, 424.
20. Lee, P. W.; Handbook of Residue Analytical Methods for Agrochemicals; John Wiley & Sons: Chichester, 2003.
21. Zaiat, M.; Cabral, A. K. A.; Foresti, E.; Rev. Bras. Eng. Quim.
1994, 11, 33.
22. ANVISA. Administrative rule RE No. 899, National Health Surveillance Agency: Brasília, 2003.
Received: December 4, 2007 Web Release Date: July 23, 2008