Artigo
*e-mail: [email protected]
STABILITY-INDICATING METHODS FOR QUANTITATIVE DETERMINATION OF ZIDOVUDINE AND STAVUDINE IN CAPSULES
Maria Inês R. M. Santoro*, Andréia M. Taborianski, Anil Kumar Singh e Erika R. M. Kedor-Hackmann Departamento de Farmácia, Faculdade de Ciências Farmacêuticas, Universidade de São Paulo, CP 66355, 05389-970 São Paulo - SP
Recebido em 2/3/05; aceito em 5/8/05; publicado na web em 20/1/06
Zidovudine (AZT) and stavudine (D4T) are nucleoside reverse transcriptase inhibitors extensively used in human immunodeficiency virus (HIV) infected patients. In order to evaluate the quality of these drugs, two stability indicating HPLC methods were developed. The validated methods were applied in quantitative determination of AZT, D4T and their induced degradation products in capsule preparations. The stability studies were conducted at controlled temperature and relative humidity conditions based on the International Conference on Harmonization stability studies protocol for Zone IV areas. Easy sample preparation and low-cost make these methods especially useful for quality control and stability studies of AZT and D4T in drug products.
Keywords: liquid chromatography; antiviral drugs, stability studies.
INTRODUCTION
Zidovudine (3'-azido-3'-deoxythyimidine) (AZT) and stavudine (3'-deoxy-2'-thymidinene; 3'-deoxythymidin-2'-ene) (D4T) are most widely used substances in acquired immunodeficiency syndrome (AIDS) treatment. These antiviral agents have potent inhibitory effect on human immunodeficiency virus (HIV)1-3. For quantitative determi-nation of there antiretroviral agents several analytical techniques has been used, such as thin layer chromatography4,5, derivative ultraviolet spectrometry6,7, capillary electrophoresis8-10 and high performance liquid chromatography (HPLC)11-39. Amongst these the later is a well-accepted analytical technique for quantitative determination of active pharmaceutical ingredients. The refereed HPLC methods had been described for AZT and D4T determination in biological fluids and to a lesser extent in drug products40, 41. Majority of these methods involve expensive and difficult instrumentation such as column-switching, gradient chromatographic systems and tandem mass spectropho-tometric detectors that makes these methods inaccessible for routine quality control and stability studies applications. In this paper are
described simple and rapid methods for quantitative determination of AZT and D4T and thymine, a degradation product, in capsule samples by reverse phase HPLC. The HPLC method allows AZT, D4T and thymine determination in a shorter interval of time. Early peak elution, easy sample preparation and inexpensive aqueous solvents make these methods especially useful in quality control and in routine analysis of AZT and D4T as well as thymine (a known degredent) in drug products.
EXPERIMENTAL PART Apparatus
The HPLC separations were made on a system consisting of a Varian® solvent delivery pump (model 5000) and a Varian® variable ultraviolet (UV) detector (model 4000) set at 265 nm connected to a Varian® integrator (model 4400). The system was equipped with a Rheodyne® 7125 injection valve fitted with a 20 µL loop.
Reagents and solutions
All reagents and solvents were of analytical grade. Methanol (Merck®) used in the mobile phase was of HPLC grade. Purified water was prepared by a MilliQ® Plus water purification system (Millipore®, São Paulo, Brazil). All the solutions and mobile phases were prepared fresh on the same day. All solvents and solutions for HPLC analysis were filtered through a membrane filter (Durapore® hydrophilic filtration membrane, PVDF 0,45 µm pore size) and degassed by sonication for 20 min before use. AZT (100 mg/ capsule), D4T (40 mg/capsule) samples and their placebos were kindly donated by State Government Laboratory (FURP, São Pau-lo, Brazil). Thymine was supplied by Avocado Research Chemicals Ltd. (Heysham, UK).
Chromatographic conditions
All tests were carried out at room temperature (25 ± 2 °C). The analytical column was a LiChrospher® 100 RP-18 (125 x 4.0 mm, 5 µm). The mobile phase constituted of methanol-water (25:75 v/v)
for AZT and (15:85 v/v) for D4T, at a flow rate of 1.0 mL min-1. The system was washed with the mobile phase for at least 60 min prior to analysis of samples.
Calibration curves
Solutions of AZT ranging from 70.0 to 150.0 µg/mL and solutions of thymine ranging from 0.5 to 4.0 µg/mL were prepared in methanol:water (25:75 v/v) and solutions of D4T ranging from 30.0 to 100.0 µg/mL and thymine 0.8 to 2.0 µg/mL were prepared in methanol:water (15:85 v/v). At each concentration level, triplicate standard solutions were analyzed. The calibration curves were constructed by plotting the mean peak areas against corresponding concentration of AZT, D4T and thymine.
AZT solution preparation
An amount of sample equivalent to 100.0 mg of AZT was accurately weighed and transferred to a 100 ml volumetric flask. About 50 ml of methanol was added, followed by sonication for 30 min and the volume was made up with the same solvent. The obtained solution contains 1000.0 µg/mL of AZT. Standard solutions of AZT were prepared in a similar manner to obtain 1000.0 µg of AZT per milliliter. Further dilutions of sample as well as standard solutions were made with mobile phase and were filtered before analysis.
D4T solution preparation
An amount of sample equivalent to 50.0 mg of D4T was accurately weighed and transferred to a 100 mL volumetric flask. About 50 mL of water was added, followed by sonication for 30 min and the volume was made up with the same solvent. The obtained solution contains 500.0 µg/mL of D4T. Standard solutions of D4T were prepared in a similar manner to obtain 500.0 µg/mL of D4T. Further dilutions of sample as well as standard solutions were made with mobile phase and were filtered before analysis.
Thymine solution preparation
Accurately weighed 100 mg of thymine was transferred to 100 mL volumetric flask. About 50 mL of methanol was added, followed by sonication for 30 min, and the volume was made up with the same solvent. A 1.0 ml aliquot of filtered solution was transferred to a 50 mL volumetric flask and diluted to volume with methanol to obtain 20.0 µg of thymine/mL. The above solution was diluted with the respective mobile phases to construct calibration curve and for analysis of thymine along with AZT or D4T. All standard and sample solutions were filtered before injection (20 µL) into the HPLC system.
Specificity and selectivity
The interference from endogenous compounds was investigated by the analysis of three different blank matrices under the same analytical conditions used for sample analysis. The blank matrices were prepared by mixing all the excipients present in pharmaceutical products under investigation.
Accuracy of chromatographic method
Accuracy of the proposed chromatographic methods was determined based on the recovery of standard from the spiked sample matrices. A known quantity of AZT standard solution was spiked
into sample solution, followed by quantitative recovery of added standard using proposed method. For this purpose, 5.0 mL aliquots of sample solution (1000.0 µg/mL) were transferred to five 50 mL volumetric flasks. Five different aliquots (0.5, 1.0, 1.5, 2.0 and 2.5 mL) of standard containing 100.0 µg/mL of AZT were added to flasks containing sample solutions. The volumes were made to mark with mobile phase (methanol:water 25:75 v/v) to obtain spiked solution containing 110.0, 120.0, 130.0, 140.0, 150.0 µg of AZT/mL.
Similar process was adapted to study D4T recovery from sample matrix. A series of 3.0 mL aliquots of sample solution (500.0 µg/ mL) was transferred to five 25 mL volumetric flasks. Five different aliquots (0.5, 1.0, 1.5, 2.0 and 2.5 mL) of standard containing 500.0 µg/mL of D4T were added to flasks containing sample solutions. The volumes were made to mark with mobile phase (methanol:water 15:85 v/v) to obtain spiked solution containing 70.0, 80.0, 90.0, 100.0, 110.0 µg of D4T/mL.
Stability studies on drug product
International Conference on Harmonization Protocols on Stability Testing of New Drug Substances and Products42 were followed in order to evaluate stability of AZT and D4T. In short, drug products were stored in predefined temperature and humidity conditions (25 ºC/70%, 40 ºC/75%, 50 ºC/90%) conditions for 90 days period. Appropriate quantities of samples were collected from stored drug products and analyzed with proposed method. The quantity of AZT, D4T and respective degradation product (thymine) were expressed as percentage of original quantity.
RESULTS AND DISCUSSION
The chromatogram of AZT and thymine standard and sample can be observed in Figure 2. These substances were separated in reverse phase mode, using a mixture of methanol:water (25:75 v/v) as the mobile phase. The AZT could be eluted rapidly from column by increasing methanol content in mobile phase; however, the retention time of thymine was also reduced drastically. In order to obtain separate eluted peaks of AZT and thymine, in a shortest period, the methanol content was optimized to 25%. The chromatogram of D4T and thymine standard and sample can be observed in Figure 3. System suitability tests are an integral part of the liquid chromatographic method. Precision and accuracy of two proposed methods were determined to prove the adequacy of the system for analysis. The proposed methods were validated based on carefully selected validation parameters indicated by Association of Official Analytical Chemists International and International Conference on Harmonization of Technical Requirements for Registration of Pharmaceuticals for Human Use (ICH)43, 44.
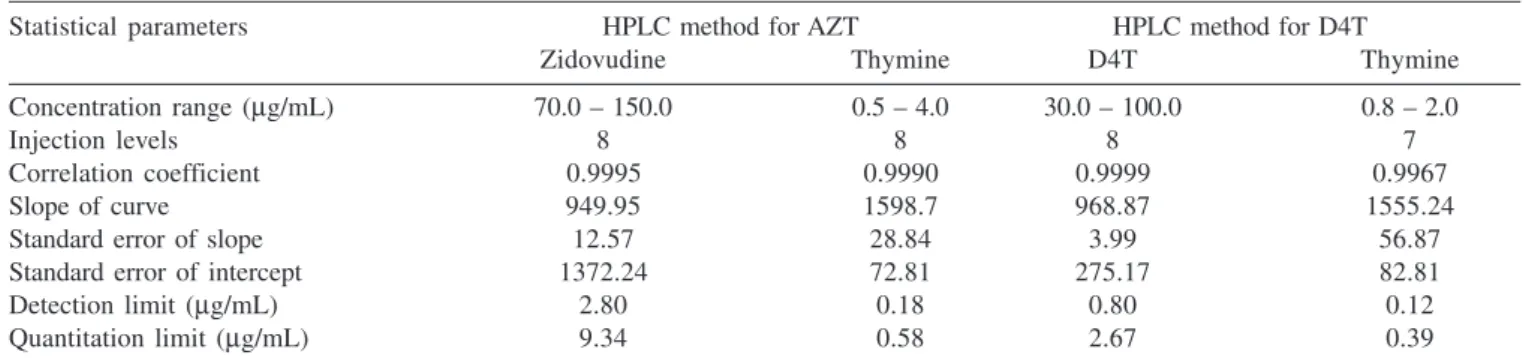
HPLC method for AZT and thymine showed linearity in a concentration range from 70.0 to 150.0 µg/mL and 0.5 to 4.0 µg/ mL, respectively with a correlation coefficient of 0.9995 and 0.9990, respectively. The second HPLC method for D4T and thymine showed linearity in a concentration range from 30.0 to 100.0 µg/ mL and 0.8 to 2.0 µg/mL, respectively with a correlation coefficient of 0.9999 and 0.9967, respectively (Table 1).
amongst responses (n=10) of AZT was 0.79% and those amongst D4T was 1.05%. The statistical data obtained in the analysis of commercially available sample are shown in Table 2.
The recovery tests and the percentage of recovery were deter-mined according to the recommendations of AOAC International43. The mean recovery of AZT and D4T standards from respective spiked sample solutions were 100.21and 100.39% (RSD <2%) as determined at five different levels within the linear dynamic range of the standard curves. The results for percentage of recovery are presented in Table 3 whereupon substantiate accuracy of proposed methods.
Minor peaks were observed in the analysis of AZT capsule analysis, however these peaks do not interfere in the analysis. Fi-gure 2 presents chromatograms of AZT standard, sample and placebo where as Figure 3 presents chromatograms of D4T standard, sample and placebo. In AZT and D4T placebo analysis, no interfering peak was observed.
According to ICH classification, Brazil belongs to climatic zone IV and has an average temperature of 26 ºC with 70% relative humidity (RH). According to ICH42, in climatic zone IV regions, accelerated stability studies should be carried out at 40 ºC / 75% Table 2. Statistical representation of the data obtained in the analysis
of commercially available samples using proposed methods
Method Sample Relative standard Confidence
deviation* (%) limit (95%)
HPLC for AZT AZT 0.79 98.20 ± 0.78
HPLC for D4T D4T capsules 1.05 98.52 ± 0.39
* average of 10 determinations
Table 1. Statistical results of linear regression analysis in the determination of AZT, D4T and thymine by proposed methods (n=2)
Statistical parameters HPLC method for AZT HPLC method for D4T
Zidovudine Thymine D4T Thymine
Concentration range (µg/mL) 70.0 – 150.0 0.5 – 4.0 30.0 – 100.0 0.8 – 2.0
Injection levels 8 8 8 7
Correlation coefficient 0.9995 0.9990 0.9999 0.9967
Slope of curve 949.95 1598.7 968.87 1555.24
Standard error of slope 12.57 28.84 3.99 56.87
Standard error of intercept 1372.24 72.81 275.17 82.81
Detection limit (µg/mL) 2.80 0.18 0.80 0.12
Quantitation limit (µg/mL) 9.34 0.58 2.67 0.39
Table 3. Recovery of zidovudine and stavudine standard solutions added to commercially capsule samples using proposed methods
Method Sample Amount added Amount found* Recovery Average recovery
(µg/mL) (µg/mL) (%) ± SD
10.0 9.97 99.70
HPLC method Zidovudine 20.0 20.18 100.90
for AZT capsules 30.0 30.35 101.17 100.21 ± 1.60
40.0 40.65 101.63
50.0 48.83 97.66
10.0 10.3 103.00
HPLC method Stavudine 20.0 20.15 100.75
for D4T capsules 30.0 29.80 99.33 100.39 ± 1.54
40.0 39.75 99.37
50.0 49.75 99.50
* average of three determinations
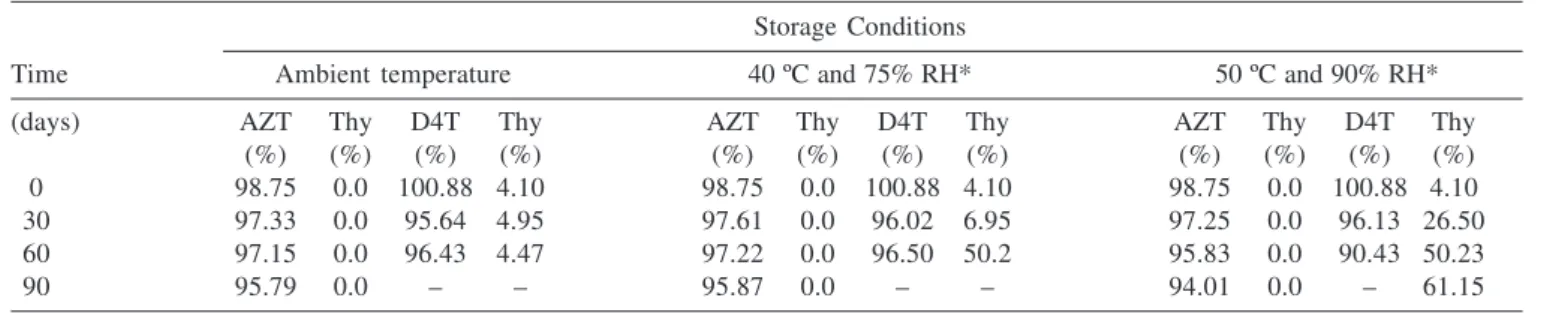
RH during 6 months period and at 50 ºC / 90% RH during 3 months period. The AZT present in zidovudine capsule sample presented no significant degradation at 40 ºC / 75% RH (Table 4). During 90 days study period at accelerated stability study conditions, no tra-ces of thymine impurities were detected, counter to expected results. On the other hand, D4T capsule samples presented traces of thymine (4.10%) in original sample. The D4T capsule sample stored at 50 ºC / 90% RH, presented more than ten fold increase in thymine concentration (61.15%) during 90 days study period. The AZT and D4T samples stored at 50 ºC/90% RH presented zero order degradation kinetics (Table 4).
CONCLUSION
The proposed methods enabled the separation and quantitative determination of AZT, D4T and thymine in capsules. UV detection at 265 nm was found to be suitable without any interference from capsules excipients and solvents in both methods. The ease of sample preparation, along with shorter retention time permits easy and efficient analysis of AZT and D4T in capsules. The repeatability and recovery tests performed with both methods confirmed their precision and accuracy. Both methods permit quantitative determination of synthetic impurity (thymine) present in respective capsule formulations. The proposed validated methods were successfully applied in the stability studies of AZT and D4T capsules. Both methods permitted quantitative determination of
thymine, with precision and accuracy, in samples submitted to accelerated degradation process. The accelerated stability studies confirm linear and constant degradation of AZT and D4T, obeying zero order kinetics, at elevated temperature (50 ºC) and relative humidity (90%).
ACKNOWLEDGMENTS
FAPESP (Fundação de Amparo à Pesquisa do Estado de São Paulo).
REFERENCES
1. Peçanha, E. P.; Antunes, O. A. C.; Tanuri, A.; Quím. Nova 2002, 25, 1108. 2. Bronker, M. E.; Dowegan, S. E.; Karney, W. W.; Mayers, D. L.; Navy Med.
1990, 81, 26.
3. Langtry, H. D.; Campoli-Richards, D. M.; Drugs1989, 37, 408. 4. Kaul, N.; Agrawal, H.; Paradkar, A. R.;Mahadik, K. R. JPC-J Planar
Chromatogr.2004, 17, 264.
5. Sankar, D. G.; Reddy, M. V. V. N.; Kumar, J. M. R.; Murthy, T. K.; Asian
J. Chem.2002, 14, 433.
6. Erk, N.; Pharmazie2004, 59, 106.
7. Uslu, B.; Ozkan, S. A.; Anal. Chim. Acta2002, 466, 175.
8. Agrofolio, L. A.; Cahours, X.; Tran, T. T.; Dessans, H.; Kieda, C.; Morin,
P.; Nucleosides, Nucleotides Nucleic Acids2001, 20, 375.
9. Cahours, X.; Morin, P.; Dessans, H.; Agrofolio, L. A.; Electrophoresis2002,
23, 88.
10. Cahours, X.; Dessans, H.; Morin, P.; Dreux, M.; Agrofoglio, L.; J.
Chromatogr., A2000, 895, 101.
11. Almudaris, A.; Ashton, D. S.; Ray, A.; Valko, K.; J. Chromatogr., A 1995,
689, 31.
12. Amari, J. V.; Brown, P. R.; Pivarnik, P. E.; Sehgal, R. K.; Turcotte, J. G.;
J. Pharm. Biomed. Anal. 1991, 9, 871.
13. Aymard, G.; Legrand, M.; Trichereau, N.; Diquet, B.; J. Chromatogr., B:
Anal. Technol. Biomed. Life Sci.2000, 744, 227.
14. Frijus-Plessen, N.; Michaelis, H. C.; Foth, H.; Karl, G. F.; J. Chromatogr. 1990, 534, 101.
15. Kamali, F.; Rawlins, M. D.; J. Chromatogr. 1990, 530, 474. 16. Kupferschmidt, R.; Schmid, R. W.; Clin. Chem. 1989, 35, 1313. 17. Lacroix, C.; Hoang, T. P.; Wojciechowski, F.; Duwoos, H.; Nouveau, J.; J.
Chromatogr. 1990, 525, 240.
18. Schrive, I.; Plasse, J. C.; J. Chromatogr., B: Anal. Technol. Biomed. Life Sci.1994, 657, 233.
19. Tan, X.; Boudinot, D.; J. Chromatogr., B: Anal. Technol. Biomed. Life Sci.
2000, 740, 281.
20. Alnouti, Y.; Lewis, S. R.; White, C. A.; Bartlett, M. G. Rapid Commun.
Mass Spectrom.2005, 19, 503.
21. Alnouti, Y.; White, C. A.; Bartlett, M. G.; Biomed. Chromatogr.2004, 18, 641. 22. Becher, F.; Pruvost, A.; Goujard, C.; Guerreiro, C.; Delfraissy, J. F.; Grassi,
J.; Benech, H.; Rapid Commun. Mass Spectrom.2002, 16, 555. 23. Brown, S. D.; White, C. A.; Bartlett, M. G. J. Liq. Chromatogr. Relat.
Technol.2002, 25, 2857.
24. Caufield, W. V.; Stewart, J. T. J. Liq. Chromatogr. Relat. Technol.2002,
25, 1791.
25. Clark, T. N.; White, C. A.; Bartlett, M. G.; Rapid Commun. Mass Spectrom.
2004, 18, 405.
Table 4. Results of AZT, D4T and thymine determination in capsules at ambient temperature (25 ± 2 ºC), 40 ºC (75% RH) and 50 ºC (90% RH) analyzed by proposed HPLC methods
Storage Conditions
Time Ambient temperature 40 ºC and 75% RH* 50 ºC and 90% RH*
(days) AZT Thy D4T Thy AZT Thy D4T Thy AZT Thy D4T Thy
(%) (%) (%) (%) (%) (%) (%) (%) (%) (%) (%) (%)
0 98.75 0.0 100.88 4.10 98.75 0.0 100.88 4.10 98.75 0.0 100.88 4.10
30 97.33 0.0 95.64 4.95 97.61 0.0 96.02 6.95 97.25 0.0 96.13 26.50
60 97.15 0.0 96.43 4.47 97.22 0.0 96.50 50.2 95.83 0.0 90.43 50.23
90 95.79 0.0 – – 95.87 0.0 – – 94.01 0.0 – 61.15
RH = relative humidity; Thy = Thymine; - = not determined
26. Ding, Y.; Williamson, L. N.; White, C. A.; Bartlett, M. G. J. Chromatogr.,
B: Anal. Technol. Biomed. Life Sci.2004, 811, 183.
27. Estrela, R. D. C. E.; Salvadori, M. C.; Suarez-Kurtz, G. Rapid Commun.
Mass Spectrom.2004, 18, 1147.
28. Fan, B.; Bartlett, M. G.; Stewart, J. T.; Biomed. Chromatogr.2002, 16, 383. 29. Fan, B.; Stewart, J. T.; J. Pharm. Biomed. Anal.2002, 28, 903.
30. Ferrer, S. M.; Modamio, P.; Lastra, C. F.; Marino, E. L.; Biomed.
Chromatogr. 2004, 18, 862.
31. Marchei, E.; Valvo, L.; Pacifici, R.; Pellegrini, M.; Tossini, G.; Zuccaro,
P.; J. Pharm. Biomed. Anal.2002, 29, 1081.
32. Pruvost, A.; Becher, F.; Bardouille, P.; Guerrero, C.; Creminon, C.; Delfraissy, J. F.; Goujard, C.; Grassi, J.; Benech, H.; Rapid Commun. Mass
Spectrom.2001, 15, 1401.
33. Raices, R. S. L.; Salvadori, M. C.; Estrela, R. D. E.; Neto, F. R. D.; Suarez-Kurtz, G.; Rapid Commun. Mass Spectrom.2003, 17, 1611.
34. Rezk, N. L.; Tidwell, R. R.; Kashuba, A. D. M.; J. Chromatogr., B: Anal.
Technol. Biomed. Life Sci.2003, 791, 137.
35. Sarasa, M.; Riba, N.; Zamora, L.; Carne, X. J. Chromatogr., B: Anal.
Technol. Biomed. Life Sci.2000, 746, 183.
36. Verweij-Van Wissenab, C. P. W. G. M.; Aarnoutse, R. E.; Burger, D. M.;
J. Chromatogr., B: Anal. Technol. Biomed. Life Sci.2005, 816, 121.
37. Volosov, A.; Alexander, C.; Ting, L.; Soldin, S. J.; Clin. Biochem.2002,
35, 99.
38. Wiesner, J. L.; Sutherland, F. C. W.; Smit, M. J.; Van Essen, G. H.; Hundt, H. K. L.; Swart, K. J.; Hundt, A. F. J. Chromatogr., B: Anal. Technol.
Biomed. Life Sci. 2002, 773, 129.
39. Williams, L. D.; Von-Tungeln, L. S.; Beland, F. A.; Doerge, D. R.; J.
Chromatogr., B: Anal. Technol. Biomed. Life Sci.2003, 798, 55.
40. Radwan, M. A.; Anal. Lett. 1994, 27, 1159.
41. Djurdjevic, P.; Laban, A.; Markovic, S.; Jelikic-Stankov, M.; Anal. Lett. 2004, 37, 2649.
42. http://www.ich.org, accessed in August 2002.
43. Association of Official Analytical Chemists International (AOAC); Official
methods of analysis of AOAC, 15 ed., Arlingtion, 1990, vol. 1, p. xvii.
44. http://www.ich.org, accessed in August 2002.