BRAZILIAN JOURNAL OF OCEANOGRAPHY, 53(1/2):23-38, 2005
SOFT-BOTTOM MACROBENTHIC COMMUNITIES OF THE VITÓRIA BAY
ESTUARINE SYSTEM, SOUTH-EASTERN BRAZIL
Rosebel C. Nalesso1*, Jean-Christophe Joyeux1, Cintia O. Quintana1,2, Evelise Torezani1,3 & Ana Clara Paz Otegui1,4
1
Departamento de Ecologia e Recursos Naturais, Universidade Federal do Espírito Santo (Av. Fernando Ferrari, 514, 29.075-910, Vitória, ES, Brasil)
Present Address: 2Instituto Oceanográfico da Universidade de São Paulo (Praça do Oceanográfico, 191, 05508-900, São Paulo, SP, Brasil)
Present Address: 3Fundação Pró-Tamar
(Av. Paulino Müller, 1111, Jucutuquara, 29040-715, Vitória, ES, Brasil)
Present Adress: 4Secretaria Municipal de Meio Ambiente de Aracruz (Av. Morobá, s/n, Morobá, 29192-733, Aracruz, ES, Brasil)
A
B S T R A C TThe present work describes and analyses the structure of the macrobenthic epi- and infaunal assemblage of the estuarine system of Vitória Bay, South-eastern Brazil, from January 1998 to June 1999. Replicated sampling at intertidal and subtidal levels was conducted quarterly at ten stations. Intertidal and subtidal sediment composition was characterised. Water physico-chemical parameters were measured in situ. A total of 10,695 individuals, belonging to 144 taxa, were collected. Molluscs, crustaceans and polychaetes were the most abundant groups. The bivalves Anomalocardia brasiliana,
Mytella guyanensis and M. falcata were the most abundant species. Locally, significant discharges of residential and industrial wastewater resulted in high organic content in the sediment (up to 30%) and low dissolved oxygen concentration in the water (< 1mg.l-1). Near the two entrances of the bay, high
hydrodynamic activity and coarse sand reduced the detrimental effects of raw and treated sewage inputs. Species richness (S), diversity (H') and total abundance (A) decreased from outer-bay stations (22 ≤ S ≤ 72; 1.99 ≤ H' ≤ 2.85; 320 ≤ A ≤ 1737) towards inner-bay stations (2 ≤ S ≤ 45; 0.59 ≤ H' ≤ 2.67; 2 ≤ A ≤ 1317), where salinity and dissolved oxygen were lowest and organic matter content highest.
R
E S U M OO presente trabalho analisa e descreve a estrutura das associações faunísticas macrobênticas (epifauna e infauna) do sistema estuarino da Baía de Vitória, sudeste do Brasil, de Janeiro de 1998 a Junho de 1999. Amostras replicadas em níveis de entre-marés e sublitoral foram coletadas em intervalos de três meses em dez estações. Foram caracterizadas as composições dos sedimentos de entre-marés e sublitoral. Os parâmetros físico-químicos da água foram medidos in situ. Foram coletados 10.695 indivíduos, compreendendo a 144 taxa. Os grupos mais abundantes foram moluscos, crustáceos e poliquetos. As espécies mais abundantes foram os bivalves Anomalocardia brasiliana, Mytella guyanensis e M. falcata. Localmente, descargas significativas de esgoto doméstico causaram um aumento da quantidade de matéria orgânica no sedimento (até 30%) e baixa concentração de oxigênio dissolvido na água (< 1mg.l-1). Próximo às duas entradas da baía, o alto
hidrodinamismo e a presença de areia grossa reduziram os efeitos deletérios dos aportes de esgotos. A riqueza (S), a diversidade (H') de espécies e a abundância total (A), decresceram das estações externas do estuário (22 ≤ S ≤ 72; 1.99 ≤ H' ≤ 2.85; 320 ≤ A ≤ 1737) em direção às estações internas (2 ≤ S ≤ 45; 0.59 ≤ H' ≤ 2.67; 2 ≤ A ≤ 1317), onde a salinidade e oxigênio dissolvido foram menores e as quantidades de matéria orgânica maiores.
Descriptors: Macrofauna, Vitória Bay Estuarine System, South-eastern Brazil, Organic Pollution, Environmental Characteristics, Anthropogenic Effects.
I
NTRODUCTIONEstuaries and coastal marine waters rank among the most important aquatic systems on earth in terms of ecological and economic significance (Kennish, 1997). Although a variety of organisms (such as fish, plankton, or algae) are available for the study of estuarine environments, soft-sediment invertebrates are most commonly used and are probably the most suitable because, owing to their lack of mobility, the changes observed over time are likely to be due to pollution stress rather than to migration or movement (Clark, 1997). Macrobenthic communities are composed of species with a relatively long life span that can, with time, integrate a wide set of fluctuating environmental conditions. Hence, these invertebrates may be regarded as potentially better pollution indicators than instantaneous water quality measurements (López-Gappa et al., 1990).
In addition, macrobenthic communities are important functional components of estuarine ecosystems. These organisms alter the physical and chemical conditions at the sediment-water interface, promote the decomposition of organic matter, recycle nutrients for photosynthesis, and transfer energy to other food-web components (Gaston et al., 1998).
Macrobenthic communities subjected to increased organic loading, either spatially or
temporally, will often exhibit: (1) a decrease in species richness and an increase in total number of individuals attributable to the high densities of a few opportunistic species; (2) a general reduction in biomass, although there may be an increase in biomass corresponding to a dense assemblage of opportunists; (3) a decrease in the average body size of species or individuals; (4) shifts in the relative dominance of trophic guilds; and (5) a shallowing of that portion of the sediment column occupied by infauna (Kennish, 1997).
Rapid and frequently uncontrolled urban development near estuaries causes dramatic changes in the species composition of macrobenthic communities in response to the accumulation of pollutants (Dauer, 1993; Dauer et al., 1993; Gonzales-Oreja & Saiz-Salinas, 1998; Inglis & Kross, 2000). However, in estuarine areas, major shifts in the physico-chemical water parameters mask the pollution effects on macrobenthic assemblages (Rakocinski et al., 1997).
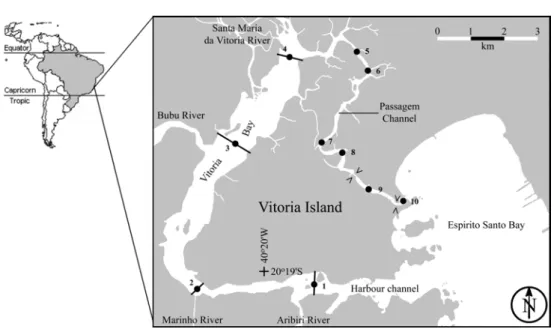
The Vitória Bay estuarine system is located in south-eastern Brazil and surrounds the city of Vitória, state of Espírito Santo (Fig. 1). It is subject to considerable anthropogenic impact of the uncontrolled discharge of domestic sewage from the million or so inhabitants of the surrounding cities. Wastewater pollution has caused high coliform contamination (Carmo, 1997), alteration of the algal
community (Mitchell, 1990), organic matter enrichment of sediment (Soares-Gomes, 1994) and morphological abnormalities in copepods (Dias, 1994; Loureiro-Fernandes et al., 1998; Dias, 1999). The main entrance to the system shelters an important harbour and major industries are located around the outer (Espírito Santo) bay. All these factors led Diegues (1999) to consider the system as one of the most critically degraded area of the Brazilian coast.
The aim of the present work is to characterise the intertidal and subtidal soft-bottom communities of the Vitória Bay estuarine system, and to correlate the assemblage structure to environmental conditions. We tested the hypothesis that internal estuarine areas, subject to great environmental instability in terms of physico-chemical water parameters (mainly salinity and dissolved oxygen) or affected by organic loading, would exhibit lower richness and diversity than outer areas subjected to more stable conditions.
M
ATERIALS ANDM
ETHODSStudy area
The Vitória Bay estuarine system is located in south-eastern Brazil at 20º14´ - 20º20´S and 40º17´- 40º21´W (Fig. 1). Water enters the system from rivers and various other sources that include sewage treatment plants and domestic raw sewage outlets from the cities of Vitória, Vila Velha, Cariacica and Serra. About 30% of the sewage is treated (Jesus et al., 2004). The estuary is connected to the south-western Atlantic Ocean through two channels. The southern channel is of tectonic origin, deep and wide (minimum width ∼150 m; maximum depth 23 m), while the northern channel is primarily sedimentary, shallower and narrower (mean width ∼125 m). In the surrounding lowlands, the rainy season (monthly rainfall ≥ 100mm month-1) typically extends from September through March, with heaviest rains from November to January (Joyeux et al., 2004). Freshwater enters the system mainly through the Santa Maria da Vitória River (drainage area 1660 km2). The river is controlled for energy production about 40 km upstream from its mouth (the delta may be seen in Fig. 1). The freshwater flow at the dam (drainage area 997 km2) is highly regulated and the mean monthly discharge (1950-2002) varied between 8 m3s-1 in September and 24 m3 s-1 in January and December (Joyeux et al., 2004). The estuarine gradient develops from the delta towards both mouths. The mean tidal water level is 0.8 m (Diretoria de Hidrovia e Navegação; http://www.dhn.mar.mil.br) and the bay is under microtidal influence (tide ≤ 2 m).
Ten stations were sampled in areas of different hydrodynamics, near river mouths and near known sources of pollution. The stations were located
throughout the estuary, including the industrial port, near protected mangrove forests, and in urbanised areas. The study was carried out on tidal and subtidal flats at all stations. Station 1 was located close to the Aribiri River that discharges most of the wastewater from Vila Velha into the Vitória Bay. Port authorities dredged the bottom of this station during the sampling period. Stations 2 to 4 were similarly located near the mouths, respectively, of the Marinho and Bubu Rivers (wastewater outlets) and the Santa Maria da Vitória River. Stations 5 to 8 were located in the narrow Passagem Channel (Fig. 1). Station 6 was near the outfall of a primary treatment wastewater plant, and station 7 was located near a rehabilitated waste disposal landfill, currently used as a refuse recycling plant. Station 9 was located in a higly urbanised channel constricted at either end by a bridge 30 m wide (Fig. 1) and receiving large quantities of untreated sewage. Station 10 was located between a seawall and a rocky outcrop seaward of the bridge. It is bathed by relatively unpolluted water during most of the tidal cycle, especially during the rising tide.
Stations 1 and 2 were the deepest due to the navigation channel. Stations 3 to 8 were shallow at low tide, with shore vegetation composed of
Rhizophora mangle and Laguncularia racemosa
mangroves. Due to tidal circulation, all stations were subject to the influence of residential sewage, and the use of shore areas and waters for garbage disposal is a common practice.
Sampling
Samples were collected at 3-month intervals (75 to 116 days between consecutive collections) from January 1998 (summer) to June 1999 (autumn), during low tides. Data thus cover the summers 1998 and 1999 (S1 and S2), autumns 1998 and 1999 (A1 and A2), winter 1998 (W) and spring 1999 (Sp). To sample the subtidal level, a Petersen grab (6 litres; 0.075 m2) was used. At each station on each sampling date were collected three replicates along a transversal transect of the bay or channel (for example, transects for stations 1-4 are indicate in Fig. 1), with two of these replicates collected near the right and left shores and the third in the center of the transect. Replicates were then pooled (giving a total of 60 samples, each composed of three replicates). A 10 cm-high rectangular iron box of 0.05 m2 was used to sample the intertidal locations at each station on each sampling date. Each sample (N = 60) is composed of two pooled replicates collected on the Vitória isalnd side of the estuary. All subtidal and intertidal samples were whashed through sieves of 2, 1 and 0.5 mm mesh. Organisms were preserved in 70% ethanol and subsequently sorted under stereomicroscope.
Specimen identification was essentially
carried out to the species level, but juveniles
allowed identification only to family or genera
level. Encrusting or colonial organisms were
identified and their abundance expressed as
present or absent (0 or 1).
Low-tide temperature, salinity and dissolved oxygen (DO) of bottom and surface waters were measured in situ with a multiparameter device (YSI 85). The pH was measured in the laboratory. The granulometric composition of the sediment was determined from triplicate 100 g samples dried at 70ºC and processed through granulometric sieves. The mean was used in the analyses. Particles were classified as gravel (particle size>2 mm), coarse sand (0.5–2 mm), medium sand (0.25–0.5 mm), fine sand (0.062–0.25 mm) and silt-clay (size≤0.062 mm). The organic matter content was determined using a 5 g sample dried at 70ºC and then burned at 600ºC for 2 hours in a muffle furnace, using triplicate samples (Byers et al., 1978).
Statistical Analysis
Analyses of variance were used to compare numbers of species, numbers of individuals (abundance), and Shannon-Wiener diversity index by tidal level, season and station. All 120 samples were used. Numbers of species and individuals were log-transformed (log10 + 1) to approximate to normal
distribution. After transformation, the two variables were not found to be significantly different from normal (species: Kolmogorov-Smirnov-Lilliefors statistic = 0.080, df = 120, NS; individuals: KSLstat = 0.048; df = 120, NS). Shannon-Wiener was not transformed since it is supposed to follow a normal distribution (Magurran, 1988). However, the variable distribution was significantly different from normal (KSLstat = 0.097; df = 120, P = 0.007) due to the abundance of zero-values (samples with 0 or 1 species; N = 18). Type-III ANOVA models were built to test for differences among stations (ten categories: 1 to 10), tidal levels (two categories: subtidal [ST] and intertidal [IT]), and seasons (six categories: S1, A1, W, Sp, S2, A2). Two-way interactions were tested. Subsequently, post hoc Student–Newman–Keuls tests were used to test for differences among categories within the independent variables season and station (Zar, 1999).
The similarity among macrobenthic assemblages for all tidal level vs. station combinations was explored using a two-dimensional non-metric multidimensional scaling analysis (MDS). Similarity was computed from the Bray-Curtis distance using double-square-root-transformed mean abundance for all taxa (Primer 5.0) for all station x tidal level combinations.
Canonical correspondence analysis (Ter Braak, 1986) is a combination of correspondence analysis of taxa (non-parametric), and of principal component analysis of environmental variables (parametric). The two are linked through the corresponding samples. The method is widely used in ecological and environmental studies. Preliminary correspondence (CA) and principal component analyses (PCA) were run before the canonical analysis (CCA). All species with less than five individuals were deleted from the CA (N = 58). Samples without species were deleted (N = 6: samples 1-IT-S2, 9-ST-W, 9-IT-A1/W/S2/A2). Samples with only one species (N = 12: samples 4-ST-S1, 5-ST-A1, 5-IT-A1, 8-ST-S1/W/Sp/S2, 9-ST-S1/Sp/S2, 9-IT-S1/Sp), and taxa present in only one sample (N = 2: Mitra sp. and
Caprella sp.) were maintained. The CA was run on
the number of individuals in the matrix taxa x samples (82 x 114). The CA was not detrended, the taxa abundance was not transformed, and rare taxa were not downweighted. Environmental variables tested by the PCA included the physico–chemical characteristics of low-tide water (bottom temperature, salinity, pH and DO) and substrate granulometric composition (percentage age of gravel, coarse sand, medium sand, fine sand, silt/clay, and organic matter). Since the former group of variables was available only for low tide (N = 60), the subtidal and intertidal samples share the same (repeated) values (total N = 120). Granulometric variables were measured once at each site for both collection methods (N = 20) and the same values were repeated according to each site x method combination (N = 5 x 20). Therefore, no two samples show the same combination of physico–chemical and granulometry values. All samples were included (matrix 10 x 120). All environmental variables were transformed (log10 + 1) to approximate to normality
(Kolmogorov-Smirnov-Lilliefors tests: all df = 120; all P ≤ 0.028), centred (mean = 0) and standardised (variance = 1), before being included in the CA and PCA models.
The CCA model was run on transformed environmental variables and untransformed species abundances. Sample scores were expressed as weighted means of species scores, and CCA axes scaled accordingly. The importance of environmental data was decided by their intraset correlations with CCA axes rather than by their canonical coefficient because canonical coefficients were likely to be influenced by other collinear environmental variables (Ter Braak, 1986).
R
ESULTSSediment and Water Characteristics
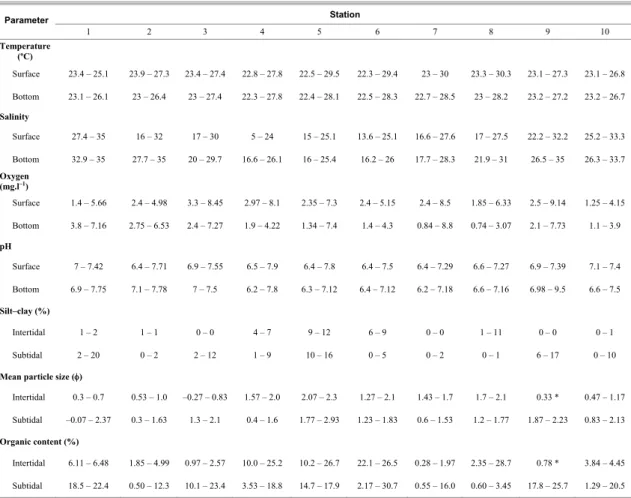
poorly sorted, with high organic content (3.4–20%) (Table 1). At inner-bay stations (3–9), sediments were medium to fine sand, poorly sorted. Coarse sand was present locally, due to the influence of rivers, intense hydrodynamics (Stations 4 and 7) and land reclamation (Station 3 intertidal). Organic matter ranged from 0.8 to 24.3%. Higher values, up to 30.74%, were recorded near the outlet of a sewage treatment plant (Station 6). The silt-clay content varied between 0 and 12.3%. In general, sediments had a dark colour and a strong odour, typical of reduced environments.
Salinity and DO were the most variable water physico-chemical parameters (Table 1). Surface salinity was higher than 25 at outer stations (Stations 1 and 10), but decreased toward inner areas, and reached its lowest value (5) at the mouth of the Santa Maria da Vitória River (Station 4). Bottom salinity was always higher than that at the surface and varied between a low of 16 at inner-bay stations and a high of 26 at outer-bay stations. DO was particularly low (<2 mg.l-1) in bottom waters at inner stations (4–9). DO was consistently low in the whole column at Station 10. Surface temperature varied between 22 and 30 ºC at inner stations and between 23 and 27 ºC at outer stations, being less variable in bottom waters. Waters were slightly acidic at inner stations and in bottom waters (pH = 6.2). They were near by neutral at outer stations, except at Station 9 where the pH reached 9.5.
Community Composition
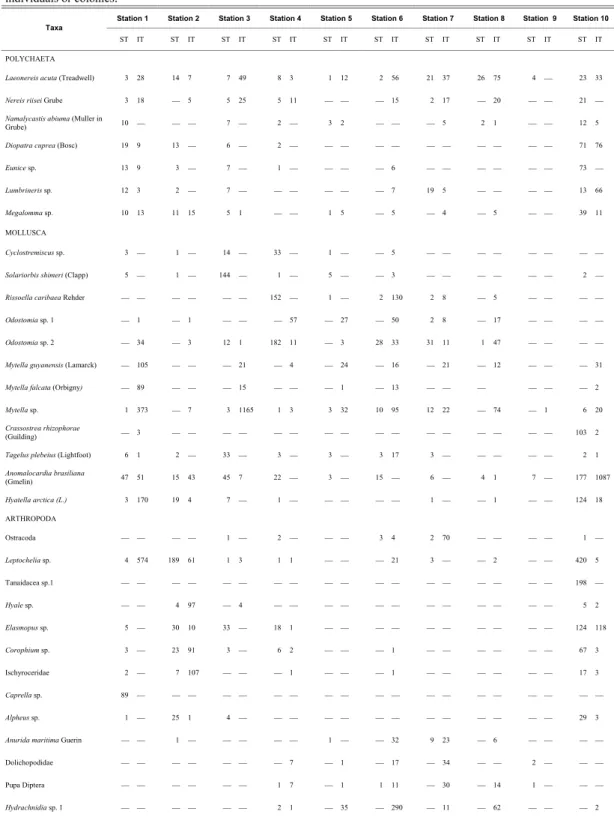
A total of 10,695 individuals, belonging to 141 taxa, were collected. Molluscs, crustaceans and polychaetes were the most diverse groups with 54, 41, and 26 species, respectively (Table 2A and 2B). Five echinoderms, 4 insects, 3 cnidarians, 3 acari and 5 minor groups of 1 species each were also collected. Molluscs were the most abundant group, representing 56% of the total number of individuals, followed by crustaceans (26.5%), polychaetes (13.13%) and other arthropods such as insects and acari (5.9%). Crustaceans were more frequent at outer stations (1, 2 and 10) while small gastropods, insects, larvae and acari dominated at the inner stations.
The most abundant taxa were the bivalves Anomalocardia brasiliana, Mytella guyanensis, M. falcata, and the spat of Mytella sp., followed by the tanaid Leptochelia sp. (Table 2A). There were 19 rare species of which only one individual was found or for Cnidaria or colonial taxa with one single occurrence.
Various species exhibited typical population explosions. A few scarce species appeared in large numbers in one or two stations (Fig. 2). For example, the relatively infrequent small gastropod Solariorbis shimeri appeared at subtidal Station 3 during summer
1998 (sample 3-ST-S1). At the same location and same tidal level, the relatively rare polychaete Sternaspis sp. appeared in large numbers during the autumn of 1999 (sample 3-ST-A2). The population of the gastropod Rissoella caribaea increased dramatically at two stations simultaneously during winter 1998 (samples 4-ST-W and 6-IT-W). The amphipod Elasmopus sp. was encountered in abundance in winter 1998 (sample 2-IT-W). Other groups, such as Leptochelia sp., Anomalocardia brasiliana and Mytella sp., also showed considerable, periodic fluctuations.
Mussels (Mytella falcata and M. guyanensis) dominated the intertidal assemblages, especially during springtime, when recruits (Mytella spat) were abundant at Stations 1 and 3 and, in lower densities, at internal Stations 5, 6 and 8. Small crustaceans, such as amphipods and the tanaid Leptochelia sp., as well as the bivalve Anomalocardia
brasiliana, characterized Stations 2 and 10, where
coarse sand predominated. Other arthropods (such as acari and insects) dominated at the internal stations. Small gastropods (two species of Odostomia and Rissoella caribaea) were common in areas with silt-clay sediment (Stations 4, 6 and 8).
Small gastropods (Odostomia sp., R. caribaea
and Solariorbis shimeri) were abundant at the
subtidal levels of internal areas (Stations 3 to 7). Nereid polychaetes predominated at Station 8. These and other polychaetes (Diopatra cuprea, Eunice sp., Megalomma sp.) were common at external Stations 1, 3 and 10, together with the bivalve A. brasiliana.
Species Richness, Abundance and Diversity
The intertidal stations always had greater numbers of individuals than the subtidal stations, due to the large numbers of Mytella spat, tanaids, amphipods and small arthropods such as Acari, Insecta and Ostracoda, among others.
Station 10 had the highest number of individuals (1,737 at subtidal and 1,705 at intertidal levels) and species (73 and 50, respectively) whilst station 9 (ca. 1 km distant) showed 4 and 2 species with 14 and 2 individuals on subtidal and intertidal levels, respectively. In general, the stations located near the entrances to the bay (1, 2, 3 and 10) were more densely and more diversely populated than the inner-bay stations (4–8) (Table 3).
Table 1. Range (minimum–maximum) of the physico-chemical parameters of water (N = 6) and substrate (silt-clay <62 µm, mean particle size (φ) and organic matter; N = 3) from the stations sampled in the Vitória Bay estuarine system.
(*) Only one sample
highly significant for all variables; i.e., there were differences among stations for the same tidal level or between tidal levels for the same station.
Overall, the summers (S1-1998 and S2-1999) presented the lowest richness, abundance and diversity whilst winter (W) and spring (Sp) had from medium to high values for these variables. Interannual variations were the greatest during autumn, with both the lowest (A1-1998) and the highest (A2-1999) species richness and diversity, with abundance following the same pattern. The two neighboring stations 10 and 9 consistently presented the highest and lowest richness, abundance, and diversity, respectively.
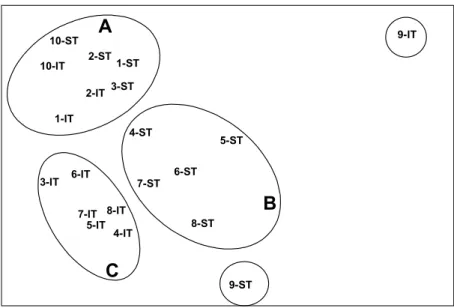
The MDS analysis evidenced three main groups: outer-bay stations (intertidal and subtidal at 1, 2 and 10, and subtidal at 3), intertidal inner-bay Stations 3-8, and subtidal inner-bay Stations 4-8 (Fig. 3). Subtidal and intertidal Station 9 stayed apart.
Residual of calculations for axes 1 and 3 of the correspondence analysis exceeded tolerance, due
to the taxa Solariorbis shimeri (axis 1) and Caprella sp. (axis 3). Both had extremely high numbers of individuals in one sample (3-ST-S1 and 1-ST-Sp, respectively) but were absent or extremely rare in all others. A second run was then performed without these two taxa (matrix 80 x 114). The proportion of explained variation was extremely low (7.242% for the first axis and 6.738, 6.105, 5.694 and 5.450%, respectively, for the second to fifth), indicating a rather diffuse pattern of specific abundance among samples. However, outer-bay Stations 1, 2, 3, and 10 were clearly related, Stations 2 and 10 being the most similar (Fig. 4). Samples from the inner-bay stations were extremely dispersed, i.e., variable. No particular pattern was detected among seasons (not shown), and considerable overlapping was evident between intertidal and subtidal samples (not shown). Overall, results were in agreement with those of the ANOVA and MDS analyses.
Station Parameter
1 2 3 4 5 6 7 8 9 10
Temperature (ºC)
Surface 23.4 – 25.1 23.9 – 27.3 23.4 – 27.4 22.8 – 27.8 22.5 – 29.5 22.3 – 29.4 23 – 30 23.3 – 30.3 23.1 – 27.3 23.1 – 26.8
Bottom 23.1 – 26.1 23 – 26.4 23 – 27.4 22.3 – 27.8 22.4 – 28.1 22.5 – 28.3 22.7 – 28.5 23 – 28.2 23.2 – 27.2 23.2 – 26.7
Salinity
Surface 27.4 – 35 16 – 32 17 – 30 5 – 24 15 – 25.1 13.6 – 25.1 16.6 – 27.6 17 – 27.5 22.2 – 32.2 25.2 – 33.3
Bottom 32.9 – 35 27.7 – 35 20 – 29.7 16.6 – 26.1 16 – 25.4 16.2 – 26 17.7 – 28.3 21.9 – 31 26.5 – 35 26.3 – 33.7
Oxygen (mg.l–1
)
Surface 1.4 – 5.66 2.4 – 4.98 3.3 – 8.45 2.97 – 8.1 2.35 – 7.3 2.4 – 5.15 2.4 – 8.5 1.85 – 6.33 2.5 – 9.14 1.25 – 4.15
Bottom 3.8 – 7.16 2.75 – 6.53 2.4 – 7.27 1.9 – 4.22 1.34 – 7.4 1.4 – 4.3 0.84 – 8.8 0.74 – 3.07 2.1 – 7.73 1.1 – 3.9
pH
Surface 7 – 7.42 6.4 – 7.71 6.9 – 7.55 6.5 – 7.9 6.4 – 7.8 6.4 – 7.5 6.4 – 7.29 6.6 – 7.27 6.9 – 7.39 7.1 – 7.4
Bottom 6.9 – 7.75 7.1 – 7.78 7 – 7.5 6.2 – 7.8 6.3 – 7.12 6.4 – 7.12 6.2 – 7.18 6.6 – 7.16 6.98 – 9.5 6.6 – 7.5
Silt–clay (%)
Intertidal 1 – 2 1 – 1 0 – 0 4 – 7 9 – 12 6 – 9 0 – 0 1 – 11 0 – 0 0 – 1
Subtidal 2 – 20 0 – 2 2 – 12 1 – 9 10 – 16 0 – 5 0 – 2 0 – 1 6 – 17 0 – 10
Mean particle size (φ)
Intertidal 0.3 – 0.7 0.53 – 1.0 –0.27 – 0.83 1.57 – 2.0 2.07 – 2.3 1.27 – 2.1 1.43 – 1.7 1.7 – 2.1 0.33 * 0.47 – 1.17
Subtidal –0.07 – 2.37 0.3 – 1.63 1.3 – 2.1 0.4 – 1.6 1.77 – 2.93 1.23 – 1.83 0.6 – 1.53 1.2 – 1.77 1.87 – 2.23 0.83 – 2.13
Organic content (%)
Intertidal 6.11 – 6.48 1.85 – 4.99 0.97 – 2.57 10.0 – 25.2 10.2 – 26.7 22.1 – 26.5 0.28 – 1.97 2.35 – 28.7 0.78 * 3.84 – 4.45
Table 2A. Species accounting for >0.5% of the total number of individuals in the intertidal (IT) and subtidal (ST) soft bottom communities in the Vitória Bay estuarine system, south-eastern Brazil. Values in the table listed refer to the number of individuals or colonies.
Station 1 Station 2 Station 3 Station 4 Station 5 Station 6 Station 7 Station 8 Station 9 Station 10 Taxa
ST IT ST IT ST IT ST IT ST IT ST IT ST IT ST IT ST IT ST IT
POLYCHAETA
Laeonereis acuta (Treadwell) 3 28 14 7 7 49 8 3 1 12 2 56 21 37 26 75 4 23 33
Nereis riisei Grube 3 18 5 5 25 5 11 15 2 17 20 21
Namalycastis abiuma (Muller in
Grube) 10 7 2 3 2 5 2 1 12 5
Diopatra cuprea (Bosc) 19 9 13 6 2 71 76
Eunice sp. 13 9 3 7 1 6 73
Lumbrineris sp. 12 3 2 7 7 19 5 13 66
Megalommasp. 10 13 11 15 5 1 1 5 5 4 5 39 11
MOLLUSCA
Cyclostremiscus sp. 3 1 14 33 1 5
Solariorbis shimeri (Clapp) 5 1 144 1 5 3 2
Rissoella caribaea Rehder 152 1 2 130 2 8 5
Odostomia sp. 1 1 1 57 27 50 2 8 17
Odostomia sp. 2 34 3 12 1 182 11 3 28 33 31 11 1 47
Mytella guyanensis (Lamarck) 105 21 4 24 16 21 12 31
Mytella falcata (Orbigny) 89 15 1 13 2
Mytella sp. 1 373 7 3 1165 1 3 3 32 10 95 12 22 74 1 6 20
Crassostrea rhizophorae
(Guilding) 3 103 2
Tagelus plebeius (Lightfoot) 6 1 2 33 3 3 3 17 3 2 1
Anomalocardia brasiliana
(Gmelin) 47 51 15 43 45 7 22 3 15 6 4 1 7 177 1087
Hyatella arctica(L.) 3 170 19 4 7 1 1 1 124 18
ARTHROPODA
Ostracoda 1 2 3 4 2 70 1
Leptocheliasp. 4 574 189 61 1 3 1 1 21 3 2 420 5
Tanaidacea sp.1 198
Hyale sp. 4 97 4 5 2
Elasmopus sp. 5 30 10 33 18 1 124 118
Corophium sp. 3 23 91 3 6 2 1 67 3
Ischyroceridae 2 7 107 1 1 17 3
Caprella sp. 89
Alpheus sp. 1 25 1 4 29 3
Anurida maritima Guerin 1 1 32 9 23 6
Dolichopodidae 7 1 17 34 2
Pupa Diptera 1 7 1 1 11 30 14 1
Hydrachnidia sp. 1 2 1 35 290 11 62 2
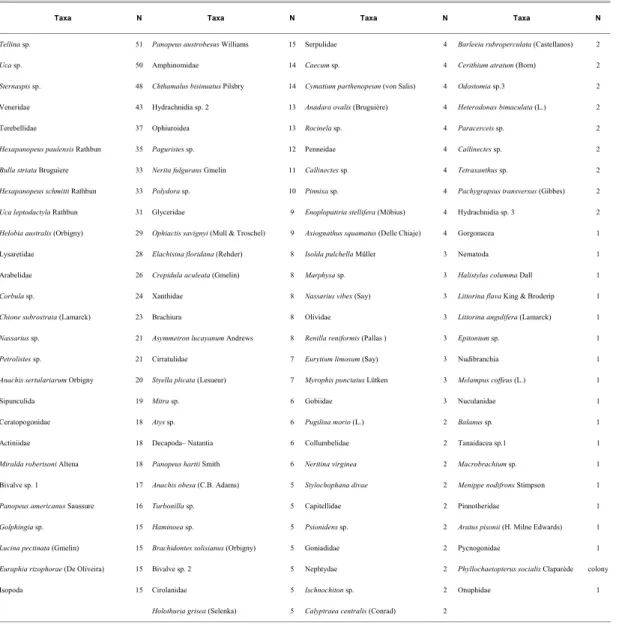
Table 2B. List of remaining taxa not included in Table 2A (in order of decreasing abundance). N is the number of individuals or colonies.
Taxa N Taxa N Taxa N Taxa N
Tellina sp. 51 Panopeus austrobesus Williams 15 Serpulidae 4 Barleeia rubroperculata (Castellanos) 2
Uca sp. 50 Amphinomidae 14 Caecum sp. 4 Cerithium atratum (Born) 2
Sternaspis sp. 48 Chthamalus bisinuatus Pilsbry 14 Cymatium parthenopeum (von Salis) 4 Odostomia sp.3 2
Veneridae 43 Hydrachnidia sp. 2 13 Anadara ovalis (Bruguière) 4 Heterodonax bimaculata (L.) 2
Terebellidae 37 Ophiuroidea 13 Rocinela sp. 4 Paracerceis sp. 2
Hexapanopeus paulensis Rathbun 35 Paguristes sp. 12 Penneidae 4 Callinectes sp. 2
Bulla striata Bruguìere 33 Nerita fulgurans Gmelin 11 Callinectes sp. 4 Tetraxanthus sp. 2
Hexapanopeus schmitti Rathbun 33 Polydora sp. 10 Pinnixa sp. 4 Pachygrapsus transversus (Gibbes) 2
Uca leptodactyla Rathbun 31 Glyceridae 9 Enoplopatiria stellifera (Möbius) 4 Hydrachnidia sp. 3 2
Helobia australis (Orbigny) 29 Ophiactis savignyi (Mull & Troschel) 9 Axiognathus squamatus (Delle Chiaje) 4 Gorgonacea 1
Lysaretidae 28 Elachisina floridana (Rehder) 8 Isolda pulchella Müller 3 Nematoda 1
Arabelidae 26 Crepidula aculeata (Gmelin) 8 Marphysa sp. 3 Halistylus columma Dall 1
Corbula sp. 24 Xanthidae 8 Nassarius vibex (Say) 3 Littorina flava King & Broderip 1
Chione subrostrata (Lamarck) 23 Brachiura 8 Olividae 3 Littorina angulifera (Lamarck) 1
Nassarius sp. 21 Asymmetron lucayanum Andrews 8 Renilla reniformis (Pallas ) 3 Epitonium sp. 1
Petrolistes sp. 21 Cirratulidae 7 Eurytium limosum (Say) 3 Nudibranchia 1
Anachis sertulariarum Orbigny 20 Styella plicata (Lesueur) 7 Myrophis punctatus Lütken 3 Melampus coffeus (L.) 1
Sipunculida 19 Mitra sp. 6 Gobiidae 3 Nuculanidae 1
Ceratopogonidae 18 Atys sp. 6 Pugilina morio (L.) 2 Balanus sp. 1
Actiniidae 18 Decapoda– Natantia 6 Collumbelidae 2 Tanaidacea sp.1 1
Miralda robertsoni Altena 18 Panopeus hartii Smith 6 Neritina virginea 2 Macrobrachium sp. 1
Bivalve sp. 1 17 Anachis obesa (C.B. Adams) 5 Stylochophana divae 2 Menippe nodifrons Stimpson 1
Panopeus americanus Saussure 16 Turbonilla sp. 5 Capitellidae 2 Pinnotheridae 1
Golphingia sp. 15 Haminoea sp. 5 Psionidens sp. 2 Aratus pisonii (H. Milne Edwards) 1
Lucina pectinata (Gmelin) 15 Brachidontes solisianus (Orbigny) 5 Goniadidae 2 Pycnogonidae 1
Euraphia rizophorae (De Oliveira) 15 Bivalve sp. 2 5 Nephtydae 2 Phyllochaetopterus socialis Claparède colony
Isopoda 15 Cirolanidae 5 Ischnochiton sp. 2 Onuphidae 1
Holothuria grisea (Selenka) 5 Calyptraea centralis (Conrad) 2
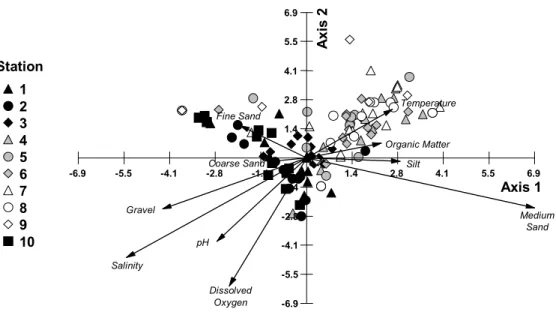
Four PCA factors effectively represented the ten original environmental variables. Sediment composition defined the first axis (representing 36.753% of the variation), opposing gravel and coarse sand (dynamic areas) to fine sand, silt and organic matter (still-water areas). The second axis (20.568%) was essentially a combination of physico-chemical characteristics of the water: it opposed temperature and medium sand to DO and pH (marine waters). The third (12.147%) was a positive combination of salinity and temperature while the fourth (10.791%) opposed pH to temperature and medium sand. Graphically, on the first two axes the sampling stations (Fig. 5) were distributed along a granulometric gradient from
Anomalocardia brasiliana Leptochelia sp.
0 200 400 600 800
S1 A1 W Sp S2 A2
nº individuals
0 200 400 600
S1 A1 W Sp S2 A2
nº individual
s
Mytella sp. Hyale sp.
0 500 1000 1500 2000
S1 A1 W Sp S2 A2
nº individual
s
0 40 80 120
S1 A1 W Sp S2 A2
nº individual
s
Hiatella arctica Elasmopus sp. 3
0 40 80 120 160
S1 A1 W Sp S2 A2
nº individual
s
0 40 80 120
S1 A1 W Sp S2 A2
nº individual
s
Solariorbis shimeri Hydrachnidia sp. 1
0 50 100 150
S1 A1 W Sp S2 A2
nº individual
s
0 100 200 300
S1 A1 W Sp S2 A2
nº individual
s
Rissoela caribea Caprella sp.
0 50 100 150 200
S1 A1 W Sp S2 A2
nº i
ndi
vi
dual
s
0 20 40 60 80 100
S1 A1 W Sp S2 A2
nº i
ndi
vi
dual
s
Sternaspis sp. Ostracoda
0 10 20 30 40 50
S1 A1 W Sp S2 A2
nº i
ndi
vi
dual
s
0 20 40 60 80
S1 A1 W Sp S2 A2
nº i
ndi
vi
dual
s
Season Season
Fig. 2. Seasonal variation in total number of individuals (all samples pooled for the season and level considered, i.e., N=10) for selected macrofaunal taxa in Vitória Bay. Shaded bars: intertidal; open bars: subtidal; ´Season´ refers to the following categories: summers 1998 and 1999 (S1 and S2), autumns 1998 and 1999 (A1 and A2), winter 1998 (W), and spring 1999 (Sp).
Table 3. Number of individuals, number of species and Shannon–Wiener index for the benthic samples from Vitória Bay estuary.
Number of individuals Number of species Diversity index
Station
Intertidal Subtidal Intertidal Subtidal Intertidal Subtidal
1 1577 320 37 48 2.05 2.71
2 486 462 22 49 2.17 2.51
3 1317 457 19 45 0.59 2.65
4 125 462 22 30 2.12 1.79
5 165 29 17 14 2.23 2.44
6 870 70 37 12 2.39 1.83
7 359 120 26 18 2.67 2.36
8 379 40 21 6 2.26 1.38
9 2 14 2 4 0.69 1.17
10 1705 1737 50 72 1.99 2.85
Table 4. Between–subjects statistics for the ANOVAs on the number of species, number of individuals, and Shannon Wiener index. Mean square and significance levels are given. * in the Source column indicates interaction among dependent variables. Results for the SNK tests (α = 0.05) are given where differences between seasons and stations are significant. Variables categories are listed from lowest at left to highest at right.
Independent variables
Source df Number of species Number of individuals Shannon–Wiener
Corrected model 74 0.194 *** 0.774*** 0.730 ***
Error 45 0.02978 0.187 0.170
Corrected total 119 _ _ _
Adjusted r–squared _ 0.775 0.661 0.672
Intercept 1 77.296 *** 229.187 *** 162.525 ***
Tidal level 1 0.07824 NS 1.489**
Intertidal > Subtidal 0.268
NS
Season 5 A1 S1 S2 W Sp A2 0.264 *** S1 A1 S2 W A2 Sp 1.172*** A1 S1 S2 W Sp A2 1.072 ***
Station 9 0.908 ***
9 5 8 4 7 6 1 3 2 10
3.374***
9 5 8 4 7 2 6 1 3 10
2.649 ***
9 8 5 4 6 3 7 1 2 10
Level * Season 5 0.07316 * 0.380 NS 0.251 NS
Season * Station 45 0.04383 NS 0.253 NS 0.266 NS
Level * Station 9 0.274 *** 0.697 *** 1.261 ***
8-IT
Stress: 0,12
1-ST 2-ST
3-ST
4-ST
5-ST
6-ST 7-ST
8-ST
9-ST 10-ST
1-IT 2-IT
3-IT
4-IT 5-IT 6-IT
7-IT
9-IT
10-IT
A
B
C
Fig. 3. MDS ordering of stations (1 to 10) and tidal level (IT: intertidal; ST: subtidal), based on macrobenthic species abundance data for the Vitória Bay estuarine system. The ellipses associate stations and tidal levels of similar community composition: A: outer-bay except intertidal level of Station 3; B: inner-bay subtidal; C: inner-bay intertidal plus intertidal of Station 3 (other associations are self-explaining). Stress = 0.12.
1 2 3 4 5 6 7 8 9 10
A
x
is 2
Axis 1
-1.08
-2.16
-3.25
-4.33 1.08 2.16 3.25 4.33 5.41
-1.08 -2.16 -3.25
-4.33 1.08 2.16 3.25 4.33 5.41
Station
Fig. 4. Sample distribution in the bidimentional graph defined by the two first axes of the preliminary CA, based on taxa abundance in each sample included. Samples (symbols) are grouped by station (1 to 10).
1
2
3
4
5
6
7
8
9
10
A
x
is
2
Axis 1 -0.09
-0.17
-0.26
-0.35
-0.44 0.09 0.17 0.26 0.35 0.44
-0.09 -0.17 -0.26 -0.35
-0.44 0.09 0.17 0.26 0.35 0.44
Salinity Temperature
Dissolved Oxygen
pH Silt
Gravel Coarse Sand Medium
Sand
Fine Sand
Organic Matter
Vector scaling: 0,89
Station
Figure 5. Representation of the two first axes of the preliminary PCA, based on low-tide water characteristics and sediment composition for each sample. All 120 samples (symbols) are grouped by station (1 to 10). Vectors for environmental variables are scaled (x 0.89) to allow better representation. Note that the subtidal samples of Station 3 are grouped to the left of a line joining the co-ordinate –0.09 and the abscissa – 0.17, hidden by samples from stations 6 and 10).
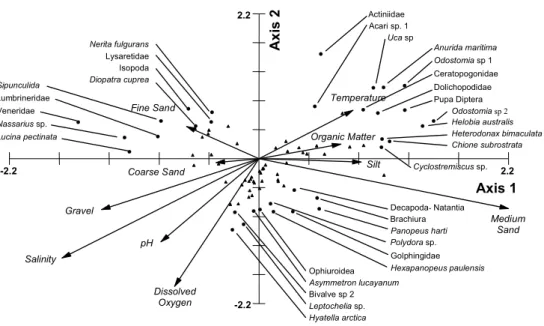
The taxa Solariorbis shimeri and Caprella sp. were excluded from the canonical correspondence analysis, and rare taxa were downweighted. Correlations between species and environmental variables were good, 0.866 on the first axis and 0.781 on the second. The first axis (that explained 29.461% of the variation) opposed gravel and salinity to medium sand, while the second (19.559%) was principally a function of DO (with salinity and pH important). Samples were distributed accordingly, within the two dimensions defined (Fig. 6), with taxa of low salinity, high temperature, high silt/clay and organic content in the upper right quadrant (e.g. Odostomia sp.1, Anurida maritima and Uca sp.; Fig. 7), and species more dependent upon opposite conditions (outer most estuary) in the lower left (e.g. Panopeus americanus, Anomalocardia brasiliana and Tellina sp.). Taxa more and less sensitive to these factors, but that also respond significantly to other parameters of sediment composition (fine, medium and coarse sand) were in the upper left (e.g.
Lumbrineris sp., Sipunculida in –essentially- fine
sand) and lower right (e.g. Golphingia sp.,
Hexapanopeus paulensis and Panopeus hartii in
medium sand) quadrants.
D
ISCUSSIONGenerally, the richness and biomass of macrobenthic species are highest in stable, undisturbed communities and diminish in unstable regions of constant disturbance (Pearson & Rosenberg, 1978). Environmental stress, such as that resulting from pollution, is considered to be a causative factor of low diversity and richness (Clarke & Warwick, 1994). A clear estuarine gradient develops in Vitória Bay, mostly due to the freshwater input from the Santa Maria da Vitória River (Table 1; Fig. 4). The biotic gradient (Fig. 3; Table 3) follows changes in water and sediment characteristics (Table 1; Fig. 4) and generally coincides with the abiotic gradient (Fig. 6). That, in the analyses, a few stations or samples were not located on the graphs as one might have expected (e.g., outer-bay 3-IT associated with inner-bay IT samples or 9-IT and 9-ST segregated from all others; Fig. 3; see also Table 4) indicates that other influences are also at play.
overlies on the typical estuarine gradient. Thus, outer stations (e.g. 1 and 3) were not always more diverse than inner-stations (e.g. 4 or 7) (Tables 3 and 4). In contrast to what might have been expected (Harrel & Hall, 1991; Gaston et al., 1998; González-Oreja & Saiz-Salinas, 1998), the least diverse and most depauperated area (station 9) is located only 1 km from the richest and most diverse (station 10; Fig. 1; Tables 3 and 4). The low-tide physico-chemical characteristics of the water were not fundamentally different and sediment composition only differed in the relative proportion of coarse sand in intertidal areas (Table 1). The distance from the main pollution sources such as raw sewage/storm water drains located 100 m inland from station 9, do not explain the extreme differences observed between the two communities at stations 9 and 10. We hypothesise that the difference is directly related to man-made alterations of the channel. The foundations of the two bridges (inland from 10 and 9, respectively, Fig. 1) restrict water flow in both directions, effectively isolating that portion of the channel and greatly reducing the advantages of oceanic water dilution during rising tides and accentuating the negative impact of organic pollution discharge (Pereira et al., 2000). Species richness at intertidal stations 1 and 10 was higher than that found in other studies of Brazilian tropical estuarine systems (Corbisier, 1991), including that of the sandy-beach intertidal areas (Denadai et al.,
2000; Reis et al., 2000; Denadai et al., 2001). Outer stations, both intertidally and subtidally, had a higher richness than other subtropical Brazilian soft-bottom communities (Borzone & Souza, 1997) and much higher than those of subtropical Atlantic estuaries (Bemvenuti et al., 1978; Capitoli et al., 1978; Ieno & Bastida, 1998; Muniz & Venturini, 2001).
This estuarine system is numerically dominated by euryhaline species such as Mytella sp. and Anomalocardia brasiliana that, together with the tanaids Leptochelia sp. (Table 3), represented nearly half the community. The two bivalves showed peak occurrence in different seasons (A. brasiliana in winter and Mytella spat in spring) (Fig. 2). These and similar seasonal variations of macrofauna abundance are most probably related to reproductive cycles, as recorded for various South American sandy beaches (Souza & Gianuca, 1995; Bemvenuti, 1997; Veloso et al., 1997; Ieno & Bastida, 1998; Denadai et al., 2000). If fluctuations in larval recruitment contribute to temporal variations in abundance, the distribution and settlement of larvae are constrained by physical processes such as fine-scale hydrodynamics (Snelgrove & Butman, 1994). Actually, seasonal variability is often reflected in changing zonation patterns (McLachlan & Jaramillo, 1995), as observed in this study for Hiatella arctica and Leptochelia sp. (Fig. 2).
Ax
is
2
Axis 1 -1.4
-2.8
-4.1
-5.5
-6.9 1.4 2.8 4.1 5.5 6.9
-1.4 -2.8 -4.1 -5.5
-6.9 1.4 2.8 4.1 5.5 6.9
Salinity
Temperature
Dissolved Oxygen pH
Silt
Gravel
Coarse Sand
Medium Sand Fine Sand
Organic Matter
Vector scaling: 11,06
1
2
3
4
5
6
7
8 9
10 Station
Fig. 6. Representation of the two first axes of the CCA, presenting the biological samples (symbols) in their environmental settings (vectors). Samples are grouped by station (1 to 10). Vectors for environmental variables are scaled (x 11.06) to allow better viewing.
Ax is 2 Axis 1 • • • • • • • • • • • • • • • • • • • • • • • • • • • • • • • -2.2 2.2 -2.2 2.2 Salinity Temperature Dissolved Oxygen pH Silt Gravel Coarse Sand Medium Sand Fine Sand Organic Matter
Vector scaling: 3,54
Lumbrineridae Sipunculida
Nassarius sp. Lucina pectinata Veneridae
Actiniidae
Odostomia sp 1 Uca sp
Acari sp. 1
Anurida maritima
Ceratopogonidae Dolichopodidae Pupa Diptera
Cyclostremiscus sp. Helobia australis Odostomia sp 2
Chione subrostrata Heterodonax bimaculata
Golphingidae Decapoda- Natantia
Hexapanopeuspaulensis Panopeus harti Brachiura
Polydora sp.
Hyatella arctica Leptochelia sp. • • Diopatra cuprea Nerita fulgurans Isopoda Lysaretidae
Bivalve sp 2 Asymmetron lucayanum Ophiuroidea
Fig. 7: Representation of the two first axes of the CCA, presenting the species (black dots and triangles) in their environmental settings (vectors). Axis scale numbers have been removed (except at the extremities) and vectors scaled (x 3.54) to allow the best representation. Most-characteristic species are indicated by black dots (•) and the others by black triangles (▲).
Tanaids, such as Leptochelia sp., were abundant in both subtidal and intertidal areas (Fig. 2). One possibility is that mats of the colonial polychaetae Phyllochaetopterus socialis at subtidal station 10, that form intricate habitats suitable for many invertebrates (Nalesso et al., 1995), harbour the tanaids. In fact, 222 tanaids were found jointly with a polychaete colony in a grab sample. Microspatial heterogeneity is similarly enhanced in mussel beds of Mytella falcata and M. guyanensis and this provides microhabitats suitable for other organisms (Nishida & Leonel, 1995). Microbial communities (mainly microalgae) have also been shown to influence infaunal distributions supplying food to deposit-feeders (Snelgrove & Butman, 1994).
As for sandy bottom communities in south-eastern Brazil (Omena & Amaral, 1997), the dominant groups are molluscs, crustaceans and polychaetes. All stations, except station 8, showed that molluscs were the dominant group, primarily M. falcata and M. guyanensis at the intertidal inner-bay stations and A. brasiliana at the subtidal station 10. This contrasted strongly with studies from the Gulf of Mexico estuaries (Gaston et al., 1998) showing crustaceans and gastropods as dominant in waters of high oxygen content (>2.0 mg.l-1) and polychaetes in low DO areas (<2.0 mg.l-1). M. guyanensis is able to survive in extremely adverse conditions and is tolerant of fluctuating salinities (Nishida & Leonel, 1995). It most
probably escapes from low oxygen levels by closing tightly and switching its metabolism to anaerobic respiration (Constanza et al., 1993). Anomalocardia
brasiliana is common in areas affected by organic
pollution (Schaeffer-Novelli, 1980; Denadai et al., 2000), as observed in this study, in stations extremely polluted by sewage (e.g. station 10).
Salinity, sand, silt-clay and organic matter content determine the polychaete community structure at the beaches of São Sebastião, south-eastern Brazil (Omena & Amaral, 1997). However, organic content is probably the single most important factor for the distribution of infauna since it is the principal food source of detritivorous and suspensivorous species (Snelgrove & Butman, 1994). Thus, high species richness was observed at the intertidal level of stations 5, 6, 7 and 8, due to arthropods (such as Anurida maritima, Dolichopodidae, Ceratopogonidae, Diptera larvae and pupa, and Hydrachnidia sp.1), probably due to sewage runoff and rubbish disposal in these areas, combined with low salinity, high temperature, high silt-clay and organic matter content.
(Edgar & Barrett, 2000; Rumohr et al., 2001) and this proportion appears to be independent of sampling effort (Rumohr et al., 2001). The presence of these species seems to be an important piece of information allowing, among other things, the prediction of the total number of species in the community.
In conclusion, Vitória Bay presents epifaunal and infaunal macrobenthic assemblages that are spatially distributed along both the estuarine abiotic and substrate gradients. Exceptions to this pattern indicate areas that are even more highly impacted by urban sewage than others. The bay presents an almost lifeless area due to the conjunction of pollution and physical alteration of the channel. Overall, the macrobenthos may be characterised by singletons, population explosions, numerical dominance of immature specimens and abundance of terrestrial arthropods. All these characteristics relate poorly to a normal estuarine gradient and indicate an unhealthy estuary. Substrata colonisation still proceeds, sustained by opportunistic species with low survival rates. However, estuarine ecosystems, including tropical mangrove swamps, have a resilience that enables them to recover from disturbances and return to former levels within a relatively short period of time (Constanza et al., 1993; Lu & Wu, 1998). Provided sanitation efforts currently underway in the surrounding cities (sewage drains and primary treatment sewage plants) proceed and are successful, some recovery is to be expected. Most likely, improvement upon the present state will be most easily detected at sites that have been most seriously impacted.
A
CKNOWLEDGEMENTSThis study was supported by CNPq (Grant no 521150/97-3) and FACITEC - Vitória Council (Grant number PMV 0057754/98). We thank Gustavo S. Melo (MZ-USP), Ricardo Absalão (UFRJ) and Fabrício S. Sá (UVV) for their help in identifying decapod, gastropod and polychaete species, respectively. Taciana Kramer Pinto for statistical help and Adrian R. Beech (TAFI-Australia) for aid with the English.
R
EFERENCESAhn, I. Y. & Choi, J. W. 1998. Macrobenthic communities impacted by anthropogenic activities in an intertidal sand flat on the West Coast (Yellow Sea) of Korea. Mar. Pollut. Bull.,36:808-817.
Bemvenuti, C. E. 1997. Benthic invertebrates. In: Seeliger, U.; Odebrech, C. & Castello, J.P. eds. Subtropical convergence marine ecosystem: the coast and the sea in the warm temperate southwestern Atlantic. Berlin, Springer-Verlag. p. 43-46.
Bemvenuti, C. E.; Capitoli, R. R. & Gianuca, N. M. 1978. Estudos de ecologia bentônica na região estuarial da Lagoa dos Patos. I - Distribuição quantitativa do macrobentos infralitoral. Atlântica, Rio Grande,3:23-32. Borzone, C. A. & Souza, J. R. B. 1997. Estrutura da
macrofauna bentônica no supra, meso e infralitoral de uma praia arenosa no sul do Brasil. Oecologia Brasiliensis,3:197–212.
Byers, S. C.; Mills, E. L. & Stewart, P. L. 1978. A comparison of methods to determining organic carbon in marine sediments, with suggestion for a standard method. Hydrobiologia, 58:43-37.
Capitoli, R. R.; Bemvenuti, C. E. & Gianuca, N. M. 1978. Estudos de ecologia bentônica na região estuarial da Lagoa dos Patos. I – As comunidades bentônicas. Atlântica, Rio Grande,3:5-22.
Carmo, T. M. S. 1987. Os manguezais ao norte da Baía de Vitória, Espírito Santo. Simpósio sobre Ecossistemas da Costa Sul e Sudeste Brasileira. São Paulo, Publicações ACIESP, 54(1):173-194.
Clark, R. B. 1997. Marine Pollution. 4th ed. Oxford,
Clarendon Press. 161 p.
Clarke, K. R. & Warwick, R. M. 1994. Change in marine communities: an approach to statistical analysis and interpretation. Plymouth Marine Laboratory, Plymouth. 144 p.
Constanza, R.; Kemp, W. M. & Boynton, W. R. 1993. Predictability, scale, and biodiversity in coastal and estuarine ecosystems: implications for management. Ambio,22:88-96.
Corbisier, T. N. 1991. Benthic macrofauna of sandy intertidal zone in Santos estuarine system, São Paulo, Brazil.Bolm Inst. oceanogr., S Paulo, 39:1-13.
Dauer, D. M. 1993. Biological criteria, environmental health and estuarine macrobenthic community structure. Mar. Pollut. Bull., 26:249-257.
Dauer, D. M.; Luckenbach, M. W. & Rodi, A. J. Jr. 1993. Abundance biomass comparison (ABC method): effects of an estuarine gradient, anoxic/hypoxic events and contaminated sediments. Mar. Biol., 116:507-518. Denadai, M. R.; Amaral, A. C. Z. & Turra, A. 2000. Annual
variation of the malacofauna in two intertidal sandy substrates with rock fragments in South-eastern Brazil. Rev. Bras. Oceanogr., 48:141-150.
Denadai, M. R.; Amaral, A. C. Z. & Turra, A. 2001. Spatial distribution of molluscs on sandy intertidal substrates with rock fragments in south-eastern Brazil. Estuar. coast. Shelf Sci., 53:733-743.
Dias, C. O. 1994. Distribuição e variação espaço-temporal dos copépodes na Baía do Espírito Santo (Vitória-ES, Brasil).Arq. Biol. Tecnol., 37:929–949.
Dias, C. O. 1999. Morphological abnormalities of Acartia lilljeborgi (Copepoda, Crustacea) in the Espírito Santo Bay (ES Brazil). Hydrobiologia, 394:249–251.
Diegues, A. 1999. Human populations and coastal wetlands: conservation and management in Brazil. Ocean coast. manag., 42:187-210.
Edgar, G. J. & Barrett, N. S. 2000. Effects of catchment activities on macrofaunal assemblages in Tasmanian Estuaries. Estuar. coast. Shelf Sci.,50:639-654.
Gaston, G. R.; Rakocinski, C. F.; Brown, S. S. & Cleveland, C. M. 1998. Trophic function in estuaries: response of macrobenthos to natural and contaminant gradients. Mar. Freshw. Res., 49:833-846.
González-Oreja, J. A. & Saiz-Salinas, J. I. 1998. Exploring the relationships between abiotic variables and benthic community structure in a polluted estuarine system. Water Res., 32:3799-3807.
Harrel, R. C. & Hall, M. A. 1991. Macrobenthic community structure before and after pollution abatement in the Neches River estuary (Texas). Hydrobiologia, 211:241-252.
Ieno, E. N. & Bastida, R. O. 1998. Spatial and temporal patterns in coastal macrobenthos of Samborombon Bay, Argentina: a case study of very low diversity. Estuaries, 21:690-699.
Inglis, G. J. & Kross, J. E. 2000. Evidence for systematic changes in the benthic fauna of tropical estuaries as a result of urbanisation. Mar. Pollut. Bull.,41:367– 376.
Jesus, H. C. de; Costa, E. de A.; Mendonça, A. S. F. & Zandonade, E. 2004. Distribuição de metais pesados em sedimentos do sistema estuarino da Ilha de Vitória - ES. Quim. Nova, 27: 378-386.
Joyeux, J.-C., Pereira, B. B., & Almeida, H. G. (2004). The flood-tide ichthyoplanktonic community at the entrance into a Brazilian tropical estuary.J. Plankt. Res., 26:1277-1287.
Kennish, M. J. 1997. Pollution impacts on marine biotic communities. Boca Raton, Florida. CRC Press. 310 p. López-Gappa, J. J.; Tablado, A. & Magaldi, N. H. 1990.
Influence of sewage pollution on a rocky intertidal community dominated by the mytilid Brachidontes rodriguezi. Mar. Ecol. Progr. Ser., 63:163–175.
Loureiro-Fernandes, L. F.; Sterza, J. M.; Pereira, J. B. & Costa, D. 1998. Preliminary assessment of morphological alterations in the copepod Acartia lilljeborgi due to environmental changes in the Vitória Estuarine system, Vitória, ES, Brazil. Nauplius, 6:199-200.
Lu, L. & Wu, R. S. S. 1998. Recolonization and succession of marine macrobenthos in organic enriched sediment deposited from fish farms. Environ. Pollut.,101:241-251. Magurran, A. E. 1988. Ecological diversity and its
measurement. Princeton, New Jersey, Princeton University Press. 179 p.
McLachlan, A. & Jaramillo, E. 1995. Zonation on sandy beaches. Oceanogr. mar. Biol.: a. Rev., 33:305–335. Mitchell, G. J. P.; Nassar, C. A. G.; Maurat, M. C. S. &
Falcão, C. 1990. Tipos de vegetação marinha da baía do Espírito Santo sob a influência da poluição - Espírito Santo (Brasil). II Simpósio de Ecossistemas da Costa Sul e Sudeste Brasileira. São Paulo, Publicações ACIESP, 71(1):202-214.
Muniz, P. & Venturini, N. 2001. Spatial distribution of the macrozoobenthos in the Solís Grande stream estuary (Canelones-Maldonado, Uruguay). Braz. J. Biol., 61:409-420.
Nalesso, R. C.; Duarte, L. F. L.; Pierozzi Jr., I. & Enumo, E. F. 1995. Tube epifauna of the polychaete
Phyllochaetopterus socialis Claperede. Estuar. coast. Shelf Sci.,41:91-100.
Nishida, A. K. & Leonel, R. M. V. 1995. Occurrence, population dynamics and habitat characterization of
Mytella guyanensis (Lamarck, 1819) (Mollusca,
Bivalvia) in the Paraíba do Norte river estuary. Bolm Inst. oceanogr., S Paulo,43:41-49.
Omena, E. P. & Amaral, A. C. Z. 1997. Distribuição espacial de polychaeta (Annelida) em diferentes ambientes entre-marés de praias de São Sebastião (SP). Oecologia Brasiliensis, 3:183–196.
Pearson, T. H. & Rosenberg, R. 1978. Macrobenthic succession in relation to organic enrichment and pollution of the marine environment. Oceanogr. mar. Biol. a. Rev., 16:229–311.
Pereira, B. B.; Almeida, H. G; Castro, L. L. M.; Vieira, G. R. A. S. & Joyeux, J. C. 2000. Características físico-químicas da água na entrada do sistema estuarino da Baía de Vitória, ES. V Simpósio de Ecossistemas Brasileiros. São Paulo, Publicações ACIESP, 109(2):198–205. Rakocinski, C. F.; Brown, S. S.; Gaston, G. R.; Heard, R. W.;
Walker, W. W. & Summers, J. K. 1997. Macrobenthic responses to natural and contaminant-related gradients in Northern Gulf of Mexico estuaries. Ecol. Applic., 7:1278–1298.
Reis, M. O.; Morgado, E. H.; Denadai, M. R. & Amaral, A. C. Z. 2000. Polychaete zonation on sandy beaches of São Sebastião Island, São Paulo State, Brazil. Rev. Bras. Oceanogr.,48:107-117.
Rumohr, H.; Karakassis, I. & Jensen, J. N. 2001. Estimating species richness, abundance and diversity with 70 macrobenthic replicates in the Western Baltic Sea. Mar. Ecol. Progr. Ser.,214:103-110.
Schaeffer-Novelli, Y. 1980. Análise populacional de
Anomalocardia brasiliana (Gmelin, 1791) na Praia do Saco da Ribeira, Ubatuba, Estado de São Paulo. Bolm Inst. oceanogr., S Paulo,29:351-355.
Snelgrove, P. V. R. & Butman, C. A. 1994 Animal sediment relationships revisited - cause versus effect. Oceanogr. mar. Biol. a. Rev.,32:111-177.
Soares-Gomes, A. & Pizziolo, A. A. A. 1994. Correlação entre biomassa macrobêntica e características do sedimento da Praia do Canto e adjacências, Espírito Santo. III Simpósio de Ecossistemas da Costa Sul e Sudeste Brasileira. São Paulo, Publicações ACIESP,
87(3): 351-358.
Souza, J. R. B. & Gianuca, N. M. 1995. Zonation and seasonal variation of the intertidal macrofauna on a sandy beach of Paraná State, Brazil. Scientia Marina, 59:103-111.
Stark, J. S. 1998 Heavy metal pollution and macrobenthic assemblages in soft sediments in two Sydney estuaries, Australia. Austr. J. mar. Freshwat. Res.,49:533-540. Ter Braak, C. J. F. 1986. Canonical correspondence analysis:
a new eigenvector technique for multivariate direct gradient analysis. Ecology, 69:69–77.
Veloso, V. G.; Cardoso, R. S. & Fonseca, D. B. 1997. Spatio-temporal characterization of intertidal macrofauna at Prainha Beach (Rio de Janeiro State). Oecologia Brasiliensis,3:213-225.
Ueda, N.; Tsutsumi, H.; Machiko, Y.; Hanamoto, K. & Montani, S. 2000. Impacts of oxygen-deficient water on the macrobenthic fauna of Dokay Bay and on adjacent intertidal flats, in Kitakyushu, Japan. Mar. Pollut. Bull., 40:906-913.
Zar, J. H. 1999. Biostatistical analysis. 4th edition. Englewood
Cliffs, N. J., Prentice Hall. 663 p.