Article
Printed in Brazil - ©2016 Sociedade Brasileira de Química0103 - 5053 $6.00+0.00
*e-mail: [email protected]
Determination of CO
2, CH
4and N
2O: a Case Study for the City of Rio de Janeiro
Using a New Sampling Method
Cleyton M. Silva,a Sergio M. Corrêa*,a and Graciela Arbillab
aFaculdade de Tecnologia, Universidade do Estado do Rio de Janeiro, 27537-000 Resende-RJ, Brazil
bInstituto de Química, Universidade Federal do Rio de Janeiro, 21949-900 Rio de Janeiro-RJ, Brazil
A new sampling method using polypropylene syringes and chemical analysis by gas chromatography was proposed and applied to determine CO2, CH4 and N2O. The samples’ stability was evaluated and compared with the stability of the samples in stainless steel canisters and Tedlar®
bags. This methodology was applied to a case study in the urban area of the city of Rio de Janeiro, Brazil. In 2012, annual averages of 507.6 ± 13.2 µmol mol-1 for CO
2, 1.95 ± 0.06 µmol mol-1 for CH4 and 325.3 ± 3.4 nmol mol-1 for N2O were obtained. The results for CO2 and CH4 showed peak values in the warmer months and lower values in winter. This CO2 behavior is the opposite of that observed in studies performed in many other cities around the world and may be climate-related. CH4 and N2O inputs are probably due to the evaporation of liquid and solid waste both from landfill sites located within the city boundaries and from polluted rivers and canals. Additionally, other anthropogenic sources may be considered, such as the release of CH4 by the gas fuel network of the urban area and the emissions due to the use of compressed natural gas by light vehicles.
Keywords: urban atmosphere, greenhouse gas, carbon dioxide, methane, sampling
Introduction
According to the National Oceanic and Atmospheric Administration (NOAA), the highest globally averaged temperature for land and ocean surfaces since records began
in 1880 was measured in 2014.1 Additionally, in 2014, for
the first time since carbon dioxide has been measured at Mauna Loa Observatory, Hawaii, its peak levels surpassed
400 µmol mol-1 during three consecutive months in the
atmosphere.2
The highest carbon dioxide global average concentration
was 398.83 µmol mol-1 in May 2014, according to NOAA.2
Although this value has not yet reached 400 µmol mol-1,
these global concentrations of the main greenhouse gases (GHG) represent the highest historical values.
Carbon dioxide (CO2) is the most important
anthropogenic greenhouse gas in the atmosphere;3 however,
two other gases, i.e., methane (CH4) and nitrous oxide
(N2O), are important, and they are all closely related to
anthropogenic activities, such as fossil fuel combustion, agriculture, biomass burning and waste management.
Brazil is the largest country in Latin America. It is the world’s fifth largest country by both geographical area and
population.4 It is considered part of the BRICS (Brazil,
Russia, India, China and South Africa) group of countries, which are similar in terms of area, large populations and growing economies and, together, are responsible for 18%
of the world’s gross domestic product (GDP).5
The BRICS group emits an average of 4.5 metric tons
per capita of CO2, whereas the entire world, including the
developed countries, emits an average level of 4.9 metrics
tons per capita, according to the World Bank.6 This points
the need for the effective monitoring of GHG emissions in these countries.
Many studies have been published involving the measurement of GHG that originate from different sources, including stationary sources, mobile sources and ambient air. For example, GHG measurements have been included in studies involving emissions from human activities in the soil,7-11 ships,12,13 hydroelectric reservoirs,14
vehicles15-17 and thermoelectric power plants.18 However,
to our knowledge, the available literature contains no information on the variation in GHG concentrations in Rio de Janeiro and other Brazilian cities, despite their high level of urbanization and economical activities.
The annual emissions of CO2, CH4 and N2Oin Rio de
Janeiro have been estimated as 8,734 Gg, 112,616 t and
as 11,352 Gg CO2, which means that the CH4 and N2O
contribution to GHG is approximately 25%.19
A variety of methods for determining trace gases in the atmosphere has been developed. Discontinuous methods can be performed, without pre-concentration, by using stainless steel canisters or Tedlar® bags to collect air
samples and for further chromatographic analysis.20
The collection of ambient air samples in canisters is common practice, and it is mainly done for the determination of volatile organic compounds (VOCs) in
the atmosphere.21,22 These canisters have advantages such
as inertness, ruggedness, reuse and durability. Despite the high collection efficiency, there are some disadvantages when it is necessary to collect multiple samples at different sampling points, such as the high costs and greater difficulties in transporting the samples.
In most of the published studies regarding the measurement of GHG in ambient air from stationary and mobile sources, online analysis methods are employed,
such as chromatographic and spectroscopic techniques.23-25
Commercial analyzers, which have the advantage of providing continuous measurements, are available for automatic GHG monitoring. The high cost of these instruments and the installation requirements are their main disadvantages.
GHG are not currently monitored in Brazilian cities. To our knowledge, there are no data for Rio de Janeiro, which is the second largest city in Brazil. The following investigation was conducted to evaluate the efficacy of low-cost polypropylene (PP) syringes for the sampling and
storage of CO2, CH4 and N2O. The method was applied in
a study case in Rio de Janeiro to evaluate the concentration of these three compounds at representative locations to determine the hourly concentrations over a typical day and seasonal variations throughout one year.
Experimental
Sampling media
In this experiment, 6.0 L internally electropolished
(Restek SUMMA® coating) stainless steel canisters, 3.0 L
Tedlar® bags (SKC), and 100 mL medical graduate PP
syringes with Luer caps were used. The syringes’ features include easy handling and transportation and a very low cost
per unit. These types of syringes are also used in medical
procedures and contain a PP body and rubber plunger. PP syringes might be a suitable substitute when continuous measurements are not available or when sampling with other well-developed sampling media, such as canisters
and Tedlar® bags, cannot be implemented due to the related
costs or difficult-to-reach sampling locations. For a blank test, each sampling material was filled with 99.999% synthetic air provided by Linde Gas.
Chemical analyses
The samples were analyzed by gas chromatography with multiple detectors. Chemical analyses were performed using an Agilent 7890A Gas Chromatograph with three detectors: a thermal conductivity detector (TCD) to
measure CO2 at high levels as well as molecular oxygen
and nitrogen, an electron capture detector (ECD) to measure
N2O and a flame ionization detector (FID) to measure CH4
and CO2 at low levels.
The chromatography system used two separated channels with 1/8” packed columns (HayeSep Q80/100). The first channel had two valves for the TCD and FID,
which were organized in series to measure CO2 by using
a methanizer to convert CO2 to CH4. The other channel,
which also had two valves, was used to measure N2O on the
micro ECD. Two pre-columns were used to retain heavier compounds and to purge oxygen and water through the vent. The system used a 1.0 mL sampling loop, and the columns, valves, FID, ECD and TCD were operated at 60 °C, 100 °C, 250 °C, 350 °C and 200 °C, respectively. Helium 5.0 was used as the mobile phase at a flow rate of
21 mL min-1. Quantification was performed using triplicate
external calibration curves and three standard reference GHG mixtures provided by Linde Gas. The certified
concentrations for CO2, CH4 and N2O were 351 ± 7;
1.510 ± 0.075 and 0.250 ± 0.012 µmol mol-1, respectively,
according to the standard number 2040/11; 401 ± 7,
1.760 ± 0.088 and 0.300 ± 0.015 µmol mol-1, respectively,
according to the standard number 041/11; and 451 ± 9;
2.010 ± 0.100 and 0.350 ± 0.017 µmol mol-1, respectively,
according to the standard number 04/11. The determination
coefficients (R2) for the triplicate calibration curves were
higher than 0.99 for CO2 and CH4 and 0.98 for N2O.
Stability tests
First, a stability test was performed comparing the most common sampling methods (stainless steel canisters and
Tedlar® bags) with the new proposed method (PP syringes)
by checking the sample stability for 10 days of a certified
standard mixture containing CO2 (401 ± 7 µmol mol-1), CH4
(1.760 ± 0.088 µmol mol-1) and N
2O (300 ± 15 nmol mol-1)
in synthetic air, supplied by Linde Gas (Linde, certificate number 2041/11).
prepared with different concentrations, stored in the three sampling medias for 10 days, and compared with the initial concentrations.
The control atmospheres were prepared inside 10 L
black Tedlar® bags using 99.999% nitrogen as the dilution
gas. The others gases (CO2, CH4, N2O, CO, NO and NO2)
were supplied by Linde Gas.
A Sierra Mass Flow controller was used in the dilution process. The GHG were determined by gas chromatography, as previously described, and CO, NO,
and NO2 were determined using Thermo Scientific
analyzers (models 48i for CO and 42i for NO and NO2).
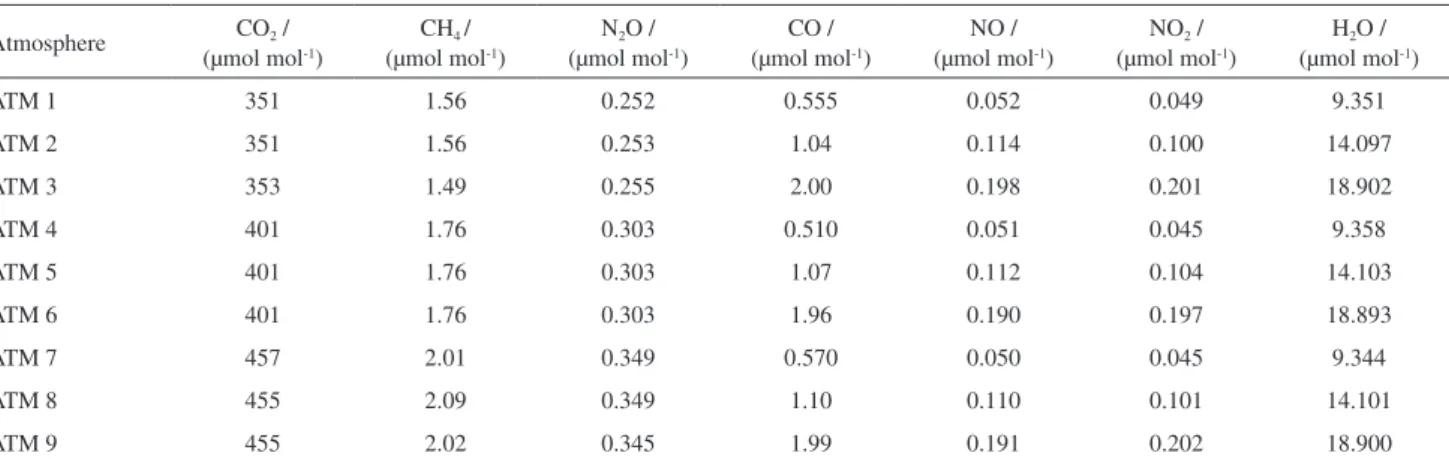
Water content was controlled by injection, using a syringe at 20 °C and 101 kPa. The composition of the control atmospheres is shown in Table 1. The selected values for GHG concentrations were in the same range as those expected for the atmospheric samples.
Ambient air collection
PP syringes were used to collect ambient air samples in
Rio de Janeiro. The city has a population of 6,453,68226 and
contains 2,451,155 vehicles27 in an area of 1,224 km2. Air
circulation is greatly affected by topographical conditions; the Tijuca Forest, a mountainous rainforest area, forms a natural barrier to air circulation and divides the city into
northern and southern sections.28 As described below, all of
the samples were collected in the northern area of the city in locations that are strongly affected by vehicle emissions.
No samples were collected during rainy days or days with atypical anthropogenic emissions. The distance from the sampling positions to obstacles was at least twice the height of the obstacle, and the surrounding environment was free of interference from obstacles. Sampling was performed at a height of approximately 1.5 m above the
ground, and the syringe was rinsed five times with the same ambient air before sampling. A 0.2 µm fiberglass filter was linked to the syringe to prevent the entry of particulate matter, which could damage the chromatographic system. The duration of the sampling for one syringe was approximately 10 seconds. After sampling, the syringes were sealed with Luer caps, protected from light with aluminium foil and stored at room temperature.
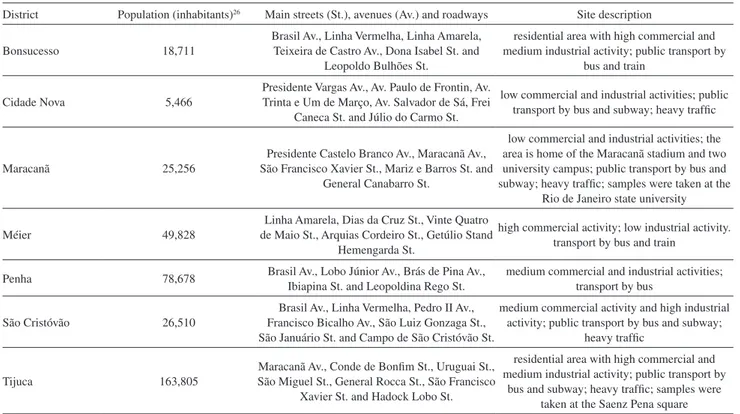
Initially, 3 samples were collected in 2011 at different times in each of seven districts in the city, as described in Table 2. The sampling locations were mainly residential areas with intense vehicular traffic and commercial activity that are representative of the city. A map of the city indicating the sampling locations is shown in the Supplementary Information section, Figure S1. The exact localization of each sampling point is shown in the Supplementary Information section, Table S1. A brief description of each location is presented in Table 2. Data collected during the sampling period at three monitoring stations of the Environmental Municipal Secretary (SMAC) showed a
predominance of weak winds (0-4 km h-1) in the southeast
and northwest directions and ambient temperatures between 20 and 35 °C. The mixing height profiles were measured using radiosondes at Rio de Janeiro International Airport, which is located approximately 10-15 km from
the sampling sites.29 At 10:00 a.m. on each day, the
mixing heights were 388-858 m, as detailed in Table S1. Other meteorological data are presented in Table S2.
Later, to check the evolution of the hourly concentrations, 12 samples were collected during the period from 6:00 a.m. to 6:00 p.m. on January 3, 2012, at the Maracanã Campus of the Rio de Janeiro State University, where an automatic air quality monitoring station was located. The mixing height at 10:00 a.m. was 290 m. Meteorological and criteria pollutants concentration data were collected at the station.
Table 1. Composition of the control atmospheres used for the stability tests in µmol mol-1; CO
2, CH4 and N2O concentrations were determined by gas
chromatography at the conditions described in the text
Atmosphere CO2 /
(µmol mol-1)
CH4 /
(µmol mol-1)
N2O /
(µmol mol-1)
CO / (µmol mol-1)
NO / (µmol mol-1)
NO2 /
(µmol mol-1)
H2O /
(µmol mol-1)
ATM 1 351 1.56 0.252 0.555 0.052 0.049 9.351
ATM 2 351 1.56 0.253 1.04 0.114 0.100 14.097
ATM 3 353 1.49 0.255 2.00 0.198 0.201 18.902
ATM 4 401 1.76 0.303 0.510 0.051 0.045 9.358
ATM 5 401 1.76 0.303 1.07 0.112 0.104 14.103
ATM 6 401 1.76 0.303 1.96 0.190 0.197 18.893
ATM 7 457 2.01 0.349 0.570 0.050 0.045 9.344
ATM 8 455 2.09 0.349 1.10 0.110 0.101 14.101
The minimum temperature was 20 °C at 6:00 a.m., and the maximum temperature was 30 °C at midday. Wind was from the southeast direction and was weak (approximately 1.5 km h-1).
Finally, 38 samples were collected at Maracanã Campus of the Rio de Janeiro State University during the year of 2012. Samples were always collected in triplicate on Mondays at 1:00 p.m. Samples were collected at a height of 70 m to avoid the possible contribution of local sources of GHG. Additionally, no samples were taken on rainy days or holidays (14 days).
Statistical analysis
The experimental data were analyzed using Statistica 7.0 (Statsoft) to define descriptive statistics before extended analyses. A multivariate statistical analysis was performed that included linear correlation analysis (Pearson coefficients) and principal component analysis (PCA). Both calculations were achieved using the individual experimental values for each sample and sampling site.
Results and Discussion
A typical chromatogram for the GHG standard, in which the three detectors operated simultaneously, is shown in the Supplementary Information section, Figure S2.
The results for the stability test performed with the GHG standard are shown in Table 3. The values for the three sampling media are the arithmetic means and standard deviations for six results obtained over 10 days of storage.
These results show that the stability of GHG samples is similar in the syringes to that found in the more usual
sampling devices (stainless steel canisters and Tedlar®
bags). The difference between the initial value and the mean value is always less than 3%, which suggests that
syringes are an effective sample storage approach.30 For
volatile organic compounds, a difference less than 25% is
considered satisfactory.22
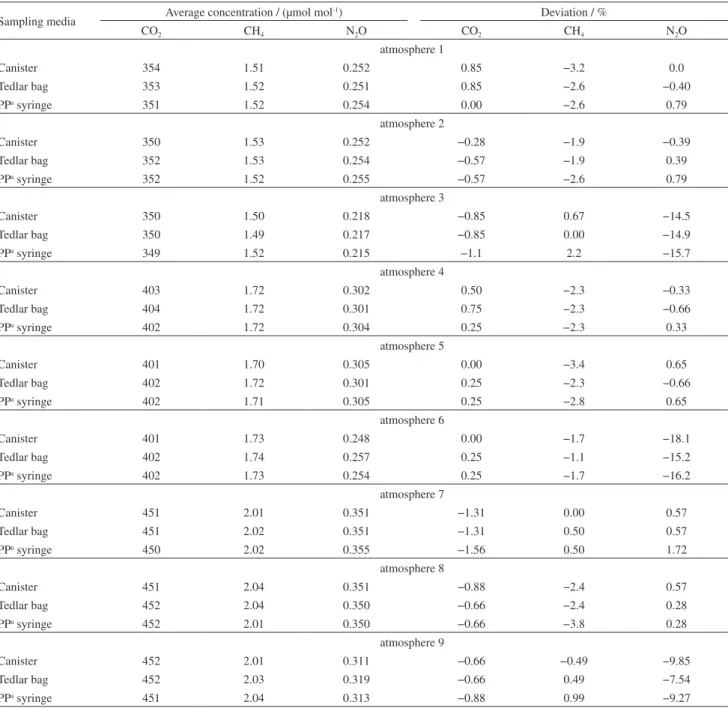
The results for the stability test of GHG in the control atmospheres (Table 1) are shown in Table 4. The values are the mean concentrations for three replicate determinations of samples after 10 days of storage and the deviations from the initial value.
Considering the mean values and concentrations of the standard mixture and the uncertainties from the
manufacturer (1.75% for CO2, 5.11% for CH4 and 5.00%
for N2O), it can be concluded that all of the sample media
evaluated were effective in storing GHG for a period of 10 days under different concentration conditions.
No effect was observed in the presence of different levels of CO2, CH4, N2O, CO, NO and NO2. However, in the
mixtures with higher water content, which was equivalent
to a relative humidity of 80%, a reduction in N2O value
Table 2. Description of sampling districts in Rio de Janeiro
District Population (inhabitants)26 Main streets (St.), avenues (Av.) and roadways Site description
Bonsucesso 18,711
Brasil Av., Linha Vermelha, Linha Amarela, Teixeira de Castro Av., Dona Isabel St. and
Leopoldo Bulhões St.
residential area with high commercial and medium industrial activity; public transport by
bus and train
Cidade Nova 5,466
Presidente Vargas Av., Av. Paulo de Frontin, Av. Trinta e Um de Março, Av. Salvador de Sá, Frei
Caneca St. and Júlio do Carmo St.
low commercial and industrial activities; public transport by bus and subway; heavy traffic
Maracanã 25,256
Presidente Castelo Branco Av., Maracanã Av., São Francisco Xavier St., Mariz e Barros St. and
General Canabarro St.
low commercial and industrial activities; the area is home of the Maracanã stadium and two university campus; public transport by bus and subway; heavy traffic; samples were taken at the
Rio de Janeiro state university
Méier 49,828
Linha Amarela, Dias da Cruz St., Vinte Quatro de Maio St., Arquias Cordeiro St., Getúlio Stand
Hemengarda St.
high commercial activity; low industrial activity. transport by bus and train
Penha 78,678 Brasil Av., Lobo Júnior Av., Brás de Pina Av., Ibiapina St. and Leopoldina Rego St.
medium commercial and industrial activities; transport by bus
São Cristóvão 26,510
Brasil Av., Linha Vermelha, Pedro II Av., Francisco Bicalho Av., São Luiz Gonzaga St., São Januário St. and Campo de São Cristóvão St.
medium commercial activity and high industrial activity; public transport by bus and subway;
heavy traffic
Tijuca 163,805
Maracanã Av., Conde de Bonfim St., Uruguai St., São Miguel St., General Rocca St., São Francisco
Xavier St. and Hadock Lobo St.
residential area with high commercial and medium industrial activity; public transport by
Table 3. Mean concentration and standard deviation values of CO2, CH4 and N2O in three sampling media along 10 days of storage at ambient temperature
protected from light
Mean concentration value Standard deviation / %
CO2 /(µmol mol-1) CH4 /(µmol mol-1) N2O / (nmol mol-1) CO2 CH4 N2O
Initial valuea 401 1.76 300 − − −
Canister 402.83 1.72 302.47 0.10 0.45 0.23
Tedlar bag 403.55 1.71 300.69 0.15 0.28 1.01
PPb syringe 402.31 1.72 304.18 0.13 0.80 0.45
aInitial concentration value for each gas in the standard gas (Linde Gases number 2041/11); bPP: polypropylene.
Table 4. Mean concentrations of CO2, CH4 and N2O in the control atmospheres and deviations from the initial value for three replicate determinations of
samples after 10 days of storage
Sampling media Average concentration / (µmol mol
-1) Deviation / %
CO2 CH4 N2O CO2 CH4 N2O
atmosphere 1
Canister 354 1.51 0.252 0.85 −3.2 0.0
Tedlar bag 353 1.52 0.251 0.85 −2.6 −0.40
PPa syringe 351 1.52 0.254 0.00 −2.6 0.79
atmosphere 2
Canister 350 1.53 0.252 −0.28 −1.9 −0.39
Tedlar bag 352 1.53 0.254 −0.57 −1.9 0.39
PPa syringe 352 1.52 0.255 −0.57 −2.6 0.79
atmosphere 3
Canister 350 1.50 0.218 −0.85 0.67 −14.5
Tedlar bag 350 1.49 0.217 −0.85 0.00 −14.9
PPa syringe 349 1.52 0.215 −1.1 2.2 −15.7
atmosphere 4
Canister 403 1.72 0.302 0.50 −2.3 −0.33
Tedlar bag 404 1.72 0.301 0.75 −2.3 −0.66
PPa syringe 402 1.72 0.304 0.25 −2.3 0.33
atmosphere 5
Canister 401 1.70 0.305 0.00 −3.4 0.65
Tedlar bag 402 1.72 0.301 0.25 −2.3 −0.66
PPa syringe 402 1.71 0.305 0.25 −2.8 0.65
atmosphere 6
Canister 401 1.73 0.248 0.00 −1.7 −18.1
Tedlar bag 402 1.74 0.257 0.25 −1.1 −15.2
PPa syringe 402 1.73 0.254 0.25 −1.7 −16.2
atmosphere 7
Canister 451 2.01 0.351 −1.31 0.00 0.57
Tedlar bag 451 2.02 0.351 −1.31 0.50 0.57
PPa syringe 450 2.02 0.355 −1.56 0.50 1.72
atmosphere 8
Canister 451 2.04 0.351 −0.88 −2.4 0.57
Tedlar bag 452 2.04 0.350 −0.66 −2.4 0.28
PPa syringe 452 2.01 0.350 −0.66 −3.8 0.28
atmosphere 9
Canister 452 2.01 0.311 −0.66 −0.49 −9.85
Tedlar bag 452 2.03 0.319 −0.66 0.49 −7.54
PPa syringe 451 2.04 0.313 −0.88 0.99 −9.27
was observed. In the ATM 6 mixture, a reduction of 18.1,
15.2 and 16.2% was observed for the canister, Tedlar®
bag (14.33%) and PP syringe, respectively. This may be explained by possible water condensation on the inner wall and the partial solubilization of N2O.
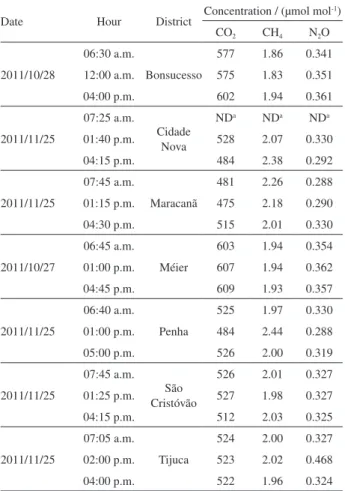
After the calibration procedure, samples were collected at seven locations in Rio de Janeiro at three different hours of the day. The mean concentrations are shown in Table 5.
The CO2 concentrations were higher than 400 µmol mol-1
for all samples. The reported values, which were between
475 and 609 µmol mol-1, are typical of urban areas, as
previously determined in many other places throughout
the world. The persistence of CO2 over urban areas as a
result of anthropogenic contribution to the CO2 budget
has been reported in many cities and is known as the
urban dome. The typical concentrations of CO2 in urban
areas are between 350 and 600 µmol mol-1 and depend on
meteorological parameters and urban agglomeration.31,32 In
this work, samples were collected in the spring (October and November) in residential areas that are highly affected
by vehicle emissions, which were expected to be the main source of CO2.33
As shown in Table 5 and in the Supplementary Information section, Figure S3, when the sample locations
are compared, higher levels of CO2 can be observed in
two districts, Bonsucesso and Méier, which is probably due to the preferential dispersion of pollutants affected by the topography of these districts and a higher local anthropogenic contribution related to intense commercial activity, high vehicular flux and traffic jams.
According to literature data, the typical concentrations
of CH4 in urban areas are between 1.70 and 2.50 µmol mol-1
and are influenced by meteorological parameters and urban agglomeration. The most significant sources of methane
come from the anaerobic decomposition of organic matter.3
The values obtained in this work were in the range of
1.83-2.44 µmol mol-1, which is in good agreement with the
reported values for other urban centers. As shown in Table 5 and in the Supplementary Information section, Figure S4, the higher values were obtained in the Penha, Maracanã and Cidade Nova Districts, and they may be attributed to the proximity of polluted rivers with a high organic matter content. The available emission inventories for the city
attribute approximately 90-95% of the total CH4 emissions
to the disposal of residential, commercial and industrial solid waste in sanitary landfills and to untreated liquid waste.33
As shown in Table 5 and in the Supplementary
Information section, Figure S5, N2O concentrations were
in the range of 292-360 nmol mol-1, except for one atypical
value (468 nmol mol-1). The anthropogenic contribution of
N2O is mainly related to the disposal of solid and liquid
waste.33
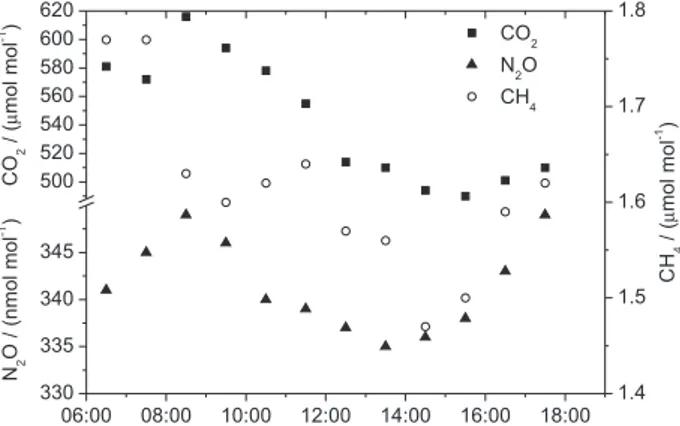
Diurnal variations in the concentrations were
also observed, as shown in Figure 1. For CO2, the
concentrations varied between 490 and 616 µmol mol-1.
The results indicate that for this compound, higher values were observed in the morning and evening hours, which indicates the effect of the rush hours, and the lowest values were obtained at midday, as previously observed in
other cities.34 The methane concentrations varied between
1.50 and 1.77 µmol mol-1, which is in the same range
as the natural levels (1.65 µmol mol-1). A slight diurnal
variation due to the boundary layer height and potential photochemical decay was observed. These effects are probably compensated by methane release through
evaporation, which, in turn, depends on temperature. N2O
concentrations varied between 335 and 349 nmol mol-1,
with a slight decrease near midday that was probably due to the superposition of two effects: the dilution effect of the boundary layer height and the increase of emissions through the evaporative process.
Table 5. Concentrations of CO2, CH4 and N2O in seven districts of Rio de
Janeiro. Samples were collected using syringes, as described in the text
Date Hour District Concentration / (µmol mol
-1)
CO2 CH4 N2O
2011/10/28
06:30 a.m.
Bonsucesso
577 1.86 0.341
12:00 a.m. 575 1.83 0.351
04:00 p.m. 602 1.94 0.361
2011/11/25
07:25 a.m.
Cidade Nova
NDa NDa NDa
01:40 p.m. 528 2.07 0.330
04:15 p.m. 484 2.38 0.292
2011/11/25
07:45 a.m.
Maracanã
481 2.26 0.288
01:15 p.m. 475 2.18 0.290
04:30 p.m. 515 2.01 0.330
2011/10/27
06:45 a.m.
Méier
603 1.94 0.354
01:00 p.m. 607 1.94 0.362
04:45 p.m. 609 1.93 0.357
2011/11/25
06:40 a.m.
Penha
525 1.97 0.330
01:00 p.m. 484 2.44 0.288
05:00 p.m. 526 2.00 0.319
2011/11/25
07:45 a.m.
São Cristóvão
526 2.01 0.327
01:25 p.m. 527 1.98 0.327
04:15 p.m. 512 2.03 0.325
2011/11/25
07:05 a.m.
Tijuca
524 2.00 0.327
02:00 p.m. 523 2.02 0.468
04:00 p.m. 522 1.96 0.324
Correlation coefficients were calculated between CO2,
CH4 and N2O and the criteria pollutants’ concentrations,
which were determined at the monitoring station. The CO2
concentrations showed correlation coefficients over the 0.6 threshold with all of the primary pollutants, CO (0.84),
NOx (0.91) and inhalable particulate matter (0.66). Because
the main emission source in the studied area of the criteria pollutants are vehicles, it could be assumed that this is also
the main source of CO2 and that anthropogenic emissions
are the primary source of the urban CO2 dome. The
correlation of CH4 with the criteria pollutants was poor
except for with NOx (0.60). N2O showed correlations with
CO (0.74) and NOx (0.78).
Figure 2 shows the results of samples collected from January to December 2012 at the Maracanã campus of Rio de Janeiro State University (UERJ). GHG have seasonal variations, which are called annual cycles, as previously
reported by several authors.35-38 These annual cycles
vary according to geographical location, altitude and meteorological conditions. Correlation coefficients were calculated between our data and the meteorological data (temperature, relative humidity and wind speed). These correlations were poor, and the analysis of regression coefficients showed that all of the values were lower than the 0.6 threshold. The highest value was observed for the
CO2-temperature correlation (0.46). A high correlation was
observed for CO2 and CH4 (0.85), which may be due to a
common source or to an indirect correlation with another parameter, such as the mixed layer height. This correlation suggests that anthropogenic activities, particularly vehicle traffic, are an important source of methane in the urban
atmosphere.34 PCA analysis highlighted three principal
components, P1 (CO2, CH4 and temperature), P2 (relative
humidity) and P3 (N2O), which account for 82% of the
total variance.
The results in Figure 2 indicate strong seasonal
variations of CO2 and CH4, with peak values in the warmer
months and lower values in winter and with averages of
507.6 ± 13.2 µmol mol-1 for CO
2, 1.95 ± 0.06 µmol mol-1
for CH4 and 325.3 ± 3.4 nmol mol-1 for N2O. The values
for N2O were not related to the seasons, with an average
standard deviation of 1.0%.
This CO2 behavior was the opposite of that observed in
studies performed in many other cities around the world.
In general, for CO2, the largest values were recorded in
autumn, at the end of the biological cycle of plants, and
during the winter, and the CH4 concentrations showed a
seasonal variation, with maxima in the summer and minima
in the autumn and spring.34 The observed behavior in Rio
de Janeiro may be related to the climatic and geographical characteristics. The city has a tropical wet and dry/savanna climate, with a pronounced dry season in the low-sun months, no cold season and a wet season (October-March) during the high-sun months. The city surrounds Tijuca National Park (TNP), a secondary rainforest, which
occupies 32 km2 (3.5% of the area of Rio de Janeiro), and
is home to hundreds of species of plants and wildlife, of which many are threatened by extinction and are found only
in the Atlantic Rainforest.39 The concentrations of CO
2 and
CH4 were higher during the high-sun months
(November-March). The annual CO2 cycle with the highest values in
summer and the lowest values in winter may reflect the high increase in energy consumption, especially that generated by thermo-electrical units, related to the use of refrigeration systems and the increase in tourism in the city. It may also be related to the growth and decay of vegetation in TNP, which is surrounded by the city. The TNP vegetation is characterized by large trees, palms, ferns, epiphytes and lianas. The more frequent plant families are Leguminosae, Sapotaceae, Bombacaceae, Lecythidaceae, Mraceae and
Melastomataceae.40 To our knowledge, no studies about
CO2 sequestration have been conducted for this forest.
06:00 08:00 10:00 12:00 14:00 16:00 18:00
330 335 340 345 500 520 540 560 580 600 620 CO2 N2O CH4 N2 O / (n m o l m o l -1) C O2 / ( µ m o l m o l -1) 1.4 1.5 1.6 1.7 1.8 C H4 / ( µ m o l m o l -1 )
Figure 1. Concentrations of CO2, CH4, and N2O on January 3, 2012, at
the Maracanã Campus of the Rio de Janeiro State University (UERJ).
J F M A M J J A S O N D J
315 320 325 330 335 480 490 500 510 520 530 540 550 N2 O / ( µ m o l m o l -1) C O2 / ( µ m o l m o l -1) CO2 N2O CH4 1.5 1.6 1.7 1.8 1.9 2.0 2.1 C H4 / ( µ m o l m o l -1 )
Figure 2. Concentrations of CO2, CH4, and N2O in 2012 at the Maracanã
As discussed in the literature, the global estimates of
atmospheric CO2 exchange indicate that the tropics are
near equilibrium or are a source with respect to carbon, though there remain considerable uncertainties as to the
contribution of different processes.41
Regarding CH4, the variations may be related to
the input from evaporation of liquid and solid waste from landfill sites located within the city boundaries and from polluted rivers and canals. Additionally, other anthropogenic activities that may be considered are the release of methane by the gas fuel network of the urban area and emissions due to the use of compressed natural gas in taxis and light vehicles.42,43
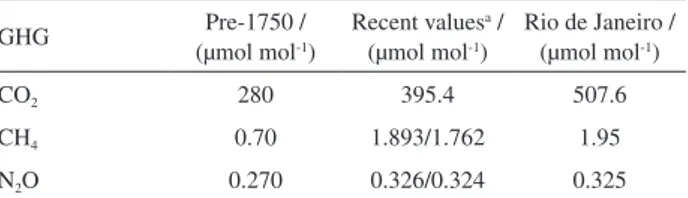
The mean concentration values for each compound, calculated as the arithmetic mean of data obtained from January to December 2012, and the concentrations from the pre-industrial period and global values are shown in Table 6.44
The pre-industrial global-scale trace-gas concentrations from prior to 1750 are assumed to be practically uninfluenced by human activities such as increasingly specialized agriculture, land clearing, and combustion of fossil fuels. Recent tropospheric concentrations of most gases tend to vary systematically over the course of a year, and the global values given in Table 6 represent averages over a specific 12-month period for all gases (the year of
2013 for CO2 and 2012 for CH4 and N2O).
Comparing the data in Table 6, it can be observed that in
Rio de Janeiro, the concentration of CO2, the main compound
responsible for the greenhouse effect, is 30% higher than the
mean global value, thus confirming the presence of a CO2
dome over the studied urban area. For CH4 and N2O, the
values obtained in this work are, respectively, 11.5 and 1% higher than the global concentrations. Values reported in this work should be considered with caution because samplings were always made at noontime on non-rainy workdays and were thus not obtained in the conditions of global values and are not representative of diurnal and weekly variations. However, they do indicate a contribution of urban emissions to CO2 and CH4 levels.
Conclusions
The proposed method of sampling provided good results, lower costs and easier implementation in comparison to other sampling devices. It seems to be a good alternative
for investigating the CO2, CH4 and N2O concentrations in
cities where global monitoring is not performed, such as Brazilian and other Latin American cities.
In the studied urban area in Rio de Janeiro, the
concentration of CO2, which is the main compound
responsible for the greenhouse effect, is 30% higher than
the mean global value, confirming the presence of a CO2
dome over the studied urban area. The results for CO2 and
CH4 show peak values in the warmer months and lower
values in winter. This CO2 behavior is the opposite to that
observed in studies performed in many other cities around the world and may reflect the summer increase in energy use due to the higher temperatures and the vegetation cycle in the rainforest, which is part of the urban area. These particular characteristics suggest that further study of the role of the urban rainforest, wetlands and rivers in the air quality of the city may be significant and that the carbon cycle of the vegetation in the rain forest should be studied.
Supplementary Information
Supplementary Information (Tables S1 and S2 and Figures S1-S5) is available free of charge at http://jbcs.sbq.org.br as PDF file.
Acknowledgments
The authors thank the Rio de Janeiro State Foundation for Research Support (FAPERJ) and National Research Council (CNPq) for their partial financial support. They also thank the Rio de Janeiro Environmental Municipal Secretary (SMAC) for providing some data.
References
1. http://www.ncdc.noaa.gov/sotc/global/2014/12, accessed in November 2015.
2. http://www.esrl.noaa.gov/gmd/, accessed in November 2015. 3. http://www.wmo.int/pages/themes/climate/causes_of_climate_
change.php, accessed in November 2015.
4. Philander, S. G., ed.; Encyclopedia of Global Warming and Climate Change, 2nd ed.; Sage: London, 2012.
5. http://brics6.itamaraty.gov.br/pt_br/sobre-o-brics/dados-economicos, accessed in November 2015.
6. http://data.worldbank.org/country/, accessed in April 2015.
Table 6. CO2, CH4 and N2O tropospheric concentrations in the
pre-industrial period (pre-1750), average global data and values determined in Rio de Janeiro (annual averages)
GHG Pre-1750 /
(µmol mol-1)
Recent valuesa /
(µmol mol-1)
Rio de Janeiro / (µmol mol-1)
CO2 280 395.4 507.6
CH4 0.70 1.893/1.762 1.95
N2O 0.270 0.326/0.324 0.325
aAverages over a specific 12-month period for all gases (the year of 2013
7. van Groenigen, J. K.; Osenberg, C. W.; Hungate, B. A.; Nature
2011, 475, 214.
8. Zervas, G.; Tsiplakou, E.; Atmos. Environ. 2012, 49, 13. 9. Salm, J.; Maddison, M.; Tammik, S.; Soosaar, K.; Truu, J.;
Mander, U.; Hydrobiologia 2012, 692, 41.
10. Chen, G. C.; Tam, N. F. Y.; Ye, Y.; Sci. Total Environ. 2010, 408, 2761.
11. Sneath, R. W.; Beline, F.; Hilhorst, M. A.; Peu, P.; Agric. Ecosyst. Environ. 2006, 112, 122.
12. Villalba, G.; Gemechu, E. D.; Energy Policy 2011, 39, 1363. 13. Sames, P. C.; Kopke, M.; Procedia Soc. Behav. Sci. 2012, 48,
1.
14. Demarty, M.; Bastien, J.; Energy Policy 2011, 39, 4197. 15. Hao, H.; Wang, H.; Ouyang, M.; Energy Policy 2012, 43, 244. 16. Reynolds, C. C. O.; Kandikar, M.; Badami, M. G.; Transport.
Res. D-Tr. E. 2011, 16, 160.
17. Graham, L. A.; Rideout, G.; Rosenblatt, D.; Hendren, J.; Atmos. Environ. 2008, 42, 4665.
18. Chakraborty, N.; Mukherjee, I.; Santra, A. K.; Chowdhury, S.; Chakraborty, S.; Bhattacharya, S.; Mitra, A. P.; Sharma, C.; Atmos. Environ. 2008, 42, 1073.
19. Rio, 2011, http://www.rio.rj.gov.br/dlstatic/10112/1712030/ DLFE-222982.pdf/NelsonSINVENTARIOFINALMAC_ Resumo_Geral_Inv_e_Cenario_v05abr_E.pdf, accessed in November 2015.
20. Finalyson-Pitts, B. J.; Pitts Jr., J. N.; Chemistry of the Upper and Lower Atmosphere: Theory, Experiments, and Applications; Academic Press: California, 2000.
21. http://www.epa.gov/ttnamti1/files/ambient/airtox/to-14ar.pdf, accessed in November 2015.
22. http://www.epa.gov/ttnamti1/files/ambient/airtox/to-15r.pdf, accessed in November 2015.
23. Coutts, A. M.; Beringer, J.; Tapper, N. J.; Atmos. Environ. 2007, 41, 51.
24. George, K.; Ziska, L. H.; Bunce, J. A.; Quebedeaux, B.; Atmos. Environ. 2007, 41, 7654.
25. Idso, S. B.; Idso, C. D.; Balling, R. C.; Atmos. Environ. 2002, 36, 1655.
26. h t t p : / / w w w . c i d a d e s . i b g e . g o v . b r / x t r a s / p e r f i l . php?lang=&codmun=330455&search =||infogr%E1ficos:-informa%E7%F5es-completas, accessed in November 2015. 27. http://www.denatran.gov.br/frota2013.htm, accessed in
November 2015.
28. Oliveira, R. L.; Loyola, J.; Minho, A. S.; Quiterio, S. L.; Azevedo, D. A.; Arbilla, G.; Bull. Environ. Contam. Toxicol.
2014, 93, 781.
29. http://tempo.cptec.inpe.br/aeroportos/pt accessed in November 2015.
30. Kelly, T. J.; Holdren, M. W.; Environ. Sci. Technol. 1995, 44, 2497.
32. Idso, C. D.; Idso, S. B.; Balling, R. C.; Atmos. Environ. 2001, 35, 995.
33. http://www.centroclima.coppe.ufrj.br/new2/ccpdf/inventario_ rj.1.pdf, accessed in November 2015.
34. Haiduc, I.; Beldean-Galea, M. S.; Variation of Greenhouse Gases in Urban Areas-Case Study: CO2, CO and CH4 in
Three Romanian Cities, Air Quality-Models and Applications; Popovic, D., ed.; ISBN: 978-953-307-307-1, InTech, 2011. Available from: http://www.intechopen.com/books/air-quality- models-and-applications/variation-of-greenhouse-gases-in- urban-areas-case-study-co2-co-and-ch4-in-three-romanian-cities accessed in November 2015.
35. Angelbratt, J.; Mellqvist, J.; Blumenstck, T.; Borsdorff, T.; Brohede, S.; Duchatelet, P.; Forster, F.; Hase, F.; Mahieu, E.; Murtagh, D.; Petersen, A. K.; Schneider, M.; Sussmann, R.; Urban, J.; Atmos. Chem. Phys. 2011, 11, 6167.
36. Dlugokencky, E. J.; Houweling, S.; Bruhwiler, L.; Masarie, K. A.; Lang, P. M.; Miller, J. B.; Tans, P. P.; Geophys. Res. Lett.
2003, 30, 1992.
37. Haszpra, L.; Barcza, Z.; Hidy, D.; Szilagyi, I.; Dlugokencky, E.; Tans, R.; Atmos. Environ. 2008, 42, 8707.
38. http://www.ipcc.ch/pdf/assessment-report/ar5/wg1/WG1AR5_ Chapter02_FINAL.pdf accessed in November 2015.
39. Pougy, N.; Martins, E.; Verdi, M.; de Oliveira, J. A.; Maurenza, D.; Amaro, R.; Martinelli, G.; Nat. Conservação
2014, 12, 170.
40. Freitas, S. R.; Neves, C. L.; Chernicharo, P.; Braz. J. Biol. 2006, 66, 975.
41. Richey, J. E.; Melack, J. M.; Aufdenkampe, A. K.; Ballester, V. M.; Hess, L. L.; Nature 2002, 416, 617.
42. Corrêa, S. M.; Arbilla, G.; Marques, M. R. C.; de Oliveira, K. M. P. G.; Atmos. Poll. Res. 2012, 3, 163.
43. Corrêa, S. M.; Arbilla, G.; Martins, E. M.; Quiterio, S. L.; Guimaraes, C. S.; Gatti, L. V.; Atmos. Environ. 2010, 44, 2302. 44. http://cdiac.ornl.gov/pns/current_ghg.html, accessed in
November 2015.
Submitted: September 1, 2015