*Correspondence: C. O. Rangel-Yagui. Departamento de Farmácia, Faculdade de Ciências Farmacêuticas, Universidade de São Paulo. Av. Prof. Lineu Prestes, 580 – Bloco 15 – 05508-950 – São Paulo, SP. E-mail: [email protected]
A
rti
Pharmaceutical Sciences vol. 46, n. 4, out./dez., 2010
A 2D-QSPR approach to predict blood-brain barrier penetration of
drugs acting on the central nervous system
Matheus Malta de Sá, Kerly Fernanda Mesquita Pasqualoto, Carlota de Oliveira Rangel-Yagui
*Department of Pharmacy, Faculty of Pharmaceutical Sciences, University of São Paulo
Drugs acting on the central nervous system (CNS) have to cross the blood-brain barrier (BBB) in order to perform their pharmacological actions. Passive BBB diffusion can be partially expressed by the blood/ brain partition coeficient (logBB). As the experimental evaluation of logBB is time and cost consuming, theoretical methods such as quantitative structure-property relationships (QSPR) can be useful to predict logBB values. In this study, a 2D-QSPR approach was applied to a set of 28 drugs acting on the CNS, using the logBB property as biological data. The best QSPR model [n = 21, r = 0.94 (r² = 0.88), s = 0.28, and Q² = 0.82] presented three molecular descriptors: calculated n-octanol/water partition coeficient (ClogP), polar surface area (PSA), and polarizability (α). Six out of the seven compounds from the test set were well predicted, which corresponds to good external predictability (85.7%). These indings can be helpful to guide future approaches regarding those molecular descriptors which must be considered for estimating the logBB property, and also for predicting the BBB crossing ability for molecules structurally related to the investigated set.
Uniterms: Two-dimensional quantitative structure-property relationships (2D-QSPR). Calculated
n-octanol/water partition coeficient (ClogP). Blood-brain barrier. Benzodiazepines.
Fármacos que atuam no sistema nervoso central (SNC) devem atravessar a barreira hematoencefálica (BHE) para exercerem suas ações farmacológicas. A difusão passiva através da BHE pode ser parcialmente expressa pelo coeiciente de partição entre os compartimentos encefálico e sanguíneo (logBB, brain/blood partition coeficient). Considerando-se que a avaliação experimental de logBB é dispendiosa e demorada, métodos teóricos como estudos das relações entre estrutura química e propriedade (QSPR, Quantitative Structure-Property Relationships) podem ser utilizados na previsão dos valores de logBB. Neste estudo, uma abordagem de QSPR-2D foi aplicada a um conjunto de 28 moléculas com ação central, usando logBB como propriedade biológica. O melhor modelo de QSPR [n = 21, r = 0,94 (r² = 0,88), s = 0,28 e
Q² = 0,82] apresentou três descritores moleculares: o coeiciente calculado de partição n-octanol/água (ClogP), área de superfície polar (PSA) e polarizabilidade (α). Seis dos sete compostos do conjunto de avaliação foram bem previstos pelo modelo, o que corresponde a um bom poder de previsão externa (85,7%). Os resultados obtidos podem auxiliar de forma relevante em estudos futuros, orientando quais descritores moleculares devem ser considerados para estimar logBB e prever a passagem através da BHE de moléculas estruturalmente relacionadas às do conjunto investigado.
Unitermos: Relações quantitativas bidimensionais entre estrutura química e propriedade (2D-QSPR). Coeiciente calculado de partição n-octanol/água (ClogP). Barreira hematoencefálica. Benzodiazepínicos.
INTRODUCTION
The distribution of many drugs to the brain is signii-cantly different from that occurring in other organs, owing
to the presence of the blood-brain barrier (BBB). This consists of a specialized system of capillary endothelial cells that protects the brain against harmful substances in the blood stream, while supplies this organ with the requi-red nutrients for its proper functions (Escuder-Gilabert et al., 2004).
Its endothelial cells have tight junctions, promoting a very high transendothelial resistance (1500-2000 Ωcm²), pre-venting paracellular passage of hydrophilic solutes (Misra et al., 2003). Furthermore, a number of neuroanatomical structures, including catabolic enzymes, eflux transpor-ters and astrocytes prolongations, provide a restricted diffusion of chemical compounds through the brain (Misra et al., 2003; Hitchcock, 2008; Habgood et al., 2000).
Passive diffusion through the BBB is the primary process of many therapeutic compounds’ translocation from blood to brain. This step is one of the most critical pharmacokinetic issues in the designing of drug candi-dates for action on the Central Nervous System (CNS). If the drug cannot cross the BBB, no biological effect in the CNS is observed. This penetration is also a concern in the development of other classes of drugs, for which penetration through the BBB could result in toxicity due to undesirable effects on nervous tissues (Li et al., 2005; Katritzky et al., 2006).
Although some drugs use transporters, most of them can enter the brain by passive diffusion through the en-dothelial cells. One of the main important drug properties governing passive diffusions is lipophilicity. In general, the more lipid soluble the molecule, the more easily it will move from the blood to the brain, crossing the endothelial cell membranes. Lipophilicity can be expressed by the n -octanol/water partition coeficient (logP), which represents the relative afinity of a molecule between organic and aqueous media (Misra et al., 2003; Habgood et al., 2000; Goodwin et al., 2005). Other important molecular featu-res, considering passive diffusion, include molecular size (with a cut-off value of 400-700 Da) and intermolecular interaction forces (which express the relative afinity to lipophilic or hydrophilic solvent) (Habgood et al., 2000; Misra et al., 2003; Iyer et al., 2002).
The relative afinity of a molecule between blood and brain can be expressed in terms of the blood/brain partition coeficient (logBB), according to Equation 1:
(1)
In Equation 1, Cbrain and Cblood are the equilibrium concentrations of a molecule in the brain and the blood, respectively (Katritzky et al., 2006). However, this ex-perimental determination is time and cost consuming, preventing extended applications. Therefore, computer-assisted drug design methodologies (CADD), such as quantitative structure-property and/or structure-activity relationship studies (QSPR and QSAR, respectively),
may help to estimate biological data, reducing synthetic steps, predicting pharmacokinetic and pharmacodynamic proiles, constituting an important tool in the design and development of new drugs and novel leads (Katritzky et al., 2006). A literature review reported several studies, carried out on a number of different chemical structures, and in which 2D and 3D QSPR models have been propo-sed to predict logBB values (Katritzky et al., 2006; Van Damme et al., 2008; Iyer et al., 2002; Konovalov et al., 2007; Subramanian et al., 2003; Zhao et al., 2007; Zhang et al., 2008;Narayanan et al., 2005). Some of these models show a correlation between logBB and some physicoche-mical parameters, such as molecular refractivity (MR), molecular volume (V), acid ionization constant (Ka and pKa), thermodynamic parameters (solvation energy, etc.), polar surface area (PSA), and others. (Chen et al., 2009; Clark, 1999). Nevertheless, easy interpretable mathemati-cal models, with good internal and external predictability, are still needed for some speciic drug classes. Against this background, in the present study a two-dimensional (2D) QSPR approach was applied to a set of 28 structurally similar molecules including benzodiazepines, tricyclic compounds and their metabolites, with CNS activity as antidepressant and neuroleptic, in order to build a QSPR model able to predict logBB values and also provide relevant indings about the BBB crossing ability of other compounds structurally related to the investigated set.
MATERIAL AND METHODS
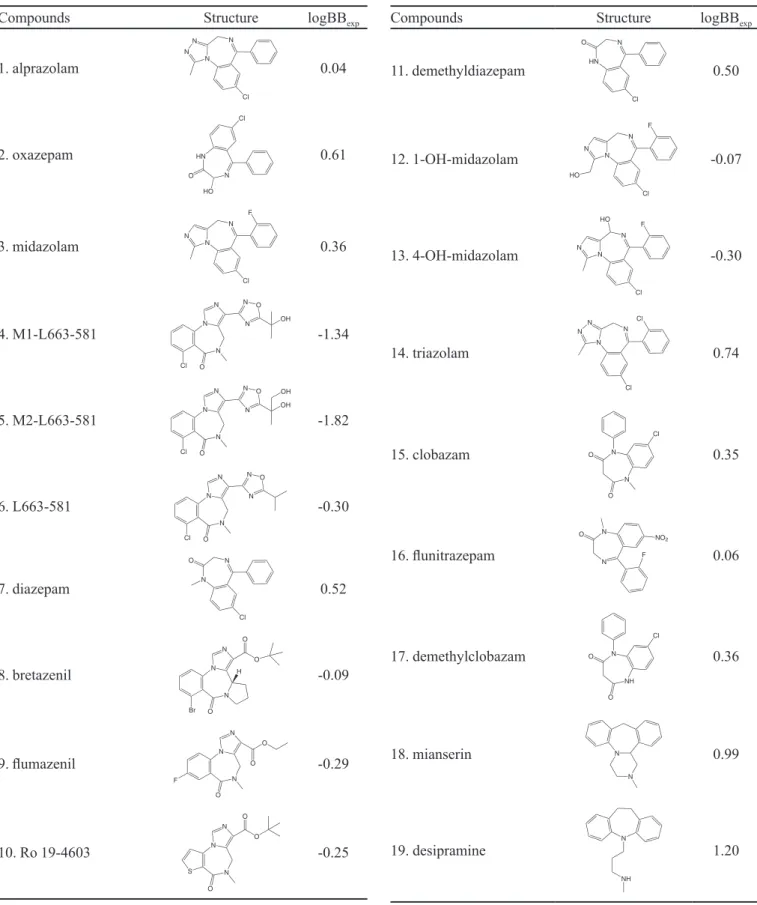
A set of 28 molecules, including benzodiazepines, tricyclic compounds and their metabolites, were selected from Katritzky et al. (Katritzky el al., 2006). Their structural similarity is based on the presence of an azepine or isosteric ring bound to at least one aromatic ring. The experimental logBB values were assessed using animal models and syn-thesized radio-labeled compounds. Often, this measure is based on the degree of BBB penetration, deined as the ratio of the steady-state molar concentration of the drug molecule (radio-labeled) in the brain and in the blood (Katritzky et al., 2006). The logBB values are given in Table 1, comprising the dependent variables of this QSPR analysis. The range of logBB values is from -1.82 to 1.20.
The molecules were randomly divided into two sets. The training set was composed of 21 compounds whereas seven compounds were used for the external validation (test set). The test set compounds were not included in the development of the 2D-QSPR models.
Compounds Structure logBBexp 1. alprazolam N N Cl N N 0.04
2. oxazepam HN
N Cl
HO O
0.61
3. midazolam N
N F Cl N 0.36 4. M1-L663-581 N N O Cl N N O N OH -1.34 5. M2-L663-581 N N O Cl N N O N OH OH -1.82 6. L663-581 N N O Cl N N O N -0.30 7. diazepam N N O Cl 0.52 8. bretazenil N N O H N Br O O -0.09 9. lumazenil N N O F N O O -0.29
10. Ro 19-4603
N N O S N O O -0.25
TABLE I - Chemical structures and logBB experimental values (logBBexp) found for training and test sets (Katritzky et al., 2006). The test set compounds are marked with an asterisk (*)
Compounds Structure logBBexp
11. demethyldiazepam N HN O Cl 0.50
12. 1-OH-midazolam N
N F Cl N HO -0.07
13. 4-OH-midazolam N
N F Cl N HO -0.30 14. triazolam N N Cl N N Cl 0.74 15. clobazam N N O O Cl 0.35
16. lunitrazepam N
N F NO2 O 0.06 17. demethylclobazam NH N O O Cl 0.36
18. mianserin N
N
0.99
19. desipramine N
NH
Compounds Structure logBBexp
20. amitriptyline
N
0.98
21. imipramine
N
N
0.83
22. carbamazepine* N
H2N
O
0.00
23. mirtazapine* N
N
N
0.53
24. N-demethyl desipramine*
N
H2N
1.06
TABLE I - Chemical structures and logBB experimental values (logBBexp) found for training and test sets (Katritzky et al., 2006). The test set compounds are marked with an asterisk (*) (cont.)
Compounds Structure logBBexp
25. ORG4428*
O
N
N
HO H 0.82
26. ORG5222*
O
H H
N Cl
1.03
27. ORG32104*
O
N
N
H
HO H 0.52
28. ORG30526*
O
H H
N
H Cl
0.39
crystallized structures of the drugs diazepam and imipra-mine were retrieved from the Protein Data Bank (PDB) (Bernstein et al., 1977) [entry codes 2bxf, resolution 2.95 Å (Ghuman et al., 2005); and 2q72, resolution 1.70 Å (Singh et al., 2007)] and used as the starting geometries to construct all benzodiazepines and tricyclic compounds, respectively. Each 3D-model had its geometry optimized by HyperChem 7.51, using MM+ force ield without any restriction (Allinger, 1977), followed by the AM1 se-miempirical quantum method (Dewar et al., 1985). Partial atomic charges were calculated using the AM1 semiempi-rical method, also implemented by the HyperChem 7.51 program (Hypercube Inc, 2003).
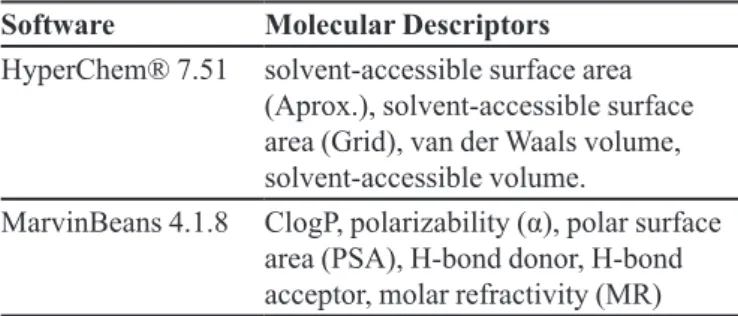
As mentioned above, the structures modeled were used to calculate the molecular descriptors or independent variables used in this study, employing HyperChem 7.51 (Hypercube Inc, 2003) and MarvinBeans 4.1.8 software (ChemAxon Ltd, 1998-2009) (see Table II).
A preliminary systematic search of the most
signii-TABLE II - Molecular descriptors calculated using HyperChem® 7.51 and MarvinBeans 4.1.8 software
Software Molecular Descriptors
HyperChem® 7.51 solvent-accessible surface area (Aprox.), solvent-accessible surface area (Grid), van der Waals volume, solvent-accessible volume.
MarvinBeans 4.1.8 ClogP, polarizability (α), polar surface area (PSA), H-bond donor, H-bond acceptor, molar refractivity (MR)
The selected descriptors were used to build the 2D-QSPR models employing multiple linear regression (MLR) and leave-one-out (LOO) cross-validation method, performed by BuildQSAR® 1.0.0 software (Oliveira, Gaudio, 2003). Due to the relatively small size of the trai-ning set (n = 21), the statistical restriction which imposes a limit from four up to ive observations (compounds) per descriptor or independent variable (Ferreira, 2002; Tava-res, 2004) were respected in this approach and a maximum of four molecular descriptors per model was considered.
Statistical measures of signiicance including the LOO cross-validation coeficient (Q2), linear regression
coeficient (r or r²), standard deviation (s), Fischer’s value (F) and standard predictive residual sum of squares value (sPRESS) were used to evaluate the robustness of the QSPR
models. Moreover, a linear cross-correlation matrix of the descriptors was computed to verify if the independent variables were correlated to one another or otherwise. Pairs of descriptors which are highly correlated (R ≈ 1) to one
another are deemed to provide nearly the same information to the model, while poorly correlated pairs of descriptors (R < 0.5) give distinct contribution to the model.
The differences between the experimental or ob-served (logBBexp) and calculated or predicted (logBBpred) properties are called residual values. In this study, the compounds of the training set for which the absolute re-sidual values exceeded two standard deviation (SD) from the mean of a model, were considered as outliers. This threshold corresponds to a signiicance level of ninety-ive percent (Ferreira et al., 1999).
As mentioned previously, the seven compounds of the test set were not included in the build of the QSPR models, but were used to validate the best QSPR model constructed from the training set, and to evaluate its pre-diction capacity. The predicted logBB value of each com-pound in the test set was calculated using the equation of the best model by substitution of the molecular descriptors’ calculated values. The absolute residual values should not be higher than one SD from the mean of the model, which corresponds to a signiicance level of ninety-nine percent.
RESULTS AND DISCUSSION
Molecular descriptor selection
The proper selection of molecular descriptors, i.e., those truly relevant in describing the studied property or biological activity, is a challenge in QSPR/QSAR studies, since the amount of information generated by the available software is sometimes enormous and hard to comprehend (van de Waterbeemd, Rose, 2008). In this study, the
cal-culated molecular descriptors were related to lipophilicity (ClogP), intrinsic properties, such as molecular size and shape [volume (V), surface area] and electronic, topologic and mixed parameters [polarizability (α), number of H-bond acceptor and donor sites, polar surface area (PSA) and molar refractivity (MR)]. The polar surface area (PSA) calculation is deined as the sum of the surface of all the polar atoms of the molecule, especially N and O, including H atoms. The estimation of topological polar surface area (TPSA) was based on the method described by Ertl, 2000 (Ertl et al., 2000). This method, implemented in MarvinBeans software (ChemAxon Ltd, 1998-2009), provides results which are practically identical to the 3D PSA, while the TPSA is ap-proximately 100-times faster. Thus, the 2D representation is an approximation of the 3D PSA (Ertl, 2007).
As described in the Material and Methods Section, the scatter plots of logBB versus each of the calculated molecular descriptors were employed as preliminary selection criterion (data not shown). The most relevant independent variables, which were used to generate the QSPR models, presented a good dispersion of the data related to the variability of the biological property. Linear and non-linear tendencies were both considered. Only the number of H-bond acceptor and donor sites did not provide a suitable dispersion of data considering the variability of the logBB values and were therefore not included in the generation of the QSPR models.
2D-QSPR models
All the best it models were linear given the ClogP values’ range was not larger than four logarithmic units. Thus, parabolic or bilinear functions were not considered (Patrick, 2008). The resulting 2D-QSPR models are listed below.
Model 1:
logBB = +0.47 (±0.11)ClogP – 0.94 (±0.30)
n = 21; r = 0.90 (r² = 0.81); s = 0.33; F = 80.04; Q2 = 0.74; sPRESS= 0.39
Model 2:
logBB = -0.02 (±0.01)PSA + 1.23 (±0.32)
n = 21; r = 0.89 (r² = 0.79); s = 0.35; F = 68.52; Q2 = 0.72; sPRESS = 0.40
Model 3:
logBB = +0.28 (±0.24)ClogP – 0.01 (±0.01)PSA – 0.03 (±1.13)
Model 4:
logBB = +0.24 (±0.22)ClogP – 0.05 (±0.04)α – 0.01 (±0.01)PSA + 1.76 (±1.92)
n = 21; r = 0.94 (r² = 0.88); s = 0.28; F = 39.74; Q2 = 0.82; sPRESS = 0.34
Model 5:
logBB = +0.21 (±0.22)ClogP – 0.01 (±0.01)PSA – 0.03 (±0.01)MR + 1.41 (±1.54)
n = 21; r = 0.94 (r² = 0.88); s = 0.28; F = 42.10; Q2 = 0.83; sPRESS = 0.33
All the models presented r values higher than 0.8, indicating well fitting models. Models 4 and 5 had the highest r values (0.94; r² = 0.88) and the lowest s values (0.28). However, the s value is better evaluated when the dependent variable’s standard deviation is also given, and should be smaller than the latter (Patrick, 2008). For logBB, speciically, the standard deviation is not currently reported (Abraham et al., 2006).
The highest F values were obtained from models 1 and 2 (80.04 and 68.52, respectively). It is noteworthy that the F value decreases as the number of descriptors in the model increases, indicating a substantial loss of statisti-cal signiicance. This is likely due to the total number of compounds in the training set (n = 21).
The internal predictability of a model is expressed by the LOO cross-validation correlation coeficient (Q²), which is a very important statistical measure of QSPR/ QSAR models. The Q2values for all models were higher
than 0.5. Models 4 and 5 presented the highest Q² values (0.82 and 0.83, respectively).
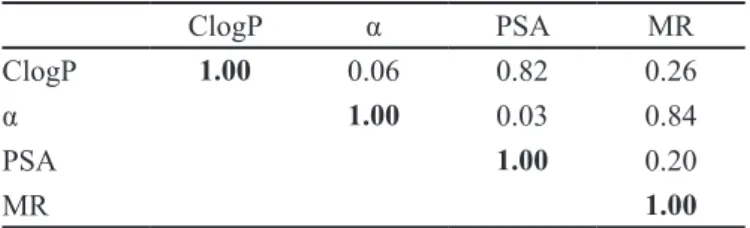
Taking into account the evaluation of all statistical parameters measured, models 4 and 5 were considered the best QSPR models. Both equations presented three independent variables, but model 4 has α instead of MR. These two descriptors are indeed related to each other, since MR can express both steric and electronic effects. Hence, a linear cross-correlation matrix of the descriptors of models 4 and 5 was computed, using BuildQSAR® 1.0.0, to verify if the independent variables were correlated to one another or otherwise (see Table III). As mentioned previously, pairs of descriptors that are highly correlated (R ≈ 1) to one another are deemed to provide nearly the
same information to the model, while poorly correlated pairs of descriptors (R < 0.5) give distinct contribution to the model.
According to the results presented in Table 3, ClogP and PSA are highly correlated (R = 0.82), meaning they provide almost the same information to both models. Ho-wever, this correlation value can be understood as a
mathe-matical artifact since the parameters are not biologically correlated (the former represents a lipophilic parameter, while the latter is a topological descriptor). Moreover, the models presenting both parameters proved to be sta-tistically more signiicant, indicating the importance of including ClogP and PSA in the same model. Furthermore, a previous study reported poor intercorrelation between these two data items (R = 0.299) (Ertl, 2007) reinforcing the mathematical artifact assumption. On the other hand, the MR and α presented a high correlation coeficient (R = 0.84) and are actually correlated. MR is a composite parameter that considers molecular volume and polariza-tion capacity, whereas α represents the relative tendency of a molecular charge distribution to be distorted from its normal shape by an external electric ield, which may be caused by the presence of an ion or dipole nearby (Ertl, 2007).
Therefore, models 4 and 5 have relevant indepen-dent variables describing the logBB property. The signs of the regression coeficients indicate the direction of the descriptors’ contribution to the biological property. A po-sitive sign can be interpreted as a favorable contribution to the biological property (ClogP) while a negative sign, as being unfavorable (PSA, α, MR).
Size and shape were not directly expressed in the 2D-QSPR models. Instead, some descriptors such as MR and PSA consider molecule size or shape in their calculation. Molecular refractivity (MR), as mentioned earlier, for example, considers both molecular volume (and indirectly size and shape) and molecule polarizabi-lity capabipolarizabi-lity (Patrick, 2008). Polar surface area (PSA) is another example which considers topological parameters, taking into account the number of polar atoms (N, O and H) and is indirectly related to the size of the molecule (Ertl, 2007).
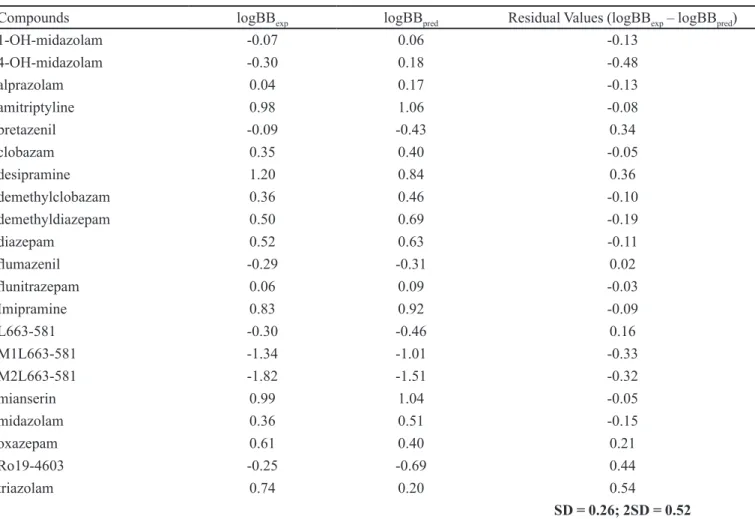
The internal predictability of models 4 and 5 was also explored as described in the Material and Methods section. The results are presented in Tables IV and V, respectively.
TABLE III - Linear cross-correlation matrix found for the molecular descriptors of models 4 and 5
ClogP α PSA MR
ClogP 1.00 0.06 0.82 0.26
α 1.00 0.03 0.84
PSA 1.00 0.20
MR 1.00
TABLE IV - Residual values found for model 4
Compounds logBBexp logBBpred Residual Values (logBBexp – logBBpred)
1-OH-midazolam -0.07 0.06 -0.13
4-OH-midazolam -0.30 0.18 -0.48
alprazolam 0.04 0.17 -0.13
amitriptyline 0.98 1.06 -0.08
bretazenil -0.09 -0.43 0.34
clobazam 0.35 0.40 -0.05
desipramine 1.20 0.84 0.36
demethylclobazam 0.36 0.46 -0.10
demethyldiazepam 0.50 0.69 -0.19
diazepam 0.52 0.63 -0.11
lumazenil -0.29 -0.31 0.02
lunitrazepam 0.06 0.09 -0.03
Imipramine 0.83 0.92 -0.09
L663-581 -0.30 -0.46 0.16
M1L663-581 -1.34 -1.01 -0.33
M2L663-581 -1.82 -1.51 -0.32
mianserin 0.99 1.04 -0.05
midazolam 0.36 0.51 -0.15
oxazepam 0.61 0.40 0.21
Ro19-4603 -0.25 -0.69 0.44
triazolam 0.74 0.20 0.54
SD = 0.26; 2SD = 0.52
Note: logBBexp = logBB experimental or observed; logBBpred = logBB predicted or calculated; SD = standard deviation; 2SD =
two standard deviations.
According to Tables 4 and 5, only model 4 proved capable of predicting logBB for all compounds of the training set. The absolute residual values did not exceed two SDs from the mean of model 4, meaning there were no outliers. Thus, model 4 was selected as the best 2D-QSPR model.
External Validation
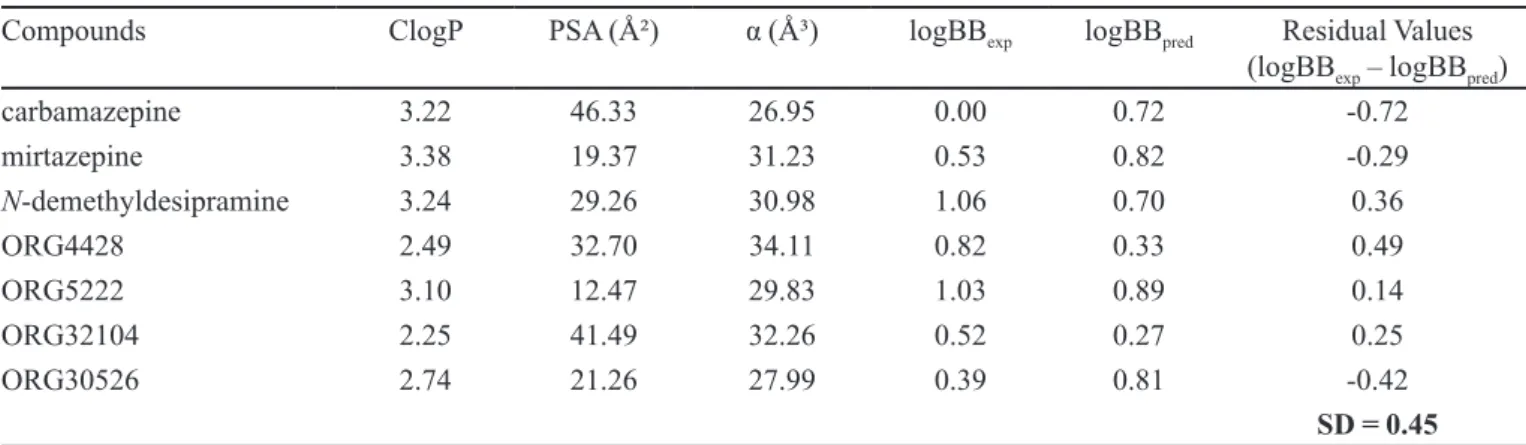
As outlined previously, model 4 was the best it model selected to describe logBB in terms of ClogP, PSA and α. The external validation was performed using the test set (n = 7). The calculated molecular descriptors pre-sent in model 4, the experimental and calculated logBB values, the respective residual values as well as the SD values obtained from the test set compounds, are listed in Table VI.
Six out of the seven test set compounds were well predicted by model 4, corresponding to good external
predictability (85.7 %). The residual value of the molecu-le ORG4428 was not considered statistically signiicant, since the difference was only in the second decimal. Moreover, the biological measurement of logBB is very susceptible to experimental errors.
TABLE V - Residual values found for model 5
Compounds logBBexp logBBpred Residual Values (logBBexp – logBBpred)
1-OH-midazolam -0.07 -1.65 1.58
4-OH-midazolam -0.30 -1.53 1.23
alprazolam 0.04 -1.53 1.57
amitriptyline 0.98 -0.71 1.69
bretazenil -0.09 -2.23 2.14
clobazam 0.35 -0.89 1.24
desipramine 1.20 -0.54 1.74
demethylclobazam 0.36 -0.83 1.19
demethyldiazepam 0.50 -0.63 1.13
diazepam 0.52 -0.68 1.20
lumazenil -0.29 -1.84 1.55
lunitrazepam 0.06 -1.31 1.37
imipramine 0.83 -0.53 1.36
L663-581 -0.30 -2.51 2.21
M1L663-581 -1.34 -3.04 1.70
M2L663-581 -1.82 -3.52 1.70
mianserin 0.99 -0.35 1.34
midazolam 0.36 -1.22 1.58
oxazepam 0.61 -0.92 1.53
Ro19-4603 -0.25 -2.26 2.01
triazolam 0.74 -1.57 2.31
SD = 0.35; 2SD = 0.69
Note: logBBexp = logBB experimental or observed; logBBpred = logBB predicted or calculated; SD = standard deviation; 2SD =
two standard deviations.
TABLE VI - Molecular descriptors of the best QSPR model (model 4), the experimental and calculated logBB values, the residual values and the respective SD value found for the test set compounds
Compounds ClogP PSA (Ų) α (ų) logBBexp logBBpred Residual Values
(logBBexp – logBBpred)
carbamazepine 3.22 46.33 26.95 0.00 0.72 -0.72
mirtazepine 3.38 19.37 31.23 0.53 0.82 -0.29
N-demethyldesipramine 3.24 29.26 30.98 1.06 0.70 0.36
ORG4428 2.49 32.70 34.11 0.82 0.33 0.49
ORG5222 3.10 12.47 29.83 1.03 0.89 0.14
ORG32104 2.25 41.49 32.26 0.52 0.27 0.25
ORG30526 2.74 21.26 27.99 0.39 0.81 -0.42
SD = 0.45 Note ClogP = calculated n-octanol/water partition coeficient; PSA = polar surface area; α = polarizability; logBBexp = logBB
experimental or observed; logBBpred = logBB predicted or calculated; SD = standard deviation.
CONCLUSION
The present study employed a set of 21 molecu-les to build 2D-QSPR models in order to predict BBB
and presented suitable internal predictability. The best it model (model 4) had three descriptors, ClogP, PSA and α, which are well-known parameters and strongly inluence BBB passive crossing. It is known that lipophilicity is a determining factor in drugs pharmacokinetics, inluencing biological membrane permeation. The ClogP contribution to the models was positive in all the cases, suggesting that lipophilic moieties, that increase this parameter, facilitate passive translocation. By contrast, polar moieties seem to restrict molecule entry to the CNS. Quantitatively, this behavior is expressed by PSA and α, which contribute negatively to BBB diffusion. Published data has described linear models to explain the passive crossing through the BBB. The lipophilic characteristic has been described as the main factor that drives the passive diffusion from the blood into the cells and, in this case, the crossing through the BBB. As stated previously, the literature also reports other important parameters that seem to be related to the blood-brain partition (logBB): capability of forming hydrogen bonds, molecular lexibility, ability to bind to the lipophilic membrane, acid ionization constant (Ka and pKa), thermodynamic parameters (solvation energy, etc.), molecular refractivity (MR), molecular volume (V), polar surface area (PSA) and other electronic and topologic pa-rameters. Nevertheless, the model presented in this study is comparable or better than other published 2D-QSAR BBB models and show similar descriptors used by other authors. (Norinder et al., 2002; Katritzky et al., 2006; van Damme et al., 2008; Iyer et al., 2002; Konovalov et al., 2007; Subramanian et al., 2003; Zhao et al., 2007; Zhang et al., 2008;Narayanan et al., 2005; Young et al., 1988; Abraham, 2004; Goodwin et al., 2005). These indings can help future decisions about which groups are favorable or otherwise for CNS entry by BBB permeation, based on the physicochemical properties evaluated here. Additionally, due to its excellent external predictability, the best it mo-del can be applied to predict the logBB property of other compounds with the same structural motif, such as an aze-pine or isosteric ring bound to at least one aromatic ring.
ACKNOWLEDGMENTS
The authors would like to thank FAPESP (State of São Paulo Research Foundation) and CNPq (National Council for Scientiic and Technological Development) for the inancial support, as well as the Molecular Mode-ling Laboratory – LAPEN, under the supervision of Prof. Elizabeth Igne Ferreira, for providing the resources that were used in this study.
REFERENCES
ABRAHAM, M.H.; IBRAHIM, A.; ZHAO, Y.; ACREE Jr., W.E. A data base for partition of volatile organic compounds and drugs from blood/plasma/serum to brain, and an LFER analysis of the data. J. Pharm. Sci., v.95, n.10, p.2091-2100, 2006.
ALLINGER, N.L. Conformational Analysis 130. MM2. A Hydrocarbon Force Field Utilizing V1 and V2 Torsional Terms. J.Am. Chem. Soc., v.99, n.25, p.8127-8137, 1977.
BERNSTEIN, F.C.; KOETZLE, T.F.; WILLIAMS, G.J.B.; MEYER, E.F. JR.; BRICE, M.D.; RODGERS, J.R.; KENNARD, O.; SHIMANOUCHI, T.; TASUMI, M. The Protein Data Bank: a computer-based archival file for macromolecular structures. J. Mol. Biol., v.112, n.3, p.535-542, 1977.
CHARNEY, D.S.; MIHIC, S.J.; HARRIS, R.A. Hypnotics and Sedatives. In: BRUNTON, L.L.; LAZO, J.S.; PARKER, K.L., (Eds.). Goodman & Gilman’s: The pharmacological basis of therapeutics. 11.ed. New York: McGraw-Hill, 2006. cap. 16. 1 CD-ROM.
CHEMAXON LTD. Marvinbeans Program Release 4.1.8. for Windows. Máramaros köz 3/a, 1037 Budapest, Hungary, 1998-2009. (Conjunto de dados. Ambiente operacional).
CHEN, Y.; ZHU, Q.J.; PAN, J.; YANG, Y.; WU, X.P. A prediction model for blood-brain barrier permeation and analysis on its parameter biologically. Comput. Methods Progr. Biomed., v.95, n.3, p.280-287, 2009.
CLARK, D.E. Rapid calculation of polar molecular surface area and its application to the prediction of transport phenomena. 2. Prediction of blood-brain barrier penetration. J. Pharm.
Sci., v.88, n.8, p.815-821, 1999.
DEWAR, M. J. S.; ZOEBISCH, E. G.; HEALY, E. F.; STEWART, J. J. P. AM1: A new general purpose quantum mechanical molecular model. J. Am. Chem. Soc., v.107, n.13, p.3902-3909, 1985.
ERTL, P. Polar Surface Area. In: MANNHOLD, R.; KUBINYI, H.; FOLKERS, G. (Eds.). Molecular drug properties. Weinheim: Wiley-VCH, 2007. v.37, cap.5, p.111-126.
ESCUDER-GILABERT, L.; MOLERO-MONFORT, M.; VILLANUEVA-CAMAÑAS, R.M.; SAGRADO, S.; MEDINA-HERNÁNDEZ, M.J. Potential of biopartitioning micellar chromatography as an in vitro technique for predicting drug penetration across the blood-brain barrier.
J. Chromatogr. B. Anal. Technol. Biomed. Life Sci., v.807, n.2, p.193-201, 2004.
FERREIRA, M.M.C. Multivariate QSAR. J. Braz. Chem. Soc., v.13, n.6, p.742-753, 2002.
FERREIRA, M.M.C.; ANTUNES, A.M.; MELGO, M.S.; VOLPE, P.L.O. Quimiometria I: calibração multivariada, um tutorial. Quim. Nova, v.22, n.5, p.724-731, 1999.
GHUMAN, J.; ZUNSZAIN, P.A.; PETITPAS, I.; BHATTACHARYA, A.A.; OTAGIRI, M.; CURRY, S. Structural basis of the drug-binding speciicity of human serum albumin. J.Mol. Biol., v.353, n.1, p.38-52, 2005.
GOODWIN, J.T.; CLARK, D.E.; In silico predictions of blood-brain barrier penetration: considerations to “keep in mind”.
J.Pharmacol. Exp. Ther., v.315, n.2, p.477-483, 2005.
HABGOOD, M.D.; BEGLEY, D.J.; ABBOTT, N.J. Determinants of passive Drug Entry into the Central Nervous System. Cell Mol. Neurobiol., v.20, n.2, p.231-253, 2000.
HITCHCOCK, S.A. Blood-brain barrier permeability considerations for CNS-targeted compound library design.
Curr. Opin. Chem. Biol., v.12, n.3, p.318-323, 2008.
HYPERCUBE INC. Hyperchem Program Release 7.51 for Windows, Gainesville, FL, 2002. (Conjunto de dados. Ambiente operacional).
INFOMETRIX, INC. Pirouette 3.11, Woodinville, WA, 1990-2003. (Conjunto de dados. Ambiente operacional).
IYER, M.; MISHRA, R.; HAN, Y.; HOPFINGER, A.J. Predicting blood-brain barrier partitioning of organic molecules using membrane-interaction QSAR analysis.
Pharm. Res., v.19, n.11, p.1611-1621, 2002.
KATRITZKY, A.R., KUANAR, M.; SLAVOV, S.; DOBCHEV, D.A.; FARA, D.C.; KARELSON, M.; ACREE, W.E.Jr.; SOLOV’EV, V.P.; VARNEK, A. Correlation of blood-brain penetration using structural descriptors. Bioorg. Med. Chem., v.14, n.14, p.4888-4917, 2006.
KONOVALOV, D.A.; COOMANS, D.; DECONINCK, E.; HEYDEN, Y.V.; Benchmarking of QSAR models for blood-brain barrier permeation. J. Chem. Inf. Model, v.47, n.4, p.1648-1656, 2007.
LI, H.; YAP, C.W.; UNG, C.Y.; XUE, Y.; CAO, Z.W.; CHEN, Y.Z. Effects of Selection of Molecular Descriptors on the Prediction of Blood-Brain Barrier Penetration and Nonpenetrating Agents by Statistical Learning Methods. J. Chem. Inf. Model, v.45, n.5, p.1376-1384, 2005.
MISRA, A.; GANESH, S.; SHAHIWALA, A.; SHAH, S.P. Drug delivery to the central nervous system: a review. J. Pharm. Pharm. Sci., v.6, n.2, p.252-273, 2003.
NARAYANAN, R.; GUNTURI, S.B. In silico ADME modelling: prediction models for blood-brain barrier permeability using a systematic variable selection method.
Bioorg. Med. Chem., v.13, n.8, p.3017-3028, 2005.
NORINDER, U.; HAEBERLEIN, M. Computational approaches to the prediction of the blood-brain distribution.
Adv. Drug Deliv. Rev. v.54, n.3, p.291-313, 2002.
OLIVEIRA, D.B.; GAUDIO, A.C. BuildQSAR: A new computer program for QSAR analysis. QSAR Comb.Sci., v.19, n.6, p.599-601, 2003.
PATRICK, G. L. An introduction to medicinal chemistry. 4.ed. Oxford University Press: Oxford, 2008. 752 p.
SINGH, S.K.; YAMASHITA, A.; GOUAUX, E. Antidepressant binding site in a bacterial homologue of neurotransmitter transporters. Nature, v.448, n.7156, p.952-956, 2007.
SUBRAMANIAN, G.; KITCHEN, D.B. Computational models to predict blood-brain barrier permeation and CNS activity.
J. Comput. Aided Mol. Des., v.17, n.10, p.643-664, 2003.
SUN, J.J.; XIE, L.; LIU, X.D. Transport of carbamazepine and drug interactions at blood-brain barrier. Acta Pharmacol. Sin., v.27, n.2, p.249-253, 2006.
TAVARES, L.C., QSAR: A Abordagem de Hansch. Quim. Nova, v.27, n.4, p.631-639, 2004.
VAN DE WATERBEEMD, H.; ROSE, S. Quantitative Approaches to Structure-Activity Relationship. In:
WERMUTH, C.G. (Ed.). The practice of medicinal
chemistry. 3.ed. New York: Academic Press, 2008. cap. 23, 29.
YOUNG, R.C.; MITCHELL, R.C.; BROWN, T.H.; GANELLIN, C.R.; GRIFFITHS, R.; JONES, M.; RANA, K.K.; SAUNDERS, D.; SMITH, I.R.; SORE, N.E. Development of a new physicochemical model for brain penetration and its application to the design of centrally acting H2 receptor histamine antagonists. J. Med. Chem., v.31, n.3, p.656-671, 1988.
ZHANG, L.; ZHU, H.; OPREA, T.I.; GOLBRAIKH, A.; TROPSHA, A. QSAR modeling of the blood-brain barrier permeability for diverse organic compounds. Pharm. Res., v.25, n.8, p.1902-1914, 2008.
ZHAO, Y.H.; ABRAHAM, M.H.; IBRAHIM, A.; FISH, P.V.; COLE, S.; LEWIS, M.L.; DE GROOT, M.J.; REYNOLDS, D.P. Predicting penetration across the blood-brain barrier from simple descriptors and fragmentation schemes. J. Chem. Inf. Model., v.47, n.1, p.170-175, 2007.
Received for publication on 02nd October 2009.