Sandra GarciaI
Mitti Ayako Hara KoyamaII Grupo de Estudos em
População, Sexualidade e Aids*
I Área de População e Sociedade. Centro Brasileiro de Análise e Planejamento. São Paulo, SP, Brasil
II Fundação Sistema Estadual de Análise de Dados. São Paulo, SP, Brasil
* (Study Group on Population, Sexuality and AIDS) members: Elza Berquó, Francisco Inácio Pinkusfeld Bastos, Ivan França Junior, Regina Barbosa, Sandra Garcia, Vera Paiva, Wilton Bussab.
Correspondence: Sandra Garcia
CEBRAP – Centro Brasileiro de Análise e Planejamento
R. Morgado de Mateus, 615 04015-902 São Paulo, SP, Brasil E-mail: [email protected] Received: 9/19/2007
Reviewed: 2/13/2008 Approved: 3/5/2008
Stigma, discrimination and
HIV/AIDS in the Brazilian
context, 1998 and 2005
ABSTRACT
OBJECTIVE: To identify discriminatory attitudes in two moments of the Brazilian HIV/AIDS epidemic, as well as the occurrence of possible changes.
METHODS: The Intention of Discrimination Index was obtained by scoring 1 for discriminatory situations or 0, when the opposite was the case. Intention of discrimination ranges were established by means of the clustering technique, and made compatible between the 1998 and 2005 surveys. Mean comparisons, chi-square test and ordered logit adjusted regression models were used to verify association between the index and socio-demographic variables.
RESULTS: Between the 1998 and 2005 surveys, there was a statistically signifi cant reduction in the proportion of people who answered “yes” to anti-HIV test’s being mandatory in the following cases: admission for employment, before getting married, when joining the military service, drug users, foreigners entering the country, sex professionals, and for all the people. To have lower level of education, to be female, to live in the North/Northeast regions of Brazil, and to be aged over 45 years are factors associated with higher intention of discrimination level.
CONCLUSIONS: The growth of intention of discrimination shows that information about ways of AIDS transmission and non-transmission still needs to be better planned and promoted, especially among populations that have lower level of education, live in the North/Northeast regions, are female and aged over 45 years.
DESCRIPTORS: Acquired Immunodefi ciency Syndrome. Stigma. Prejudice. Health Knowledge, Attitudes, Practice. Population Studies in Public Health. Brazil. Cross-sectional studies. Brazil.
INTRODUCTION
Stigma and discrimination associated with HIV/AIDS may reduce/hinder one’s search for a test, due to fear of the results, as well as the search for adequate treatment in health services after confi rmation of positive serology.8-10
In Brazil, population surveys have enabled the assessment of some discrimina-tory opinions in relation to HIV, and also the magnitude of this problem.
Usual stigma defi nitionsa somewhat express the strength of the meanings that have been attributed to stigma as regards people affected by the HIV/AIDS epidemic.
Throughout history, other diseases have been stigma-tized, such as the Black Death in the 14th century and
the cholera in the 19th century. However, the nature of
the AIDS epidemic, its dynamics, reach, specifi c char-acteristics, and moral issues involved pose challenges to the fi eld of knowledge and intervention. This, in its turn, requires quick and adequate responses with an effective impact on the design of strategies to fi ght stigma and its consequences.
According to Mann (1987), cited by Parker & Agleton,a stigma and discrimination characterize the third phase of the AIDS epidemic and constitute “an issue which is as important for global AIDS as the disease itself”. AIDS stigmatization followed the appearance of the fi rst cases of this disease in the 1980’s, due to its asso-ciation with specifi c population groups that were more affected in the beginning (men who had sex with other men, drug users and sex workers), as well as with the image of a deadly, terrifying disease, which was created with the support of the media. Despite public campaigns to clarify ways of AIDS transmission and the revelation of seropositivity by public fi gures, AIDS/HIV stigma remains in distinct ways throughout the world.7,10,a,b
Even by acknowledging stigma as a marker of indi-vidual and social differences, this does not mean a fi xed attribute, but rather a social and cultural construction, thus historical and changeable, which establishes rela-tionships that belittle others. In this sense, it is inserted into socially constructed contexts and processes.b
Many of the harmful consequences of the stigmatization of people and/or specifi c groups involve discrimination in public places and private institutions, generating hostility, segregation, exclusion and/or self-exclusion of those who have their serology revealed. Even though the stigma and epidemic are a worldwide concern, there are specifi c, contextualized forms of discrimi-natory manifestations of an individual or collective nature.1-3,6,10,11,b In some contexts, this discrimination
is refl ected in laws that deal with mandatory testing for specifi c populations, the so-called risk groups. In other situations, there are laws that intend to limit the fl ow of seropositive people through the application of immigration laws.b Coercive measures adopted by
some countries, such as the mandatory notifi cation by those who are infected, directly affect people’s level of vulnerability, thus contributing to further reinforce stigma and discrimination.
AIDS stigma overshadows previous stigmas associated with different social groups, such as the homosexuals,
a Parker R, Agleton P. Estigma, discriminação e AIDS, Rio de Janeiro: Associação Brasileira Interdisciplinar de AIDS; 2001. (Coleção ABIA, Cidadania e Direitos, 1)
b Cogan J, Herek G. Stigma. In: The body: the complete HIV/Aids resource. 1998. Available from : http://wwww.thebody.com/encyclo/stigma.html [Cited 2007 Nov 11].
c Research coordinated by Centro Brasileiro de Análise e Planejamento (Cebrap) and Ministério da Saúde.
d Berquó E, coordenador. In: Comportamento sexual da população brasileira e percepções do HIV/AIDS. Brasília (DF): Ministério da Saúde, Secretaria de Políticas de Saúde, Coordenação Nacional DST e Aids; 2000. (Série avaliação, 4).
sex workers and drug users, evoking multiple mean-ings. These concepts and pre-conceived meanings are part of the cultural and social matrix that creates differences and hierarchies and also legitimizes social inequality structures. Pre-existing stigmas establish an association between AIDS and homosexuality, prostitu-tion and sexual deviaprostitu-tion, markers that still exist in the stigmatization process.b
Some studies1,11 have pointed out that, regardless of
the differences concerning the populations affected, subgroups or the population in general, there is little distinction in the ways stigma is manifested. In this sense, the universalization of stigma and discrimina-tion in different socioeconomic and cultural contexts has been observed.
When analyzing what Brazilians think about living with people with HIV, tests for specifi c population groups and abortion for seropositive pregnant women being mandatory, there is the possibility to explore the degree of intention of discrimination against people with HIV/AIDS in both surveys mentioned.
The present article aimed to identify the prevalence of discriminatory attitudes in two moments of the Brazil-ian HIV/AIDS epidemic and the possible changes that occurred.
METHODS
Data analyzed refer to the fi ndings from the survey en-titled “Sexual Behavior and Perceptions on HIV/AIDS by the Brazilian Population”, conducted in 2005,c and
compared to a similar survey conducted in 1998.d The
1998 surveyd covered 24 Brazilian states (except for
To-cantins and Roraima) and the Federal District, totaling a sample of 3,600 people who answered a questionnaire with 204 questions.
In 2005, a second survey was conducted. A total of four geographic areas were established, corresponding to groups of states per regions: North and Northeast; Central-West and Southeast, except for São Paulo; South; and the state of São Paulo. The target-population for research consisted of all the residents, aged between 16 and 65 years, from urban areas in micro-regions that had over 100,000 inhabitants by the year 2000.
Stratifi ed multiple-stage sampling was used, with a methodology described in Bussab4 (2007). Sample
regions. For each individual randomly selected in a household, a questionnaire containing 237 questions divided into 13 sections was applied. A total of 13 questions about behavior associated with prejudice and discrimination against HIV/AIDS were asked.
Simple descriptive analyses were performed, and stan-dard error for numeric variables and frequencies for cat-egory variables were presented. Chi-square tests which took into account the complex structure of the sample design were used to compare the distributions of cat-egory variables between years. A discrimination score was subsequently proposed from the items on Table 1, whose consistency was assessed using Cronbach’s Alpha coeffi cient. The intention of discrimination index (IDI) was created by scoring 1 for responses considered to be discriminatory, and 0 for not discriminatory. In-dividuals who answered “I do not know” or those who refused to answer were excluded from the study. The “Yes” or “I completely/partly agree” responses were considered discriminatory in questions 1 to 11. For questions 12 and 13, the “No” or “I completely/partly disagree” responses were considered discriminatory.
To measure score reliability, Cronbach’s alpha values were calculated for 1998 and 2005 for the 13 items, resulting in 0.458 and 0.585 for 1998 and 2005, re-spectively. Analyses revealed nine items with accept-able levels of reliability (0.748 in 1998 and 0.808 in 2005). Thus, the intention of discrimination index was comprised of nine items about anti-HIV test’s being mandatory (1 to 9). Items 10 to 13, which were not included in the index, were analyzed separately. The IDI varied from zero to nine points.
IDI groups were generated by cluster analysis using both periods simultaneously. The algorithm used in cluster analysis was the k-means. The six fi nal groups were determined using evaluating gains in homogeneity within the groups, according to the increase in the num-ber of classes (reduction in the sum of squares within groups). Groups 1 to 6 correspond, respectively, to respondents whose IDI values were: 0 to 1 point (group with lowest IDI); 2 to 3 points; 4 points; 5 points; 6 to 7 points; and 8 to 9 points (group with highest IDI).
To establish associations between these groups and the independent variables, ordered logit model was performed,12 which corresponds to a generalization of
logistic regression for ordered polytomic responses. For each year, ordered logit models were adjusted to verify associations with several independent variables.
According to Wooldridge12 (2002), ordered logit enables
the construction of a model where each individual can be classifi ed into one of the groups of intention of discrimination (resulting from the cluster analysis), according to their level of prejudice (latent variable), and depends on their socio-demographic profi le or HIV-related items. In each ordered logit model, in addition
to estimated coeffi cients, discrimination thresholds were shown. The t1 < t2 <... < t5 thresholds defi ne,
on the latent variable scale, the class range limits of degree of discrimination for the baseline group. Thus, an individual from the baseline group with a degree of discrimination lower than t1 is classifi ed as belonging
to group 1, that of lowest discrimination. On the other hand, that with a degree above the t5 threshold would tend to be classifi ed in the group with highest intention of discrimination. For the groups that did not form the basal group, the thresholds were adjusted according to their profi le.
The method adopted for the selection of variables in the model was the backward elimination method, which consists in initially incorporating all independent variables, eliminating, at each step, the non-signifi cant variables at the 5% level. However, the sex and ethnic group variables were kept in the model as control variables, regardless of the signifi cances obtained. Models were constructed in an independent manner for each year.
The Stata statistical software was used to adjust the models, based on the information from the sample design structure. A level of signifi cance of 5% was considered for statistical tests.
The project of the survey “Comportamento Sexual e Percepções da População Brasileira Sobre HIV/Aids” was approved by the Ethics Committee of Faculdade de Saúde Pública of Universidade de São Paulo.
RESULTS
Table 2 shows a statistically signifi cant reduction in the percentage of people who, between 1998 and 2005, answered “Yes” to the AIDS test being mandatory for the following cases: admission for employment, before getting married, when joining the Army, drug users, foreigners entering the country, and sex workers. On the other hand, changes in the pattern of responses between 1998 and 2005 were not found in the following cases: before hospitalizations and among pregnant women. A high level of agreement for tests being mandatory in the case of sex workers, drug users and pregnant women could be verifi ed in both periods (>90%).
In relation to the agreement of the item “pregnant women should have an abortion”, a reduction from 45.2% in 1998 to 21.9% in 2005 was observed.
Table 3 shows the means of the intention of discrimi-nation index, where the tendency of reduction of this score in 2005 in relation to 1998 stands out.
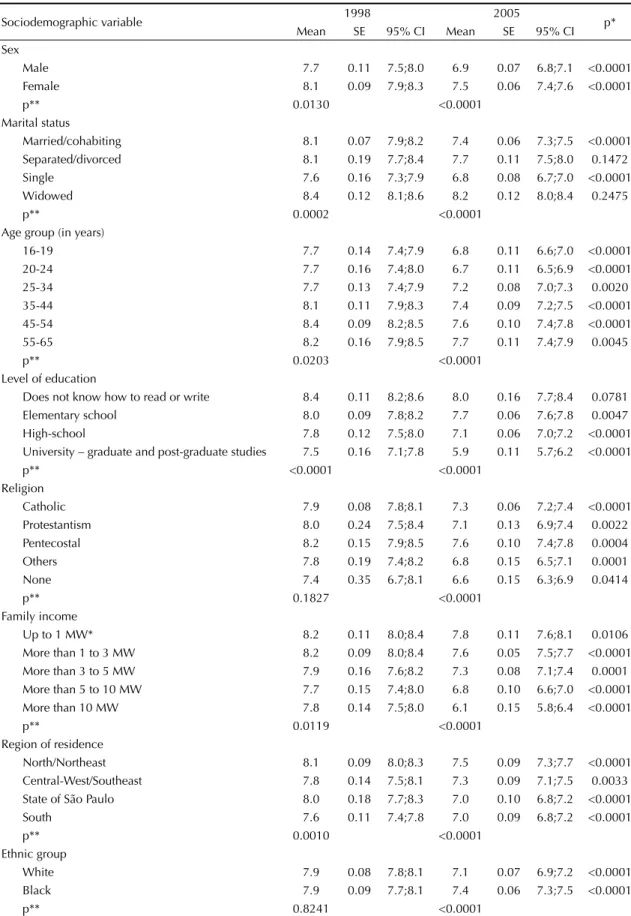
On Table 4, a decrease in the means of indices between 1998 and 2005 was observed, except among those who were separated/divorced or widowed, and those who did not know how to read or write.
In the 1998 survey edition, there were no differences among the means of intention of discrimination indices, regardless of one having a religion or what religion that was. Conversely, in the 2005 survey fi ndings, Pente-costals showed means that were above those of people who had a different religion or no religion (Table 4). In terms of level of education, a gradual decrease in mean IDI scores both in 1998 and 2005 was observed.
In relation to marital status in 1998, only those who were single showed patterns that were distinct from the remaining ones, with the lowest mean of IDI. In 2005, widowed people showed the highest means of IDI, followed by those who were separated/divorced, married/cohabiting, and lowest values were found among single people.
By analyzing scores per age group, in 1998, the 16-34-year age group showed means of IDI below the 35-year-or-older age group. In 2005, individuals within the 16-24-year age group showed means below those from other age groups, which had similar patterns.
In 1998, people from the North/Northeast regions showed means of IDI above those from people living in the South. In 2005, a similar situation was found between these two regions, in addition to a difference between the state of São Paulo and the North/Northeast regions.
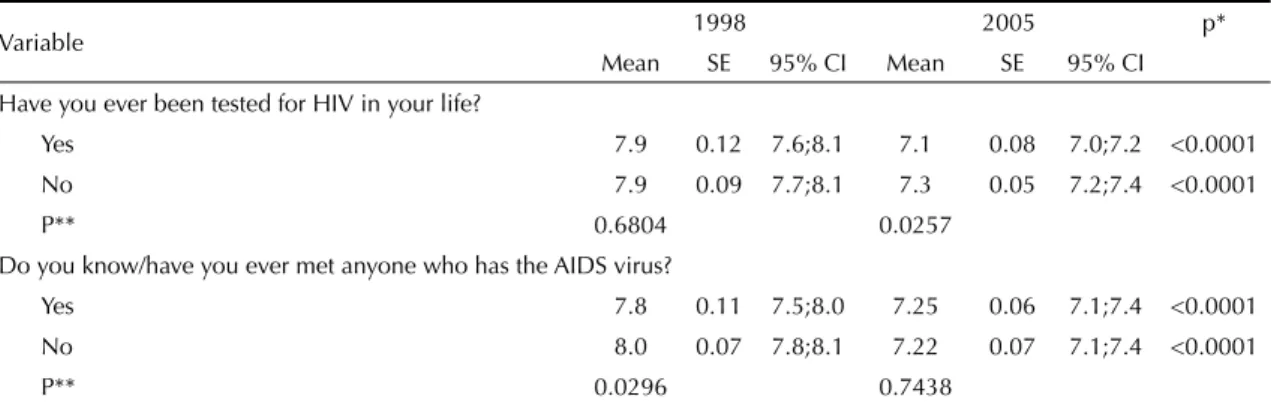
On Table 5, the means of IDI referring to the questions “Have you ever been tested for HIV in your life?” and “Do you know/have you met anyone who has the AIDS virus?” are shown, as well as a hypothetical situation for male respondents to choose from – “If your wife or female partner were pregnant and tests pointed to her having the AIDS virus, which of the following would you advise her to do?” – and the question “Do you agree that pregnant women with the AIDS virus should have an abortion?”.
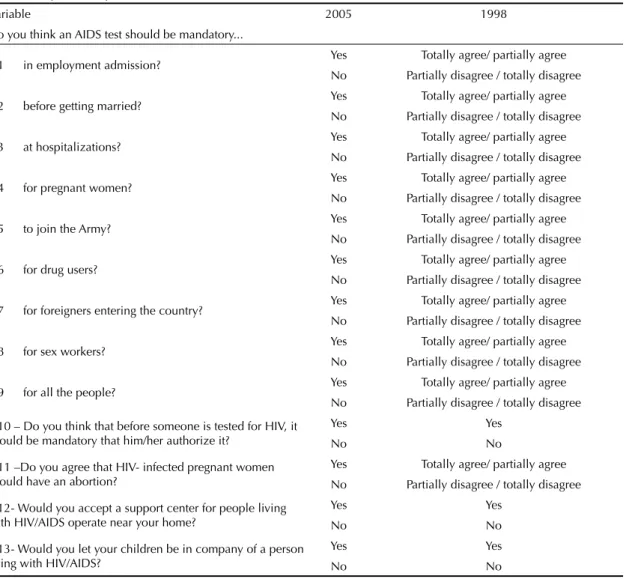
Table 1. Comparable dependent variables between 1998 and 2005.
Variable 2005 1998
Do you think an AIDS test should be mandatory...
D1 in employment admission? Yes Totally agree/ partially agree
No Partially disagree / totally disagree
D2 before getting married? Yes Totally agree/ partially agree
No Partially disagree / totally disagree
D3 at hospitalizations? Yes Totally agree/ partially agree
No Partially disagree / totally disagree
D4 for pregnant women? Yes Totally agree/ partially agree
No Partially disagree / totally disagree
D5 to join the Army? Yes Totally agree/ partially agree
No Partially disagree / totally disagree
D6 for drug users? Yes Totally agree/ partially agree
No Partially disagree / totally disagree
D7 for foreigners entering the country? Yes Totally agree/ partially agree
No Partially disagree / totally disagree
D8 for sex workers? Yes Totally agree/ partially agree
No Partially disagree / totally disagree
D9 for all the people? Yes Totally agree/ partially agree
No Partially disagree / totally disagree
D10 – Do you think that before someone is tested for HIV, it should be mandatory that him/her authorize it?
Yes Yes
No No
D11 –Do you agree that HIV- infected pregnant women should have an abortion?
Yes Totally agree/ partially agree
No Partially disagree / totally disagree
D12- Would you accept a support center for people living with HIV/AIDS operate near your home?
Yes Yes
No No
D13- Would you let your children be in company of a person living with HIV/AIDS?
Yes Yes
Table 2. Distribution of the dependent variables mentioned. Brazil, 1998 and 2005.
Variable 1998 2005
Frequency % Frequency %
Should the AIDS test be mandatory in the case of admission for employment?
Yes 2,171 65.9 2.835 57.3
No 1,126 34.1 2.114 42.7
Total 3,296 100.0 4.949 100.0
Does not know/
Did not answer 28 91
Total 3,324 100,0 5,040 100.0
p* <0.001
Should the AIDS test be mandatory before getting married?
Yes 3,013 91.5 4.009 79.5
No 281 8.5 975 19.3
Total 3,294 100.0 4.983 98.9
Does not know/
Did not answer 30 57 1.1
Total 3,324 5,040 100.0
p* <0.001
The AIDS test should be mandatory before hospitalizations?
Yes 2,824 85.4 4.077 82.1
No 483 14.6 889 17.9
Total 3,307 100.0 4.967 100.0
Does not know/
Did not answer 17 73
Total 3,324 5,040
p* 0.077
The AIDS test should be mandatory for pregnant women?
Yes 3,107 94.3 4.642 92.8
No 186 5.7 361 7.2
Total 3,294 100.0 5.003 100.0
Does not know/
Did not answer 30 37
Total 3,324 5,040
p* 0.092
The AIDS test should be mandatory to join the Army?
Yes 2,817 85.9 3.719 75.5
No 462 14.1 1.210 24.5
Total 3,279 100.0 4.929 100.0
Does not know/
Did not answer 45 111
Total 3,324 5,040
p* <0.001
The AIDS test should be mandatory for drug users?
Yes 3,167 95.8 4.632 92.9
No 139 4.2 353 7.1
Total 3,307 100.0 4.984 100.0
Does not know/
Did not answer 18 56
Total 3,324 5,040
p* 0.048
To be continued
Continuation Table 2
Variable Frequency1998 % Frequency2005 %
The AIDS test should be mandatory for foreigners entering the country?
Yes 2,918 87.8 3.933 78.0
No 375 11.3 1.012 20.1
Total 3,293 99.1 4.945 98.1
Does not know/
Did not answer 31 0.9 95 1.9
Total 3,324 100,0 5,040 100.0
p* <0.001
The AIDS test should be mandatory for sex workers?
Yes 3,240 97.8 4.768 95.3
No 74 2.2 237 4.7
Total 3,314 100.0 5.005 100.0
Does not know/
Did not answer 10 35
Total 3,324 5,040
p* 0.002
The AIDS test should be mandatory for all the people?
Yes 2,749 83.8 3.246 65.0
No 530 16.2 1.750 35.0
Total 3,278 100.0 4.996 100.0
Does not know/
Did not answer 46 44
Total 3,324 5,040
p* <0.001
Before someone is tested for HIV, should it be mandatory for him/her to authorize this test?
Yes 2,405 74.2 3.685 74.5
No 836 25.8 1.261 25.5
Total 3,241 100.0 4.947 100.0
Does not know/
Did not answer 83 93
Total 3,324 5,040
p* 0.885
Do you agree that pregnant women with the AIDS virus should have an abortion?
Yes 1,401 45.2 1.042 21.9
No 1,702 54.8 3.713 78.1
Total 3,103 100.0 4.755 100.0
Does not know/
Did not answer 222 285
Total 3,324 5,040
p* <0.001
Would you let your children be in the company of someone living with HIV/AIDS?
Yes 1,128 37.2 1.760 36.8
No 1,906 62.8 3.021 63.2
Total 3,034 100.0 4.781 100.0
Does not know/
Did not answer 290 259
Total 3.324 5,040
p* 0.867
Would you let a support center for people with AIDS operate near your home?
Yes 2,294 71.9 3.707 75.6
No 896 28.1 1.199 24.4
Total 3,190 100.0 4.905 100.0
Does not know/
Did not answer 134 135
Total 3,324 5,040
p* 0.113
As regards responses to the items “Have you ever been tested for HIV in your life?” and “Do you know/have you met anyone who has the AIDS virus?”, shown on Table 5, a reduction in the means of IDI scores between the two periods of analysis, both for “Yes” and “No” responses, was observed.
It was also verifi ed that people who, in 2005, stated having had the anti-HIV test done sometime in their lives showed a lower mean of intention of discrimina-tion index than that from people who had never been tested. In 1998, differences between these two groups were not detected.
In relation to the question “Do you know/have you met anyone who has the AIDS virus?”, people who answered “Yes” in 1998 showed a mean below that from those who answered “No”. However, in 2005, there was no difference between both groups.
On the other hand, for the question “If your wife or female partner were pregnant and tests pointed to her having the AIDS virus, which of the following would you advise her to do?”, differences in means between 1998 and 2005 were not detected for the following responses: “Would have an abortion”, “Would have an abortion and tubal ligation after delivery” and “Would consult a doctor about tubal ligation”; whereas, a decrease in the mean of IDI was verifi ed among the remaining responses. In this same question, by group-ing the responses in “Decide” (Would let the pregnancy continue; Would let the pregnancy continue and have tubal ligation performed after delivery; Would have an abortion; Would have an abortion and tubal liga-tion performed after delivery) and “Does not decide” (Would consult a doctor about abortion or tubal liga-tion), there were no differences in degree of intention both in 1998 and 2005.
According to the survey, in 1998, the mean of IDI of those who answered “Yes” to the question “Do you agree that pregnant women with the AIDS virus should have an abortion?” was above that of those who answered “No”. Likewise, in 2005, the mean of IDI for people who answered “Yes” was found to be above that of people who answered “No”. However, the mean IDI decreased between the two periods, among both the people who answered “Yes” and those who answered “No”.
Strong asymmetry in the IDI distribution was found, suggesting improper use of the linear regression model to establish an association between the IDI and the inde-pendent variables, and thus emphasizing the fact that this score shows only small values in the 0 to 9 interval.
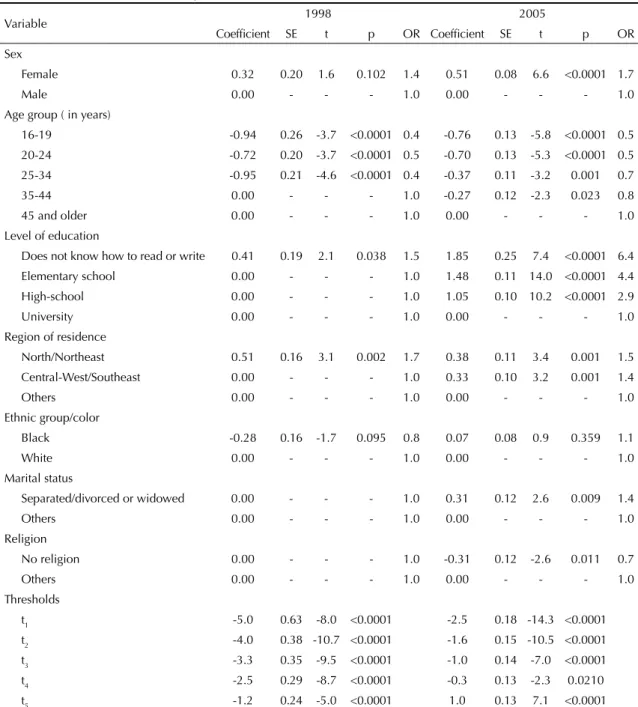
On Table 6, the results from the ordered logit models adjusted for the years 1998 and 2005 are shown. Cat-egories of a variable with similar coeffi cients were grouped to facilitate interpretation and improve preci-sion. Interpretations for each variable were performed, keeping the characteristics of the remaining variables under control.
In the 1998 model, associations with age group, level of education and region of residence were observed. No statistically signifi cant associations in relation to religion, marital status, sex and ethnic group were found. However, the two last variables were kept in the model as control variables.
People in the 35-44, 45-54, and 55-65-year age groups were grouped in only one category (basal) once they showed similar patterns. Similarly, the Central-West/ Southeast, South and the state of São Paulo regions were grouped in the same basal group; whereas high-school and university formed the basal group for level of education. The categories “male” and “ethnic group/ white color” were considered the basal groups for sex and ethnic group, respectively.
Younger people (up to 34 years) showed lower intention of discrimination than people above 35 years of age, ceteris paribus. In terms of likelihood, people between 16 and 19 years were 61% less likely to show intention of discrimination than those from other age groups.
In terms of level of education, people who either did not know how to read or write or had completed up to elementary school were 50% more likely to show higher intention of discrimination than those with higher level of education, when keeping the remaining characteris-tics under control. As regards the region of residence,
Table 3. Mean, standard-error, confi dence interval of the intention of discrimination index in relation to people with HIV/AIDS per year. Brazil, 1998 and 2005.
Year Mean Standard-error 95% CI Cases (pondered) Cases (not pondered)
1998 7.9 0.08 7.8;8.1 3,194 3,167
2005 7.2 0.05 7.1;7.3 4,699 4,685
Total 7.5 0.05 7.4;7.6 7,893 7,852
p* <0.0001
* Descriptive level of the comparison test of means between 1998 and 2005
Figure. Diagram with ordered logit thresholds.
t1 t2 t3 t4 t5
Table 4. Mean, standard-error (SE), confi dence interval (CI) of the intention of discrimination index, according to sociodemographic variables. Brazil, 1998 and 2005.
Sociodemographic variable 1998 2005 p*
Mean SE 95% CI Mean SE 95% CI
Sex
Male 7.7 0.11 7.5;8.0 6.9 0.07 6.8;7.1 <0.0001
Female 8.1 0.09 7.9;8.3 7.5 0.06 7.4;7.6 <0.0001
p** 0.0130 <0.0001
Marital status
Married/cohabiting 8.1 0.07 7.9;8.2 7.4 0.06 7.3;7.5 <0.0001
Separated/divorced 8.1 0.19 7.7;8.4 7.7 0.11 7.5;8.0 0.1472
Single 7.6 0.16 7.3;7.9 6.8 0.08 6.7;7.0 <0.0001
Widowed 8.4 0.12 8.1;8.6 8.2 0.12 8.0;8.4 0.2475
p** 0.0002 <0.0001
Age group (in years)
16-19 7.7 0.14 7.4;7.9 6.8 0.11 6.6;7.0 <0.0001
20-24 7.7 0.16 7.4;8.0 6.7 0.11 6.5;6.9 <0.0001
25-34 7.7 0.13 7.4;7.9 7.2 0.08 7.0;7.3 0.0020
35-44 8.1 0.11 7.9;8.3 7.4 0.09 7.2;7.5 <0.0001
45-54 8.4 0.09 8.2;8.5 7.6 0.10 7.4;7.8 <0.0001
55-65 8.2 0.16 7.9;8.5 7.7 0.11 7.4;7.9 0.0045
p** 0.0203 <0.0001
Level of education
Does not know how to read or write 8.4 0.11 8.2;8.6 8.0 0.16 7.7;8.4 0.0781
Elementary school 8.0 0.09 7.8;8.2 7.7 0.06 7.6;7.8 0.0047
High-school 7.8 0.12 7.5;8.0 7.1 0.06 7.0;7.2 <0.0001
University – graduate and post-graduate studies 7.5 0.16 7.1;7.8 5.9 0.11 5.7;6.2 <0.0001
p** <0.0001 <0.0001
Religion
Catholic 7.9 0.08 7.8;8.1 7.3 0.06 7.2;7.4 <0.0001
Protestantism 8.0 0.24 7.5;8.4 7.1 0.13 6.9;7.4 0.0022
Pentecostal 8.2 0.15 7.9;8.5 7.6 0.10 7.4;7.8 0.0004
Others 7.8 0.19 7.4;8.2 6.8 0.15 6.5;7.1 0.0001
None 7.4 0.35 6.7;8.1 6.6 0.15 6.3;6.9 0.0414
p** 0.1827 <0.0001
Family income
Up to 1 MW* 8.2 0.11 8.0;8.4 7.8 0.11 7.6;8.1 0.0106
More than 1 to 3 MW 8.2 0.09 8.0;8.4 7.6 0.05 7.5;7.7 <0.0001
More than 3 to 5 MW 7.9 0.16 7.6;8.2 7.3 0.08 7.1;7.4 0.0001
More than 5 to 10 MW 7.7 0.15 7.4;8.0 6.8 0.10 6.6;7.0 <0.0001
More than 10 MW 7.8 0.14 7.5;8.0 6.1 0.15 5.8;6.4 <0.0001
p** 0.0119 <0.0001
Region of residence
North/Northeast 8.1 0.09 8.0;8.3 7.5 0.09 7.3;7.7 <0.0001
Central-West/Southeast 7.8 0.14 7.5;8.1 7.3 0.09 7.1;7.5 0.0033
State of São Paulo 8.0 0.18 7.7;8.3 7.0 0.10 6.8;7.2 <0.0001
South 7.6 0.11 7.4;7.8 7.0 0.09 6.8;7.2 <0.0001
p** 0.0010 <0.0001
Ethnic group
White 7.9 0.08 7.8;8.1 7.1 0.07 6.9;7.2 <0.0001
Black 7.9 0.09 7.7;8.1 7.4 0.06 7.3;7.5 <0.0001
p** 0.8241 <0.0001
* Descriptive level of the comparison test of means between 1998 and 2005 ** Descriptive level of the comparison test of means in the year
people who lived in the North/Northeast were 67% more likely to show intention of discrimination than those who lived in other regions.
In the 2005 model, women were 66% more likely to show intention of discrimination than men. In relation to age, the younger the age group, when compared to people who were 45 years or older, the lower the inten-tion of discriminainten-tion. On the other hand, the lower the level of education, when compared to those with university level, the higher the intention of discrimina-tion. In the case of those who did not know how to read or write, this likelihood increased more than six times in relation to those with university level.
In the North/Northeast region, the likelihood of show-ing intention of discrimination in relation to those who lived in the South region or in the state of São Paulo was 46% higher, while in the Central-West/Southeast regions, 39% higher.
People who were separated/divorced or widowed, when compared to other marital status categories, were
36% more likely to show intention of discrimination. Finally, those who did not have a religion were 27% less likely to show lower intention than people who had a religion.
Items that were not included in the IDI were analyzed separately. There was no change in the pattern of re-sponses to the following items between 1998 and 2005: “Do you think that before someone is tested for AIDS, it should be mandatory that him/her authorize it?” (p=0.8847), “Would you let your children be in the com-pany of a person living with HIV/AIDS?” (p=0.8673), and “Would you let a support center for people with AIDS operate near your home?” (p=0.1134).
As regards the item “Do you agree that pregnant women with the AIDS virus should have an abortion?”, there was a reduction in the proportion of positive responses from 45.2% (1998) to 21.9% (2005) (p<0.0001): in 1998, the positive responses were higher (p=0.0038) among men (50.6%) than women (40.1%). In 2005, positive responses were similar between men and
Table 5. Mean, standard-error (SE), confi dence interval (CI) of the intention of discrimination index, according to variable questions related to HIV. Brazil, 1998 and 2005.
Variable 1998 2005 p*
Mean SE 95% CI Mean SE 95% CI
Have you ever been tested for HIV in your life?
Yes 7.9 0.12 7.6;8.1 7.1 0.08 7.0;7.2 <0.0001
No 7.9 0.09 7.7;8.1 7.3 0.05 7.2;7.4 <0.0001
P** 0.6804 0.0257
Do you know/have you ever met anyone who has the AIDS virus?
Yes 7.8 0.11 7.5;8.0 7.25 0.06 7.1;7.4 <0.0001
No 8.0 0.07 7.8;8.1 7.22 0.07 7.1;7.4 <0.0001
P** 0.0296 0.7438
If your wife or female partner were pregnant and tests pointed to her having the AIDS virus, which of the following would you advise her to do?
Would let the pregnancy continue 7.7 0.17 7.4;8.0 7.0 0.08 6.9;7.2 0.0002
Would let the pregnancy continue and have tubal
ligation performed after delivery 7.9 0.11 7.7;8.1 7.1 0.07 7.0;7.3 <0.0001
Would have an abortion 8.0 0.12 7.8;8.2 7.8 0.1 7.6;8.1 0.2762
Would have an abortion and a tubal ligation
performed subsequently 7.9 0.25 7.4;8.3 7.6 0.17 7.3;8.0 0.497
Would consult a doctor about abortion 8.2 0.12 7.9;8.4 7.4 0.13 7.1;7.7 <0.0001
Would consult a doctor about tubal ligation 8.1 0.19 7.7;8.5 7.7 0.11 7.5;7.9 0.0661
Others 7.4 0.25 6.9;7.9
p** 0.5478 0.4955
Do you agree that pregnant women with the AIDS virus should have an abortion?***
Yes 8.0 0.08 7.9;8.2 7.7 0.069 7.6;7.9 0.0017
No 7.8 0.11 7.6;8.0 7.1 0.058 7.0;7.2 <0.0001
P** 0.0157 <0.0001
* Descriptive level of the comparison test of means between 1998 and 2005. ** Descriptive level of comparison test of means in the year.
women (p=0.5164). Among people who did not know how to read or write, there were percentages of positive responses (59.5% in 1998, p=0.0066; 32.2% in 2005, p=0.0024), when compared to people with other levels of education. This suggests the effect of this group’s lack of knowledge about the existence of prevention against vertical transmission of HIV.
DISCUSSION
This is the fi rst national population-based study that documents and relates discriminatory opinions in rela-tion to people with HIV, providing data with
implica-tions for public policies to fi ght stigma and discrimina-tion against people with HIV, symptomatic or not.
As regards the methodology employed, the construc-tion of the IDI may funcconstruc-tion as reference for other surveys on the theme of stigma and discrimination. To construct this index, a factor analysis with tetrachoric correlation was initially tested. However, the result was not found to be adequate in terms of how well it can be interpreted. In addition, the construction of a simple indicator, based on a sum of points that enabled to compare actions throughout time was the choice. In factor analysis, or another one with structural equations,
Table 6. Coeffi cients of the ordered logit model for 1998 and 2005.
Variable 1998 2005
Coeffi cient SE t p OR Coeffi cient SE t p OR
Sex
Female 0.32 0.20 1.6 0.102 1.4 0.51 0.08 6.6 <0.0001 1.7
Male 0.00 - - - 1.0 0.00 - - - 1.0
Age group ( in years)
16-19 -0.94 0.26 -3.7 <0.0001 0.4 -0.76 0.13 -5.8 <0.0001 0.5
20-24 -0.72 0.20 -3.7 <0.0001 0.5 -0.70 0.13 -5.3 <0.0001 0.5
25-34 -0.95 0.21 -4.6 <0.0001 0.4 -0.37 0.11 -3.2 0.001 0.7
35-44 0.00 - - - 1.0 -0.27 0.12 -2.3 0.023 0.8
45 and older 0.00 - - - 1.0 0.00 - - - 1.0
Level of education
Does not know how to read or write 0.41 0.19 2.1 0.038 1.5 1.85 0.25 7.4 <0.0001 6.4
Elementary school 0.00 - - - 1.0 1.48 0.11 14.0 <0.0001 4.4
High-school 0.00 - - - 1.0 1.05 0.10 10.2 <0.0001 2.9
University 0.00 - - - 1.0 0.00 - - - 1.0
Region of residence
North/Northeast 0.51 0.16 3.1 0.002 1.7 0.38 0.11 3.4 0.001 1.5
Central-West/Southeast 0.00 - - - 1.0 0.33 0.10 3.2 0.001 1.4
Others 0.00 - - - 1.0 0.00 - - - 1.0
Ethnic group/color
Black -0.28 0.16 -1.7 0.095 0.8 0.07 0.08 0.9 0.359 1.1
White 0.00 - - - 1.0 0.00 - - - 1.0
Marital status
Separated/divorced or widowed 0.00 - - - 1.0 0.31 0.12 2.6 0.009 1.4
Others 0.00 - - - 1.0 0.00 - - - 1.0
Religion
No religion 0.00 - - - 1.0 -0.31 0.12 -2.6 0.011 0.7
Others 0.00 - - - 1.0 0.00 - - - 1.0
Thresholds
t1 -5.0 0.63 -8.0 <0.0001 -2.5 0.18 -14.3 <0.0001
t2 -4.0 0.38 -10.7 <0.0001 -1.6 0.15 -10.5 <0.0001
t3 -3.3 0.35 -9.5 <0.0001 -1.0 0.14 -7.0 <0.0001
t4 -2.5 0.29 -8.7 <0.0001 -0.3 0.13 -2.3 0.0210
weights could vary throughout time and some variables could lose their importance, thus affecting comparabil-ity between periods. Nonetheless, it was not possible to establish association between degrees of intention of discrimination and levels of knowledge about HIV transmission mechanisms.
State interventions and actions between 1998 and 2005 could have had an impact on the reduction of discrimination, in terms of the volume and quality of the information disseminated, in addition to the exposure of people infected with HIV in the media.
Despite the IDI reduction, the dissemination of in-formation about ways of AIDS transmission (and non-transmission) still needs to be better planned and promoted. This investment must be substantially greater for the populations who showed higher degrees of intention of discrimination: those with lower level of education, those who live in the North/Northeast regions, and those who are aged over 45 years. Com-parison between the 1998 and 2005 surveys revealed a percentage higher than 90% in both periods among pregnant women, sex workers and drug users, thus indicating stigmatizing elements that demand more social control over these groups. Paradoxically, the level of agreement remained high, without changes in this period, when the person’s authorization or consent was necessary to perform the anti-HIV test.
The Programa Nacional DST/Aids (National STD/ AIDS Program) has supported the promotion of anti-HIV testing during pre-natal care, delivery, and follow-up of children exposed to HIV. In this context, it is possible to affi rm that part of the signifi cant re-duction in the percentage of positive responses to the question “Do you agree that pregnant women with the HIV virus should have an abortion?” is related to the dissemination of information that have contributed to change the way people deal with the pregnancy of sero-positive women. Abortion, however, is a controversial issue, with religious and political opposing groups in all spheres of society. In the present study, it was not possible to investigate the interaction between opinions against abortion and knowledge about prevention and treatment of vertical transmission of HIV.
The increase in the means of IDI among Pentecostals is not related to the sample size, which was controlled in the regression model. According to the Instituto Brasileiro de Estatística e Geografi a (Brazilian In-stitute of Geography and Statistics), the percentage of Evangelicals increased from 9% in 1991 to 15.4% in 2000. This increase can be partly explained by the strengthening of political-religious leaderships refl ected in their participation in the country’s public life, through elected positions in the Federal and State Chambers
or through the acquisition of television channels with national reach. This strengthening supports the demand for followers adopting more conservative positions, which translates into drawing a moral line so that HIV and AIDS are viewed and treated as “a virus and a disease from those who are sinners”.
The international investigation “Spirit and Power – a 10-country survey of Pentecostals” a shows that 86%
of these Pentecostals affi rm going to church weekly. When it comes to issues with strong moral content, such as abortion, Brazilian Pentecostals stand out as the most conservative.
Fear of contracting HIV through social contact with people infected by the virus has been frequently re-ported in several studies. Ferreira5 shows the reduction
in the number of people who were well-informed about social contact with people infected with HIV, about 50% in 1998 and 40% in 2005. However, the number of people who believe that social contact with people infected by the virus poses risk of transmission remains high, thus pointing to the need to focus on informative actions that take into consideration distinct cultural and local contexts.
A survey conducted in Zambia, Ethiopia, Tanzania and Vietnam11 showed that, regardless of their structural
and contextual differences, social contact with infected people which does not involve body fl uid exchange still causes fear of contamination. Even considering the high level of knowledge about ways of HIV transmission (through sexual contact, blood and vertical transmis-sion) in these countries, beliefs about transmission and mistrust of the information about how the virus is transmitted still remain.
The percentage of people who would let their children be in the company of someone with HIV remained low. Likewise, there was no signifi cant change in the percentage of agreement related to letting a support center for people with AIDS operate near the inter-viewees’ home. This may indicate that rejection rates become higher as the possibility of closeness, intimacy and interaction with people with HIV increases. Such situations reveal lack of information (or mistrust of the information obtained) in relation to exposure to the virus through social contact and great stigma of the disease repeatedly mentioned here. All this adds to the stigma and generates isolation and distancing of those who live with HIV, as well as the resulting discrimina-tion against them.
In conclusion, individual actions refl ect ideas and beliefs that are part of the economic and political struc-tures which infl uence life in society. Social commitment and responsibility to create a more compassionate,
1. Brimlow D, Cook J, Seaton R, editors. Stigma and HIV/AIDS: a review of the literature. Rockville, MD: U.S. Department of Health and Human Services; 2003. 2. Brown L, Trujillo L, Macintyre K. Interventions to
reduce HIV/AIDS stigma: what have we learned? New York: The Population Council; 2001.
3. Burkholder G, Harlow L, Washkwich J. Social stigma,
HIV/AIDS knowledge, and sexual risk. J Applied
Biobehav Res. 1999;4(1):27-44.
4. Bussab W de O, Grupo de Estudos em População, Sexualidade e Aids. Plano amostral da Pesquisa Nacional sobre Comportamento Sexual e Percepções
sobre HIV/Aids, 2005. Rev Saude Publica.
2008;42(Supl 1):12-20.
5. Ferreira MP, Grupo de Estudos em População, Sexualidade e Aids. Nível de conhecimento e percepção de risco da população brasileira sobre
o HIV/Aids, 1998 e 2005. Rev Saude Publica.
2008;42(Supl 1):65-71.
6. Herek GM. The social construction of attitudes: functional consensus and divergence in the US public’s reactions to AIDS. In: Maio GR, Olson JM, editors.
Why we evaluate: functions of attitudes. Mahwah, NJ: Lawrence Erlbaum, 2000. p.325-64.
7. Herek GM, Capitanio JP. AIDS stigma and sexual
prejudice. Am Behav Sci. 1999;42(7):1126-43.
8. Herek GM, Capitanio JP, Widaman KF. HIV-Related stigma and knowledge in the United States: prevalence
and trends, 1991-1999. Am J Public Health.
2002;92(3):371-7.
9. Herek GM, Capitanio JP, Widaman KF. Stigma, social risk, and health policy: Public attitudes toward HIV surveillance policies and the social construction of
illness. Health Psychol. 2002;22(5):533-40.
10. Herek GM, Mitnick L, Burris S, Chesney M, Devine P, Fullilove MT, et al. AIDS and stigma: a conceptual
framework and research agenda. AIDS Public Policy J.
1998;13(1):36-47.
11. Ogden J, Nyblade L. Common at its core: HIV-related stigma: across contexts. Washington, DC: International Center for Research on Women; 2005.
12. Wooldridge JM. Econometric analysis of cross section and panel data. London: The MIT Press; 2002.
REFERENCES
Article based on the data from the survey “Comportamento sexual e percepções da população brasileira sobre HIV/Aids (Sexual behavior and perceptions of Brazilian population on HIV/AIDS)”, carried out by Centro Brasileiro de Análise e Planejamento, supported by the Programa Nacional de DST e AIDS of Brazilian Ministry of Health (Process n. ED 213427/2004).
This article followed the same peer-review process as any other manuscript submitted to this journal, anonymity was guaranteed for both authors and reviewers.
Editors and reviewers declare they have no confl ict of interests that could affect the judgment process. The authors declare they have no confl ict of interests.
creative, and liberal culture are necessary. In this sense, to respond to the challenges of the epidemic and to the suffering of people is, above all, to celebrate dif-ferences, protect rights and develop the ability to face challenges with ethical vision and conscience.
There are no simple answers as to how to tackle and eliminate stigma and discrimination. These challenges require joint efforts to understand and plan actions that are more effi cient and in accordance with specifi c cultural contexts. It is essential not to view AIDS as
somebody else’s disease. Likewise, it is vital that the State implements policies that guarantee men’s and women’s equal access to proper prevention, care and treatment in all public spheres.
ACKNOWLEDGEMENTS