TERRITORIAL DIFFERENCES IN TRANSFORMATION PROCESSES
IN BULGARIA
Margarita ILIEVA
National Institute of Geophysics, Geodesy and Geography, Bulgarian Academy of Sciences, Bulgaria; Institute of Geography, Kazimierz Wielki University
Bydgoszcz, Poland
Introduction
The transformation started in all territorial units first in the economy and the changes in the economic sphere are connected with changes in the social sphere. Some of them are identical in nature with the changes in the national economy, while others are different. In general, the peculiarities of the process of transformation are a result of overlapping of national trends and specific processes and phenomena in the development of different parts of the country.
Several researchers determine the causes and factors that have influenced the different duration and effectiveness of the transformation process and the transition to a market economy. As Rydz (2006) maintains, the contemporary transformation processes are carried out in terms of pushing the regional structures out of the previous central command system and lead to the creation of new structures, based on market rules. "The effects of factors of restructuring in the geographic space build upon regional structures, formed earlier, which are characterized by different conditions for the adoption and implementation of the rules of the new system. New regional systems are formed as a result of the stronger but varying impact of new internal factors arising from the transformation process, and also of the factors at national and international level "(p. 5). According to Ciok (2001) "transformation process had a strong regional differentiation of forms from the very beginning" (p. 35), and according to Enyedi
(2005) „regional disparities are evident, because of the uneven geographical distribution of
development resources” (с. 18). Furthermore, it should be noted that the process of transformation of regional structures is carried out in a particular geographical environment,
Abstract: The transformation processes in Central and Eastern Europe, including Bulgaria, are subject of many investigations in the last two decades. Up to now there is no geographical survey on the territorial differences and their course in Bulgaria. The aim of this investigation is to study these differences in the transformation process in Bulgaria by 28 administrative districts (NUTS3). On the basis of analyses and comparisons of GDP per capita in different units (an indicator, accepted by specialists as the most common parameter) and the calculated values of integral indicator (reflecting the influence of 15 interlocked factors), the existing significant differences in the achieved level of transformation in the country are shown. At this stage there is no sufficient research to determine the threshold value of the integral indicator and to say with certainty that the territorial units, having values above it, are winners from the transformation process, and those with values below it, are losers.
which is a function of interrelated elements of the natural, social, economic and cultural space
(Zioło 1998).
Material and Methods
As basic units in this study of regional differences in the transformation process are used the 28 districts, created in 1999, to replace previously existing nine larger administrative districts. The change of administrative division and the establishment of planning regions as new territorial framework and organizational structure for future sustainable and balanced regional development in compliance with the process of integration of Bulgaria into the European structures and for carrying out relevant regional policy can be evaluated as a specific aspect of transformation in the country.
From the analysis of publications, in which the processes of transformation are a major subject of research, or of publications evaluating the differences in the level of socio-economic development during the transformation, it becomes obvious that the researchers have the used both single indicators and a combination of different number of indicators. As to the nature of the indicators that can measure the transformation, according to Conford, Richardson, Sokol, Marques, Gillespie (2006) there are well established and relatively non-contentious measures of improvement of transformed units - Gross Domestic / Regional Product per capita, various measures of productivity (output per worker or per working hour), levels of unemployment, levels of social exclusion, life expectancy, etc. Apparently, most of these indicators can be measured quantitatively. At first glance it seems that some of them imply expectations of negative consequences of transformation process, as unfortunately was the actual situation at the beginning of transition in Central and Eastern Europe. But as these authors stress, the transformation is expected to lead to improvements in transforming units, i.e. to have a positive contribution.
Gross domestic product (GDP) is one of the most commonly used parameters in the presentation of regional differences in the conduct and results of the transformation process both in individual countries and across regions. Furthermore, a number of other indicators are applied that characterize changes in the economy, the so-called development of business environment, competition, foreign capital inflow, changes in social relations, etc. For a better comparison some of the indicators are calculated on a per capita basis. The study and
characterization of the territorial differences by single indicators use, for comparison’s sake, the
mean national values of the indicators. According to Jasiulewicz (2000) these comparisons may show the "success" of changes in the territorial units.
In recent decades, alongside with the application of individual indicators the integral indicators have also been used as they turned out to be suitable for assessment and comparison of similarities and differences in the spatial differentiation of socio-economic processes and phenomena. Several researchers have examined regional transformation by integral indicators - Czyż (1998), Parysek (1998b), Ciok (2001), Nagy (2005), Tarkowski (2008) and others. The analysis shows that regardless of the number and use of various indicators, most research on territorial differences in the transformation changes is comparative in nature. Similar approach to the study of regional differences in socio-economic development of Bulgaria is applied by Yankova, Shopov, Chkorev, Ivanov, Kirilova (2003), Totev (2003), Rousev (2005), Yankova (2008) and others.
features of the processes of systematic and structural transformation. Based on theoretical and methodological formulations for the study of transformation and on the availability of necessary information, it attempted to measure the achieved degree of transformation in the different districts by applying the integral (synthetic) indicator as well. The integral indicator is defined as the sum of the standardized (normalized) values of our chosen indicators characterizing economic and social aspects of transformation. The assessments of the integral indicator are based on the current statistical figures for the period 1996-2007. Some of the information is
obtained from the National Statistical Institute and another part of it – from the author’s
publications. For most of the indicators 2007 is used as the last year; only for GDP this year is 2006. The value of the integral indicator for each district is obtained as a result of summing up the standardized (normalized) values of the chosen indicators on the basis of the formula below:
Zi = yi1 + yi2 + + yi3 + yi4 + ….. + yin
where:
Zi is the integral indicator for the i-s territorial unit;
уi1,….., yin - the standardized (normalized) values of the chosen indicators from 1 to n in the
i-s territorial unit.
On the basis of the categorization of the indicators, used in this research, and of the applied formula, pointed above, four synthetic intermediate indicators are calculated, which are component parts of the synthetic indicator. Depending on the nature of the processes, three of them feature various economics aspects of transformation and one - its social aspects.
It is very difficult to determine the threshold value of the integral indicator and to say with certainty that the territorial units, having values above it, are winners from the transformation process, and those with values below it, are losers. Therefore further research and concrete bases for comparisons are necessary. So at this stage we restrain from establishing such limits.
Results and Discussion
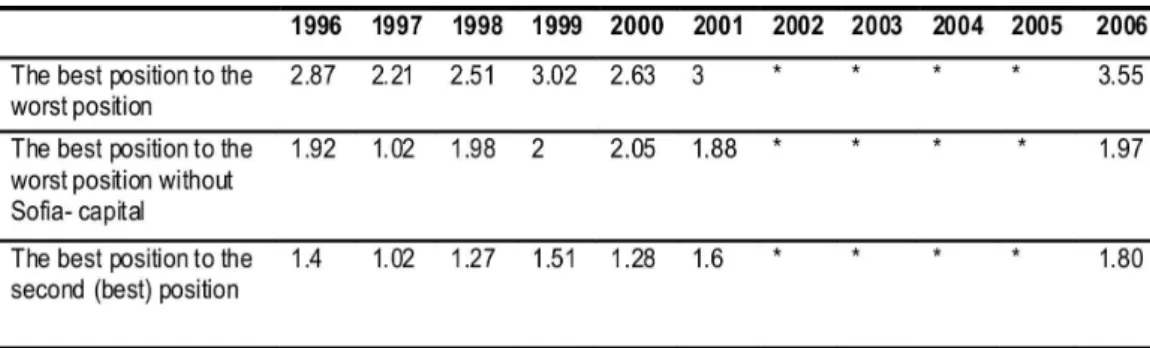
The analysis of data on gross domestic product (GDP) shows a significant territorial differentiation in areas owing to which considerable intraregional differences appear. The share of GDP produced in the economically most developed areas is growing. The analysis of the areas, holding the first and the last three positions1) on the ranking list over the period
1999-2006, indicates an increase in the share of the first three areas by 8.7 points, and a decrease in the share of the least developed areas by 0.83 points (Table 1).
Table 1
Share from Bulgaria’s Gross Domestic product
Source:Author’s calculations on the basis of the National Statistical Institute data.
Differences in GDP per capita by administrative districts point to the existing intraregional differences (Fig. 1). With values higher than the national average (6411 leva per capita) in 2006 are only 3 territorial units - the capital of Sofia, Sofia district and Varna district. A comparison with 1999 shows a decrease in the number (from 4 to 3) and a change in the "composition" of this group. In 1999 in Sofia city, and in the districts of Stara Zagora, Burgas and Vratsa the value of the discussed indicator is higher than the average for the country. The number of areas, characterized by an indicator almost equal to the national average, is reduced from 4 in 1999 (Dobrich, Varna, Kyustendil, Gabrovo) to two in 2006 (Stara Zagora, Burgas). Thus the number of districts with an indicator below the national average has grown up during the investigated period from 20 (1999) to 23 (2006). This group includes districts with better developed industries and services (Ruse, Gabrovo, Vratsa, etc.) as well districts, facing significant economic problems in recent years (Razgrad, Kyustendil, Yambol, etc.). The group of districts with the lowest index is also changing, only Montana keeps its place in it. If we
“transfer” at national level the European criterion, which considers as underdeveloped
(problematic, backward) territorial units with less than 75% of GDP per capita (in our case in the country), then in 2006 the number of districts, that are below that level, grew almost twice as compared to 1999 - from 9 to 17. This comes to prove that some of the districts are lagging behind and as a result, the territorial differences between them are increasing.
Fig.1 - Gross Domestic Product per capita by districts (2006, leva):
1 – 3000-3999; 2 – 4000-4999; 3 – 5000-5999; 4 – 6000-8000; 5 – over 13000.
Another indicator, revealing how successful the transformation processes are in different districts, is the dynamics of changes of gross domestic product per capita in them (1999 =100) (Fig. 2). Gross domestic product increased in all districts but the pace of this growth is different. The comparison shows that only in 6 of the districts (the capital city of Sofia, Sofia, Pernik, Pazardzhik, Kardzhali, Varna) it is higher than the average for the country (225.7). Among them can be distinguished economically better developed districts (the capital city of Sofia, Sofia, Varna) and less developed ones (Pazardzhik, Kardzhali). What is striking is that only one of those areas is situated in northern Bulgaria (Varna) and the rest are in the south of the country. Only in two areas (Plovdiv, Smolyan) this increase is identical to the national average. In over two thirds of the districts (20) it is less than the national average. These processes indicate that
most of Bulgaria’s territory has slowed down the rate of its economic development.
Fig. 2 -Dynamics of Gross Domestic Product per capita by Districts (1999-2006):
1999 =100; 1 – 140-170; 2 – 170.1-200; 3 – 200.1-230; 4 – 230.1-260; 5 – over 260.1.
Source of data: National Statistical Institute
NUTS2 and NUTS3, ranked in the best and the worst position in Hungary in 1994-2000 (Hrubi 2002).
Table 2
Differences between districts by Gross Domestic Product per capita
*- not calculated due to lack of data
Source: Author’s calculations on the basis of the National Statistical Institute data
If the capital of Sofia is not taken into account, then the differences between the districts will decrease significantly, and the changes in the ratios between the districts in best and worst position will be negligible. The analysis shows that by 2000 the changes in the districts, ranked second, are more frequent than those concerning the areas in the worst position. Recently the gap between the poorest districts is relatively small and therefore different areas take turns, occupying the worst position.
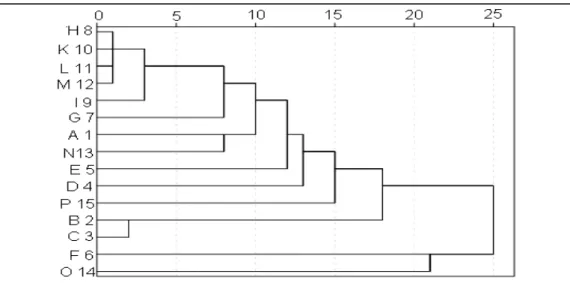
Fig. 3 - Dendogram using the method of nearest neighbor
Indicators: A1 - share of employees in the private sector of the total number of employees; B2 - share of production of GVA in private sector; C3 - share of fixed assets in the private sector; D4
- share of the services in GVA; E5- share of the industry in GVA; F6 – share of the agriculture
in GVA; G7 - number of enterprises, excl. financial, in 1000 persons of the population; H8 - GDP per capita; I9 - population density, K10 - FDI in the non-financial enterprises per capita; L11 - fixed assets in the non-financial enterprises per capita; M12 - expenditure on acquisition of tangible fixed assets in the non-financial enterprises sector per capita; N13 - employment
rate; O14 - unemployment rate; P15 - income per capita.
Source: author’s calculations based on National Statistical Institute data
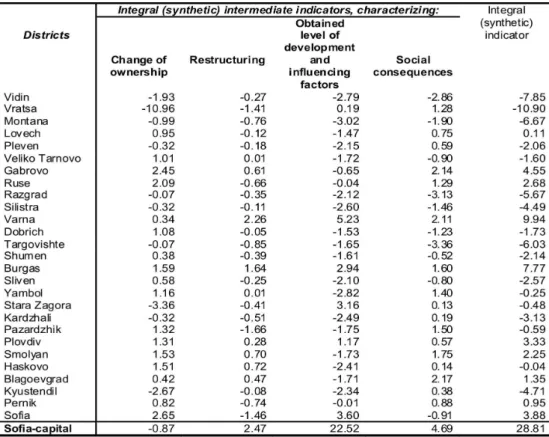
The selected and applied 15 indicators can be conditionally divided into several groups. Taking into consideration the theoretical and methodological formulations for the study of transformation, the specific features of the ongoing processes and the availability of necessary information for their characterization, the calculated integral (synthetic) indicator for measuring the achieved degree of transformation in the different districts is sub-divided into four main components (integral intermediate indicators). Three of them, conventionally called "change of
ownership” (I), "restructuring" (II), "obtained level of development and influencing factors" (III)
feature various aspects of economic transformation and one, conventionally called “social
consequences” (IV), refers to the social aspects of transformation (Table 3). The analysis of
these four integral intermediate indicators makes it possible to assess them according to the territorial differences between the areas.
The first integral intermediate indicator (ZIi) characterizes the changes in ownership in each
territorial unit as one of the major changes in the process of transformation. It is calculated on the basis of three indicators by using the following formula:
ZIi = yi1 + yi2 + yi3
where:
уi1 - the standardized value of the share of employees in the private sector of the total
number of employees in the i-s territorial unit;
(GVA) in the i-s territorial unit;
yi3 - the standardized value of the share of fixed assets in the private sector in the i-s
territorial unit;
In order to determine the second integral intermediate indicator for the i-s territorial unit (ZIIi),
characterizing the process of economic restructuring, 4 indicators have been used: ZIIi = yi4 + yi5 + yi6 + yi7
where:
уi4 - the standardized value of the share of the services in GVA in the i-s territorial unit;
yi5 - the standardized value of the share of the industry in GVA in the i-s territorial unit;
yi6 - the standardized value of the share of the agriculture in GVA in the i-s territorial unit;
yi7 - the standardized value of the coefficient of entrepreneurship (number of enterprises,
excl. financial, in 1000 persons of the population) in the i-s territorial unit;
The available information favors the application of 5 indicators for calculating the third integral
intermediate indicator (ZIIIi), characterizing the achieved level of development of the territorial
units and some more important factors which speed up / slow down the transformation processes in each territorial unit:
ZIIIi = yi8 + yi9 + yi10 + yi11+ yi12
where:
i8 - the standardized value of the GDP per capita in the i-s territorial unit;
yi9 - the standardized value of the population density in the i-s territorial unit;
yi10 - the standardized value of the FDI in the non-financial enterprises per capita in the i-s
territorial unit;
yi11 - the standardized value of the fixed assets in the non-financial enterprises per capita
in the i-s territorial unit;
yi12 - the standardized value of the expenditure on acquisition of tangible fixed assets in
the non-financial enterprises sector per capita in the i-s territorial unit;
he fourth integral intermediate indicator for each territorial unit (ZIVi) characterizes the social
consequences of transformation. he unemployment rate is in inverse proportion to the
progress of transformation processes, so it has a minus sign in the formula used. ZIVi = yi13 - yi14 + yi15
where:
уi13 - the standardized value of the employment rate in the i-s territorial unit;
yi14 - the standardized value of the unemployment rate in the i-s territorial unit;
yi15 - the standardized value of the income per capita in the i-s territorial unit;
The analysis of these four synthetic intermediate indicators, conventionally called "change of
ownership” (I), "restructuring" (II), "obtained level of development and influencing factors" (III) and “social consequences” (IV), makes it possible to assess them according to the territorial
differences between the areas. As to the change in ownership, the differences between them
are relatively small. The only exception is Vratsa district in which the state-owned manufacturing firms play an important role (NPP Kozlodui, etc.). According to the values of the
Table 3
Integral indicator of the achieved degree of socio-economic transformation by districts
Source: Author’s calculations on the basis of the National Statistical Institute data
The integral indicator allows to assess the regional differences depending on the aggregate effect of all indicators. An analysis of the calculated values by districts shows that they widely vary - from -10.90 (Vratsa) to 28.81 (Sofia-city). Only 11 of the areas have a positive value of the integral indicator, while the remaining 17 have a negative one (Table 3). These differences are a quite natural, resulting from the utilization of the existing socio-economic potential, from the transformation crisis in the early 1990s, from the disparities in the course of transformation processes, etc. The analysis shows that the majority of territorial units in North Bulgaria have negative (10 from 14 areas) or low values of the integral indicator (Lovech). The districts of Varna, Gabrovo and Ruse make an exception (Table 3). Most of the areas with positive values are located in South Bulgaria. This once again confirms the major territorial disparities between North and South Bulgaria. The differences between North and South Bulgaria are outlined by
Stoyanov, Dimov (2006), who claim that “a stable south-to-north dichotomy in GDP is arising. The trend towards the increasing weight of the South is persistent, which demonstrates the
growing imbalances” (after Stoyanov 2008, p. 367).
The highest value of the integral indicator is recorded in the capital city of Sofia. Similar is the place of Budapest as compared to the other territorial units in Hungary, where according to
outstanding success of the Budapest Metropolitan Region, producing a growing gap between
the capital city and the rest of the country” (p. 19). The current situation, conditions and
prospects for future developments give grounds to assume that the differences between the capital city of Sofia and other districts will grow in the coming years. The role of the capital cities in regional development, where are concentrated the most important elements of market economy, is observed by Horvath (2009) in almost all countries of Central and Eastern Europe. According this author this adverse and long territorial concentration must be changed. Fassmann (2000), Enyedi (2005), Tarkowski (2008), Stoyanov, Dimov (2006), Horvath (2009) and other authors emphasize in their own research the growing role of the capital, metropolitan and big cities in different countries.
Bulgaria’s districts Varna and Bourgas come second after Sofia with significantly lower integral
indicators. The value of their integral indicators differ considerably from calculated values of other areas. Against the background of the other areas in Bulgaria, Sofia-capital, Varna and Burgas districts can be conditionally defined as winners from transformation. Of course, it goes without saying that in comparison with NUTS3 in the EU configuration, even the capital city of Sofia is among the EU underdeveloped territorial units of that type. With the lowest integral indicator are the districts of Vratsa, Vidin, Montana, Targovishte and Razgrad (Fig. 3). They can certainly be treated as the greatest losers from transformation.
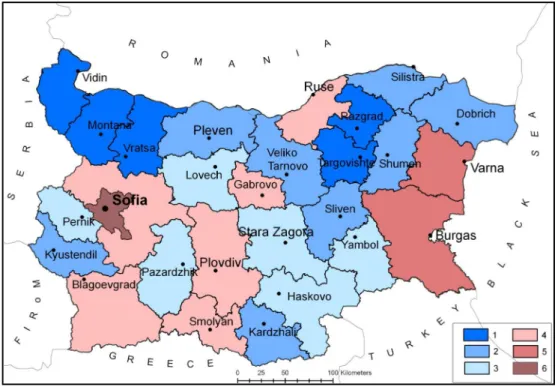
Fig. 4 - Achieved degree of the socio-economic transformation.
Value of integral indicator: 1 – from -10.9 to -5.1; 2 – from -5 to -1.1; 3 – from -1 to 1; 4 – 1.1-5;
5 – 5.1-10; 6 – over 28.
Source: Author’s calculations on the basis of the National Statistical Institute data
that existed earlier, in the period of planned economy. In Bulgaria as well as in other Central
and East European countries during the period of territorial restructuring „the leading and
backward areas have been developing at quite different paces, which indicates that the special structuring forces are now more differentiated than they were in the planned economy period. Back then, planned industrialization was to shape the economic potentials of the various regions; today, their economic development is influenced by the competitive sectors of industry and by adjoining services” (Horvath, 2009, с. 11). "In many respects regional disparities are exacerbated or significantly modified due to uneven crisis processes in different sectors and branches of national economy" (Roussev, 2005, p. 152).
The development of the transformation process has a definite influence on the polarization of development in different parts of the territorial units and thus on the formation of regional differences at a lower level. According to Horvath (2009) significant intra-regional disparities
between districts and municipalities in Bulgaria indicate that „the regional development policy
has so far failed to adequately address” (с. 12).
Szlachta (1993), Fassmann (2000), Enyedi (2005), Horvath (2009) and other authors identify as winners from the processes of transformation the metropolitan, capital and big cities, and as losers - the industrial cities or areas in which heavy and mining industries are dominant. To the
“winners” Fassmann (2000) adds border and rural areas defined as islands of stability. Perhaps
the latter is valid for some countries with smaller or more successful reforms in agriculture, but for Bulgaria this finding is not definitely confirmed. Enyedi (2005) and Horvath (2009) include the rural areas in the group of losers, too. Horvath (2009) regards as losers from this transformation the regions with extensive agriculture and suggests that this is a special East-European characteristic feature. This study shows that the districts, which embrace vast rural areas, have low values of the integral indicator, e. g. most of the districts in North Bulgaria (Fig. 3).
According to Fassmann (1997) one of the regional consequences of the transformation measures is the increased importance of urban centers as growth poles of the national economy. The largest agglomerations in Bulgaria - Sofia, Plovdiv, Varna-Devnya, Burgas-Kameno, are formed in area, characterized in this study by a high degree of socio-economic transformation (Fig. 3). As economically better developed, they are in a favorable situation,
“have experienced more easily the difficulties of restructuring and have been given better
chances to attract investors, including foreign ones " (Parysek 1998a, p.40).
Of the other big cities in Bulgaria (Ruse, Stara Zagora, Pleven) only Pleven is a core of an ur-ban agglomeration (Iliev, 1995). The calculated integral indicator for the district of Pleven is negative (Table 3). Further details of studies on the role of urban agglomerations and cities in Bulgaria in the process of transformation will allow to determine the effectiveness of the socio-economic transformation in them and the extent of their impact over the respective areas.
Conclusions
This investigation presents the territorial differences of transformation process in Bulgaria by 28 districts (NUTS3) on the basis of analysis of a single indicator (GDP per capita) and the calculated values of integral indicator. Significant differences in the transformation process in the country are observed in its course in the individual units. They are more or less apparent depending on the available economic potential in them and its current state, on the degree of influence of factors at national and local level (geographical location, economic structure, attractiveness to foreign investment, demographic factors, created jobs, differences in income, infrastructure and communications, etc.), on differences in the rate of reforms, etc.
The study shows that the majority of territorial units in North Bulgaria have negative or low values of the integral indicator in contrast to the areas with positive values in South Bulgaria. This once again confirms the major territorial disparities between North and South Bulgaria. The best results in transformation are achieved in Sofia-capital, in Varna and Burgas districts. Against the background of the other areas in Bulgaria, Sofia-capital, Varna and Burgas districts can be conditionally defined as winners from transformation. But in comparison with NUTS3 in the EU configuration, even the capital city of Sofia is among the EU underdeveloped territorial units of that type. The districts with the lowest integral indicator (Vratsa, Vidin, Montana, Targovishte and Razgrad) can certainly be treated as the greatest losers from transformation.
References
CIOK, S. (2001), Processes of socio-economic transformation processes in countries of Central and Eastern Europe in light of selected indexes, in: Kitowski, J. (ed.) Spatial dimension of socio-economic transformation processes in Central and Eastern Europe on the turn of the
20th century, vol.I, Rzeszów: 35-50.
CONFORD, J., RICHARDSON, R., SOKOL, M., MARQUES, P., GILLESPIE, A. (1996), Transformation of regional societies throught ICTs: State(s) of the Art(s), A discussion document, Final version July 2006, Sixth Framework Programme.
CZYŻ, T. (1998), Polarisation of regional development during the period of
socio-economic transformation in Poland, in: Parysek, J, H. Rogacki, Przemiany społeczno
-gospodarcze Polski lat dziewięćdziesiątych, BWN, Suliborski Poznań (in Polish).
ENYEDI, G. (2005), Processes of regional development in Post-socialist Hungary, in:
Barta, G., Fekete, E.G., Szorenyjne, I.K., Timar, J., Hungarian Spaces and places: patterns of transition, Pecs: 18-27.
FASSMANN, H. (1997), Regionale Transformationsforschung. Theoretische
Begrundung und empirische Beispiele, in: Regionale Transformationsprozesse in Europa.
Beiträge zur Regionalen Geographie, 44. Leipzig.
FASSMANN, H. (2000), Regions in upheaval. Conceptual framework and empirical
findings of the regional transformation research, in: Horvath, G. (ed.), Regions and cities in the global world, Pecs: 126-140.
HORVATH, G. (2009), Cohesion Deficiencies in Eastern and Central Europe –
Inequalities of Regional Research Area, DISCUSSION PAPERS, No 72, Centre for Regional Studies of Hungarian Academy of Sciences, Pecs.
HRUBI, L. (2002), Old and new elements in the spatial structure of Hungary in the
1990s, in: Horvath, G. (Ed.), Regional Challenges of the Transition in Bulgaria and Hungary, DISCUSSION PAPERS, Special Issue, Centre for Regional Studies of Hungarian Academy of Sciences, Pecs.
of its territory, Dissertation, Sofia, 1995 (typewritten), (in Bulgarian).
JASUILEWICZ, M. (2000), Structural and spatial transformations of Central Pomerania’s
rural areas in the period of system transformation, Politechnika Koszalinska, Koszalin, (in Polish).
NAGY, G. (2005), Changes in the position of Hungarian regions in the county’s
Economic field of gravity, in: Barta, G., Fekete, E.G., Szorenyjne, I.K., Timar, J., Hungarian Spaces and places: patterns of transition, Pecs.
PARYSEK, J. (1998a), Effects of socioeconomic transformation process in Poland.
Balance of period 1989-1996, in: Parysek, J., Rogacki, H. (Eds.), Przemiany społeczno
-gospodarcze Polski lat dziewięćdziesiątych, Bogucki Wydawnictwo Naukowe, Poznań; (in
Polish)
PARYSEK, J. (1998b), The spatial dimension of the process of socio-economic
transformation (in the first 6 years), in: Domański, R. (ed.), Emerging spatial and regional structures of an economy in transition, Warszawa, PWN.
ROUSEV, М. (2005), Rank and typology of districts and municipalities in Bulgaria in
terms of sustainable development, Godishnik na SU, kn. 2, Geografia, t. 97: 151-159, (in Bulgarian)
RYDZ, E. (2006), Change of socio-economic structures during period of system
transformation in Pomorze Środkowe, Słupsk, Wyd. Pomorskiej Akademii w Słupsku, (in
Polish).
STOYANOV, P. (2008), German "organization of space”, Habilitation work. Sofia
(typewritten), (in Bulgarian).
SZLACHTA, J. (1993), Regional development of Poland in economic transformation
conditions, Fundacja im. F. Eberta, Warszawa, (in Polish).
TARKOWSKI, M. (2008), Centres and perypheries socio-economic development in
Poland under system transformation, Gdynia-Pelplin, (in Polish).
TOTEV, S. (2003), Regional dimensions and overcoming differences, Ikonomika, 3, (in
Bulgarian).
YANKOVA, N. (2008), Development differences between territorial units in the country
during the period 2003-2004, Economic studies, 1: 58-84, (in Bulgarian).
YANKOVA, N., SHOPOV, G., CHKOREV, N., IVANOV, S, KIRILOVA, Y. (2003), Socio-economic differences between municipalities in Bulgaria, Sofia, (in Bulgarian).
ZIOŁO, Z. (red.), (1998), Problemy transformacji struktur regionalnych w procesie
zmian systemu gospodarowania integracji europejskiej, Rzeszów,
Initial submission, October 2, 2010 Revised submission, January 4, 2011 Final acceptance, April 28, 2011
Correspondence: National Institute of Geophysics, Geodesy and Geography, Bulgarian
Academy of Sciences, “Acad.G.Bonchev” str., bl.3, 1113 Sofia, Bulgaria;
Institute of Geography, Kazimierz Wielki University, Minska 15, 84-428, Bydgoszcz, Poland.