Evolution in Children during Their First 18 Months of Life
Using Latent Class Analysis
Kobto G. Koura1,2,3*, Smaı¨la Oue´draogo1,2,3, Gilles Cottrell1,2,5, Agne`s Le Port1,2,3, Achille Massougbodji4,5, Andre´ Garcia1,2
1IRD UMR216, Me`re et enfant face aux infections tropicales, Paris, France,2Faculte´ de Pharmacie, Universite´ Paris Descartes, Paris, France,3Universite´ Pierre Marie Curie, Paris, France,4Faculte´ des Sciences de la Sante´, Universite´ d’Abomey-Calavi, Cotonou, Be´nin,5Centre d’Etudes et de Recherche sur le Paludisme Associe´ a` la Grossesse et a` l’Enfant, Cotonou, Be´nin
Abstract
Background:Anaemia during pregnancy and at delivery is an important public health problem in low- and middle-income countries. Its association with the children’s haemoglobin level over time remains unclear. Our goals were to identify distinct haemoglobin level trajectories using latent class analysis and to assess the association between these trajectories and maternal anaemia and other risk factors.
Method:A prospective study of children from birth to 18 months of life was conducted in a rural setting in Tori-Bossito, Benin. The main outcome measure was the haemoglobin levels repeatedly measured at 3, 6, 9, 12, 15 and 18 months. Variables were collected from the mothers at delivery and from their children at birth and during the follow-up. The analyses were performed by means of Latent Class Analysis which has never been used for this kind of data. All the analyses were performed with Stata software, version 11.0, using the generalized linear latent and mixed model (GLLAMM) framework.
Results:We showed that 33.7% of children followed a low haemoglobin trajectory and 66.3% a high trajectory during the first 18 months of life. Newborn anaemia, placental malaria, malaria attack, sickle cell trait and male gender were significantly associated with a lower children’s haemoglobin level over time, whereas maternal age, children living in a polygamous family and with good feeding practices had a higher Hb level in the first18 months. We also showed that maternal anaemia was a predictor for ‘low haemoglobin level trajectory’ group membership but have no significant effect on children haemoglobin level over time.
Conclusion:Latent Class Analyses framework seems well suited to analyse longitudinal data under the hypothesis that different subpopulations of subjects are present in the data, each with its own set of parameters, with distinctive evolutions that themselves may reflect distinctive aetiologies.
Citation:Koura KG, Oue´draogo S, Cottrell G, Le Port A, Massougbodji A, et al. (2012) Maternal Anaemia at Delivery and Haemoglobin Evolution in Children during Their First 18 Months of Life Using Latent Class Analysis. PLoS ONE 7(11): e50136. doi:10.1371/journal.pone.0050136
Editor:Ann M. Moormann, University of Massachusetts Medical School, United States of America
ReceivedJune 19, 2012;AcceptedOctober 16, 2012;PublishedNovember 21, 2012
Copyright:ß2012 Koura et al. This is an open-access article distributed under the terms of the Creative Commons Attribution License, which permits unrestricted use, distribution, and reproduction in any medium, provided the original author and source are credited.
Funding:This work was supported by Agence Nationale de la Recherche (ANR), Paris, France. (Project SEST 2006/040/001). The funders had no role in study design, data collection and analysis, decision to publish, or preparation of the manuscript.
Competing Interests:The authors have declared that no competing interests exist.
* E-mail: [email protected]
Introduction
Anaemia during pregnancy and at delivery, defined by haemoglobin (Hb) concentration lower than 11 g/dl, is an important public health problem in low-income and middle-income countries [1]. In 2009, McLean et al. estimated that 30– 60% of pregnant women were anaemic [2].
The consequences of maternal anaemia on pregnancy outcomes are well documented despite the existence of discrepant results. Studies have shown a relation between maternal anaemia during pregnancy and low birth weight, preterm birth and newborn anaemia [3–5]. However, its association with the children’s haemoglobin level over time remains unclear. In 2002, de Pee
et al. showed a relation between the mother’s haemoglobin
concentration during pregnancy and the infant’s haemoglobin level from 3 to 5 months of age [6]. Moreover, iron-deficiency anaemia was also found to be more frequent in children born to anaemic mothers than children born to non-anaemic mothers in Jordan, Indonesia and Niger [6–8]. All previous studies used cross-sectional analyses not taking into account the correlation between Hb measurements taken repeatedly on the same individuals.
these data, using hierarchical mixed models to deal with the repeated measures design, we concluded that the evolution of haemoglobin levels from birth to 18 months of age was associated with several children’s characteristics but not with maternal anaemia at delivery [11].
However, mixed models, although well suited to longitudinal data analysis, make the important assumption that the individuals in the sample are randomly drawn from a homogeneous sample (with an allowed individual variability accounted by the covariates and the random effects). Nevertheless, in this sample, in which more than 60% of newborns were anaemic at birth and a large proportion remained anaemic during the follow-up, it seemed to us very interesting to test whether distinct subpopulations of children are present in the data, each with its own set of parameters, with distinctive haemoglobin evolutions, or trajecto-ries, that themselves may reflect distinctive aetiologies. The identification of trajectories of haemoglobin through the first 18 months of life and risk factors that predispose to or modify a particular trajectory may provide a better understanding of the natural history of how children’s haemoglobin evolves. There are several ways to model mixture of populations and latent class analysis (LCA) approach is one of them. However, all these approaches allow exploring this issue partly because they do not assume that all individuals belong to the same homogeneous population. It allows us to identify latent groups of individuals who share a particular developmental trajectory of some attribute. [12,13].
Thus, the main objective of the present work was to provide a new approach to analyze the existence and characteristics of groups of children with similar patterns of Hb levels evolution between 3 and 18 months of life in a cohort of Beninese children included in the Tori Bossito project.
Methods
Study Design
The Tori Bossito project is a birth cohort study of children who were followed up in the first18 months of life. Full details of the survey have been described elsewhere [9–11].
Study Site and Population
This study was conducted in nine villages in the district of Tori-Bossito, a semi-rural area located 50 km north of Cotonou, the economic capital of Benin. The study participants were recruited in three health centres (Tori Avame, Tori Cada and Tori Gare) in the districts, which were chosen because of their capacity to provide adequate care to children and their proximity to the study population’s residential area. Malaria is perennial andPlasmodium falciparum is the commonest species. There are two high transmission peaks from April to July and October to November. Transmission is low the rest of the year.
The study population was composed of pregnant women who came to any of the three health centres for delivery between June 2007 and July 2008. The newborns included were followed up until January 2010 (Figure 1).
Variables Measured
Variable of interest: Hb. At 3, 6, 9, 12, 15 and 18 months of
life, the haemoglobin level was assessed on a portable device (HemoCueH) using a drop of blood. The haemoglobin level repeatedly measured at 3, 6, 9, 12, 15 and 18 months was our outcome variable.
Covariates. The following variables were collected from the
mothers at delivery: (1) maternal anaemia at delivery defined as
Hb level less than 11 g/dl (Hb level was measured before birth ), (2) age, (3) ethnic group, (4) working status during pregnancy (housewife vs. working), (5) maternal marital status (monogamous vs. polygamous family), (6) parity (primipare vs. multipare), (7) number of prenatal care visits (less or more than four prenatal visits), (8) educational status (schooled vs. unschooled) and (9) placental malaria (thick and thin placental smears were made to look for placental malaria). The following variables were collected from the children: (1) newborn’s anaemia (Hb,14 g/dl), (2) low birth weight (,2500 g), (3) preterm birth (gestational age,37 completed weeks of gestation), (4) gender, (5) sickle cell trait, (6) number of malaria attacks during the follow-up and (7) nutritional status of children during all the following-up period, using a WHO/UNICEF indicator [14] : infant and young child feeding indicator (IYCF) is the sum of minimum meal frequency and minimum dietary diversity. For each child and each month, based on dietary recall of the last 24 hours we calculated the nutrition score which was equal to 1 when the IYCF requirement was satisfied.
Statistical Analysis
We used latent class analysis to identify the haemoglobin level trajectories and assess their association with the covariates.
A general model’s formulation is:
yit~bj0zbj1Ageitzb j
2Age 2
itzb j
3Age 3
itza j
1X1tz:::
zajpXptzeit
whereyitis the response variable (Hb level of theith children at
aget), thebjare the coefficient associated to the children’s age in thejthgroup and theajare the coefficient associated to covariates
in thejthgroup (the indextspecifies that the covariates can depend
on time) andeitthe residual variation [eit*N 0,s2].
The posterior probability pj(zi) that an children i with the
covariates vectorzi belongs to the groupj is:pj(zi)~Pexp (zihj) j
exp (zihj)
with covariates vectorziand its corresponding coefficients vector
hj.
The analysis was performed in four steps.
In the first step, each haemoglobin level trajectory was modelled using a polynomial function of time and no covariates were added to the model at this time. The most appropriate number of classes was determined using the Bayesian Information Criterion (BIC). The substantive criteria included the group prevalence greater than 5% of the sample because of the usefulness and practical interpretability of latent classes [15].
In the second step, we explored the relationships between haemoglobin level trajectories and the covariates. All covariates that were significantly associated with haemoglobin level in univariate analysis withp,0.20 were entered in the multivariate analysis. Statistical significance in the final model was set at
assigned to the trajectory group for which he had the highest posterior probability. Within each group, posterior probability values greater than or equal to 0.7 indicate adequate internal reliability [15]. Taking together, these criteria allowed us to make a definitive choice of the appropriate number of classes.
In the third step, we studied the predictor effect of maternal anaemia to belong to one or more trajectory depending on the number of classes we identified.
Finally, our fourth step consisted to test whether the effects of covariates on the evolution of haemoglobin levels in the first18 months of age differed within each trajectory.
All these analyses were performed with Stata software, version 11.0 (StatCorp LP, College Station, TX, USA), using the generalized linear latent and mixed model (GLLAMM) framework [19,20].
Ethics
The study’s protocol was approved by the University of Abomey-Calavi’s institutional review board and the IRD’s Consultative Ethics Committee. All women who participated in this study signed informed consent before enrolment (which also included their children) and were able to withdraw their consent at any time during the study.
Results
The analysis covered 2708 haemoglobin measurements out of the expected 3252. In most cases, an Hb measurement was missing from the children’s follow-up because the mother had not attended a quarterly meeting: 480 children (89%) were present at least four times out of six at quarterly meetings during the follow-up. Full details of the baseline characteristics of the subjects have been described elsewhere [11].
First we identified groups of individuals who followed a similar pattern of haemoglobin from age 3 to 18 months. Using the BIC as criteria, the model with three groups was selected when compared to the two-group model (8289.1 and 8345.1, respec-tively). A fourth group, when added, accounted for less than 0.6% of the children. The same pattern was observed with models of more than four groups (i.e. less than 1% of the sample fell into the supplementary trajectories). In the two-group model, the first latent trajectory accounted for 32.8% of children with a low
haemoglobin level and the second trajectory 67.2% of children falling into the highest haemoglobin level in the first18 months of life. For the three-group model, the first latent trajectory accounted for 10.6% of the children with the lowest haemoglobin level. The second latent trajectory accounted for 34.3% of the sample falling into an intermediate haemoglobin level category and, finally, the third latent trajectory accounted for 55.1% of the children who fell into the highest haemoglobin class.
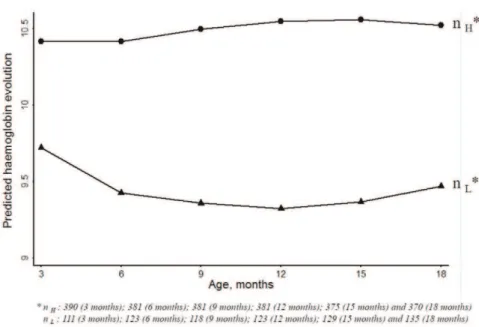
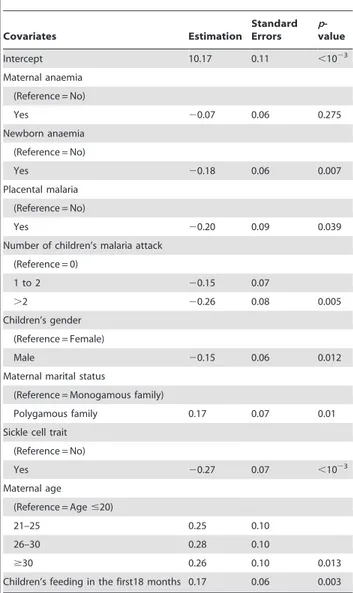
Then we explored the relationships between haemoglobin trajectories and covariates using the two-group model and the three-group model. The effects of covariates were similar with the two- or three-trajectory models (see below). However, after adding covariates in the three-trajectory model, only 2% of the sample fell into the lowest haemoglobin trajectory instead of 10.6% previ-ously, consistent with the instability of the three-trajectory model. The Gateaux derivative method confirmed that the three-point solution may represent a local maximum of the log-likelihood. Finally, for the following analyses, we used the two-group model. The largest group identified, called the ‘high trajectory’ group, accounted for 66.3% of the children in this sample. The second trajectory included children who had lower haemoglobin from 3 to 18 months of life. This group was called the ‘low trajectory’ and accounted for 33.7% of the sample. With this model, 95.2% of children from the high haemoglobin level trajectory were classified as belonging to this group with a posterior probability greater than 70%, whereas 86.0% of children from the low haemoglobin level trajectory were classified as belonging to this group with a posterior probability greater than 70%. These two groups are presented in Figure 2 and were labelled according to their most unique characteristics. For the low trajectory, the haemoglobin level at 3 months of age was around 9.75 g/dl and decreased between 3 and 12 months; After 12 months it increased slightly until 18 months. For the high trajectory, the haemoglobin level started around 10.4 g/dl and increased from 3 to 12 months of life and remains stable for the last six months. Table 1 showed the descriptive variables of these two latent groups.The factors associated with children haemoglobin progression in multivariate analysis are presented in Table 2. Newborn anaemia, placental malaria, malaria attack, sickle cell trait and male gender were significantly associated with a lower haemoglobin level in the first18 months of age (p= 0.007,p= 0.039,p= 0.005,p,1023
and
p =0.012, respectively). Maternal age, children living in a
Figure 1. Enrollment and follow-up in study, Tori-Bossito, Benin, 2007–2010.
polygamous family and with good feeding practices had a higher Hb level in the first18 months of age than others (p =0.013,
p= 0.01 and p= 0.003, respectively). We found that maternal anaemia at delivery had no significant effect on children haemoglobin level in the first18 months (p= 0.275).
In the third step of our analysis, we examined the role of maternal anaemia as predictor of belonging preferentially to either group. Children born to mothers with maternal anaemia were more likely to belong to the lower trajectory class [OR = 1.65,
p= 0.03].
Finally, among the covariates significantly associated with children haemoglobin in the first18 months, sickle cell trait was the only one for which the effect differed within each group (Table 3). Indeed, its negative effect was more strongly marked within the low trajectory (p= 0.023).
When maternal anaemia at delivery and newborn anaemia were replaced respectively by haemoglobin levels as quantitative
variables, the same pattern of results was obtained. Maternal haemoglobin level at delivery was not significantly associated with children haemoglobin level in the first18 months (p= 0.8) whereas newborn haemoglobin level had significant effect (p= 0.03).
Discussion
As far as we know, published data describing repeated haemoglobin measurements from children over extended periods are very scarce. Only one analytic method for such data has been proposed heretofore [11,21]. We previously showed that neither haemoglobin level at birth nor maternal anaemia were associated with children Hb level in the first18 months, but the occurrence of a malaria attack during follow-up, male gender and sickle cell trait carriage were associated with a lower children haemoglobin level in the first18 months. Children living in a polygamous family and with good feeding practices had a higher Hb level in the first18
Figure 2. Trajectories for haemoglobin (3 to 18 months of age).
doi:10.1371/journal.pone.0050136.g002
Table 1.Table of descriptive variables of the two latent groups.
High trajectory Low trajectory
Birth weight, mean (SD) 2994.8 (382.8) 2951.6 (384.2)
Low Birth weight 32 (7.8%) 18 (13.6%)
Preterm birth 43 (10.5%) 12 (9.2%)
Hemoglobin rate, mean (SD) 14.6 (1.9) 14.2 (1.9)
Newborn’s anemia 143 (35.5%) 49 (37.7%)
Children’s gender (Female) 191 (46.8%) 81 (61.8%)
Sickle cell trait (carrier or not of AS variant) 80 (20.1%) 32 (26.0%)
Number of malaria attacks during the first 18 months
0 147 (36%) 36 (27.5%)
1 to 2 176 (43%) 61 (46.5%)
.2 85 (21%) 34 (26%)
months of age than the others. The present analysis, using latent class models, confirms these results, strengthening the importance
of these risk factors, which have been discussed elsewhere [11]. However, this approach, one among several population mixture models, provided a better understanding of the natural history of children haemoglobin levels by identifying new determinants of haemoglobin levels (i.e. placental malaria and the newborn anaemia) as well as the role played by mother’s anaemia as a predictor of belonging to the low latent trajectory. We also showed that the negative effect of sickle cell trait was more strongly marked within the low trajectory. In our preceding analysis using mixed models, we found that newborn anaemia and placental malaria were associated with a decreased haemoglobin level in the first 18 months of life. However, these associations were not significant (p= 0.104 andp= 0.190 respectively). This result strengthens the fact that taking into account the existence of a mixture of populations could help to identify covariates with significant but probably complex effect that cannot be easily identified under the hypothesis that all subjects belong to the same population. Finally, the innovative LCA suggests that the data are compatible with two levels of haemoglobin over time, high and low, concerning two-thirds and one-third of the sample, respectively.
Latent class analysis has been used extensively in criminology and behavioural research [22–24], less to date in public health research [25–27]. It is an extension of a mixed model and assumes the presence of and identifies latent groups of individuals who share a particular developmental trajectory of some attribute, thereby allowing a better understanding of the pattern of change in the variable of interest [15,16,28–30]. The other strength of this approach is that it reveals a predictor of belonging to the low haemoglobin group along with the effects of all other risk factors. Furthermore, it allows studying the effect of variables within trajectories and underlined the negative influence of sickle cell trait during infancy. Latent class analysis forms a part of mixture modeling, a widely applied data analysis approach used to identify unobserved heterogeneity in a population. Mixture modeling involved several techniques with potential differences [31]. We provided our model equation to take these potential differences into account and to make our results easily and clearly understood, despite technical considerations, with no risk of miss understand-ing. One limitation of our approach could be that each group has the same variance structure rather than a variance-covariance structure among time points.
Multiple indices have been described to identify clusters in Latent Class Analysis. To date, there is not common acceptance of the best criteria for determining the number of classes in mixture modeling, despite various suggestions [32]. Among them, several simulation studies indicated that the BIC performs well [33,34].
Table 2.Risk factors for children’s haemoglobin progression from 3 to 18 months of life in each latent class identified by the Latent Class Analysis, Benin, 2007–2010.
Covariates Estimation
Standard Errors
p -value
Intercept 10.17 0.11 ,1023
Maternal anaemia
(Reference = No)
Yes 20.07 0.06 0.275
Newborn anaemia
(Reference = No)
Yes 20.18 0.06 0.007
Placental malaria
(Reference = No)
Yes 20.20 0.09 0.039
Number of children’s malaria attack
(Reference = 0)
1 to 2 20.15 0.07
.2 20.26 0.08 0.005
Children’s gender
(Reference = Female)
Male 20.15 0.06 0.012
Maternal marital status
(Reference = Monogamous family)
Polygamous family 0.17 0.07 0.01
Sickle cell trait
(Reference = No)
Yes 20.27 0.07 ,1023
Maternal age
(Reference = Age#20)
21–25 0.25 0.10
26–30 0.28 0.10
$30 0.26 0.10 0.013
Children’s feeding in the first18 months 0.17 0.06 0.003
doi:10.1371/journal.pone.0050136.t002
Table 3.Effects of covariates among trajectories.
Variable High trajectory Low trajectory p-value*
Newborn anaemia 20.02 0.04 0.589
Placental malaria 20.0003 0.08 0.543
Number of children’s malaria attack 20.0248 0.001 0.988
Children’s gender 20.003 0.05 0.458
Maternal marital status 0.12 0.07 0.36
Sickle cell trait 20.037 20.25 0.023
Maternal age 20.046 0.08 0.25
Children’s feeding in the first18 months 0.087 0.095 0.326
More recently, Nylund et al. found that the Bootstrap Likelihood ratio test (BLRT) presented the best performances and that the second best index was the BIC. They also showed that the BLRT, does have its disadvantages such as the increased computation time [32], but this should not affect the fact that it is more powerful and accurate. Finally, the authors strongly recommended using the BIC as the first step. Here, we followed this recommendation, together with the criteria proposed by Andruff [15] based on the percentage of population included in each group. However, despite the fact that they are widely used in the literature [22,27,35], as they are partly based on the percentage of the sample within the trajectories, this choice is somewhat subjective. To take this point into account, we also used the Gateaux derivative method to determine the number of groups required to achieve the largest possible likelihood. This method has confirmed our choice of two trajectories for the changes in haemoglobin level, suggesting that the three-point solution may represent a local maximum of the log-likelihood.
Finally, to take into account the complexity and the possibilities of these population mixture models, it could be of great interest to pursue this exploration by using more indices to define the number of clusters and by adding a variance-covariance structure among time points. This could be proposed by using and comparing several modelling mixture methods in a near future for such complex data.
In the present study, maternal anaemia at delivery seems to be predictive of belonging to the low trajectory but has no direct effect on the changes in haemoglobin level over time. The association we found between the effect of maternal anaemia at delivery, and the absence of direct effect on the evolution of haemoglobin level during infancy, could apparently seems contradictory. Indeed this trajectory loses Hb over time, whereas the higher trajectory does not. One possible explanation could be that the association between maternal anaemia at delivery and haemoglobin level during infancy could be (at least partly) mediated through newborn anaemia. Indeed, inserting both maternal anaemia and newborn anaemia in the same model could result in collinearity, which could explain the apparent absence of effect of maternal anaemia on children haemoglobin evolution. However, maternal anaemia remained not significantly associated (p= 0.14) with the evolution of children haemoglobin progression even when included in a multivariate model without newborn anaemia. Furthermore, using the Bayesian Informative Criterion as criteria, the model with newborn anaemia was selected when compared to the model with maternal anaemia. Using haemoglobin level of mother at delivery as quantitative variable did not change these results (data not shown). Hence, this pattern of results can be interpreted as the fact that maternal anaemia stops having a negative effect at birth but that children born of an anaemic mother are probably disadvantaged during infancy. The mother’s anaemia could also be interpreted as an indirect marker of a woman’s and/or a family’s disadvantage because of poor socioeconomic status that could be associated with inadequate nutrition during infancy. The importance of adequate nutrition is illustrated by the positive effect of nutritional status on the haemoglobin progression during infancy.
The mechanisms by which a newborn’s anaemia at birth can affect haemoglobin level over time have not yet been clearly described. A period of rapid growth, especially during infancy, results in substantial demands for iron. In developed countries where breastfeeding is not common, mothers often use children formula fortified with iron in order to supplement the children’s needs. This is not necessary with breastfeeding, which provides high concentrations of highly absorbable iron. In developing
countries where all children are routinely breastfed during the first year of life, we could expect that breastfeeding compensates iron requirements and corrects anaemia. However, the interactions between iron intakes and stores are complex and it has been shown that exclusive breastfeeding at 4 months of life was protective of iron status and of iron deficiency-anaemia at 6 months, compared with children receiving early complementary food [36]. In our study population, breastfeeding is far from exclusive, and at 4 months of age only 18% of children were exclusively breastfed (data not shown). Moreover, the mothers from our sample are could be iron depleted. Put together our results show that both maternal anaemia at delivery and newborn anaemia at birth are associated at different level, with haemoglobin progression in children during the first 18 months of age. These two risk factors could interact with each other and furthermore interact with feeding practices and have to be taken into account to define preventive strategy.
In this study, placental malaria was associated with a low haemoglobin level in the first18 months of life. This association was not significant during our first analysis [11]. This association has already been described by Reddet al. (1994), who have shown that placental malaria was associated with anaemia around 2 months of age [37]. In cases of iron deficiency during pregnancy, expression of placental transport proteins for iron increases, allowing a greater transport of iron to the foetus [38,39]. In case of placental malaria, a thickening of the trophoblastic basement membrane has been described, damaging the placenta’s active transfer capacity [40]. It can therefore be assumed that placental malaria reduces the transfer of iron from the mother to her children, increasing the newborn’s iron deficiency. However, a more indirect explanation can be proposed that is consistent with the effect of placental malaria on haemoglobin level over time. Indeed, some authors have hypothesized that placental malaria is associated with an immune tolerance phenomenon [10,41]. Children born of infected placenta are more susceptible to malaria infection. As both the number of malaria attacks during the follow-up and placental malaria were independently significantly associated with the level of haemoglobin in the first18 months, we can argue that children born of mothers with placental malaria are more susceptible not only to malaria but also to other infections, as we have recently shown in this same cohort [42]. These children, frailer and more often infected, have a higher risk of developing anaemia.
Our study also described a negative effect of sickle cell trait among trajectories. As this result was obtained during multivariate analysis with both variables (i.e. malaria and sickle cell) we can argue that the sickle cell trait effect is independent of the protection against clinical malaria classically described [43,44]. Our hypothesis is that this effect could be explained by an intrinsic role of sickle cell trait in anaemia, even for heterozygous individuals. To our knowledge, one study has described an association between anaemia and sickle cell trait [45] but this association has not been confirmed to date. In addition, it has been described that haematuria, both microscopic and macroscopic, is one of the most frequent complication of sickle cell trait [46–48]. In our sample no macroscopic haematuria was found and we did not search a microscopic haematuria. However although we could hypothesize that children with sickle cell trait experienced microscopic haematuria, we cannot explain clearly the different effect of this variable in each group.
dispensaries of the area. The team involved in the follow-up was different and the population was monitored equivalently and independently of the Hb levels or of they life conditions. Furthermore, as the families involved in this program were very similar we do not think that a ‘‘cohort effect’’ could represent a limitation of the study.
In conclusion, this study, using latent class analysis models, shows that the occurrence of a malaria attack during follow-up, male gender, sickle cell trait carriage, children living in a polygamous family, children with good feeding practices, newborn anaemia, placental malaria were associated with haemoglobin level in children and that maternal anaemia was a predictor of a low haemoglobin level trajectory in children in their first 18 months of life. Latent class approach could be applied more frequently to analyse longitudinal data when the existence of groups with distinct pattern of evolution is suspected. This assumption cannot be adequately explored with mixed models. The prevalence of anaemia during pregnancy and in the newborn
is very high in developing countries, 40% and 61%, respectively, in our study in Benin. There is a need to increase actions that target the prevention of maternal anaemia as well as placental malaria and newborn anaemia.
Acknowledgments
We thank the entire staff of the three maternity hospitals (Avame´, Cada, Gare), and the study’s participants. We gratefully thank our field team and the Centre National Hospitalo-Universitaire of Cotonou who carried out the cohort’s follow-up and the medical care.
Author Contributions
Conceived and designed the experiments: KGK AG. Performed the experiments: KGK SO ALP GC AG. Analyzed the data: KGK GC AG. Contributed reagents/materials/analysis tools: KGK SO ALP GC AM AG. Wrote the paper: KGK SO GC ALP AM AG.
References
1. World Health Organization (2008) Worldwide prevalence of anaemia 1993– 2005: WHO global database on anaemia Geneva, Switzerland: World Health Organization.
2. McLean E, Cogswell M, Egli I, Wojdyla D, de Benoist B (2009) Worldwide prevalence of anaemia, WHO Vitamin and Mineral Nutrition Information System, 1993–2005. Public health nutrition 12: 444–454.
3. Hamalainen H, Hakkarainen K, Heinonen S (2003) Anaemia in the first but not in the second or third trimester is a risk factor for low birth weight. Clin Nutr 22: 271–275.
4. Levy A, Fraser D, Katz M, Mazor M, Sheiner E (2005) Maternal anemia during pregnancy is an independent risk factor for low birthweight and preterm delivery. European Journal of Obstetrics & Gynecology and Reproductive Biology 122: 182–186.
5. Shobeiri F, Begum K, Nazari M (2006) A prospective study of maternal hemoglobin status of Indian women during pregnancy and pregnancy outcome. Nutrition Research 26: 209–213.
6. de Pee S, Bloem M, Sari M, Kiess L, Yip R, et al. (2002) The high prevalence of low hemoglobin concentration among Indonesian infants aged 3–5 months is related to maternal anemia. Journal of Nutrition 132: 2215.
7. Kilbride J, Baker TG, Parapia LA, Khoury SA, Shuqaidef SW, et al. (1999) Anaemia during pregnancy as a risk factor for iron-deficiency anaemia in infancy: a case-control study in Jordan. International Journal of Epidemiology 28: 461–468.
8. Preziosi P, Prual A, Galan P, Daouda H, Boureima H, et al. (1997) Effect of iron supplementation on the iron status of pregnant women: consequences for newborns. The American journal of clinical nutrition 66: 1178–1182. 9. Le Port A, Cottrell G, Martin-Prevel Y, Migot-Nabias F, Cot M, et al. (2012)
First malaria infections in a cohort of infants in Benin: biological, environmental and genetic determinants. Description of the study site, population methods and preliminary results. BMJ Open 2: e000342.
10. Le Port A, Watier L, Cottrell G, Oue´draogo S, Dechavanne C, et al. (2011) Infections in Infants during the First 12 Months of Life: Role of Placental Malaria and Environmental Factors. PLoS ONE 6: e27516.
11. Koura GK, Ouedraogo S, Le Port A, Watier L, Cottrell G, et al. (2011) Anaemia during pregnancy: impact on birth outcome and infant haemoglobin level during the first 18 months of life. Tropical Medicine & International Health: 10.1111/j.1365-3156.2011.02932.x.
12. Hagenaars JA, McCutcheon AL (2002) Applied Latent Class Analysis. Cambridge, UK: Cambridge University Press.
13. McCutcheon AL (1987) Latent class analysis. Beverly Hills, CA: Sage Publications.
14. WHO/UNICEF (2010) Indicators for assessing infant and young child feeding practices - Part II : Measurement.
15. Andruff H, Carraro N, Thompson A, Gaudreau P, Louvet B (2009) Latent class growth modelling: a tutorial. Tutorials Quantitative Methods Psychol 5: 11–24. 16. Nagin DS (2005) Group-based Modeling of Development. Cambridge, MA:
Harvard University Press.
17. Lindsay B, Clogg CC, Grego J (1991) Semiparametric Estimation in the Rasch Model and Related Exponential Response Models, Including a Simple Latent Class Model for Item Analysis. Journal of the American Statistical Association 86: 96–107.
18. Rabe-Hesketh S, Skrondal A, Pickles A (2004) GLLAMM Manual. UC Berkeley Division of Biostatistics Working Paper Series Working Paper 160. Biostats.be-press website. Available: http://biostats.beBiostats.be-press.com/cgi/viewcontent. cgi?article = 1160&context = ucbbiostat. Accessed 2012 Oct 25.
19. Skrondal A, Rabe-Hesketh S (2004) Generalized Latent Variable Modeling: Multilevel, Longitudinal and Structural Equation Models. Boca Raton, FL: Chapman & Hall/CRC.
20. Rabe-Hesketh S, Skrondal A (2008) Multilevel and longitudinal modeling using Stata. College Station, TX: Stata Press.
21. McElroy PD, Lal AA, Hawley WA, Bloland PB, Kuile FO, et al. (1999) Analysis of repeated hemoglobin measures in full-term, normal birth weight Kenyan children between birth and four years of age. III. The Asemobo Bay Cohort Project. Am J Trop Med Hyg 61: 932–940.
22. Barker ED, Seguin JR, White HR, Bates ME, Lacourse E, et al. (2007) Developmental Trajectories of Male Physical Violence and Theft: Relations to Neurocognitive Performance. Arch Gen Psychiatry 64: 592–599.
23. Bernat DH, Erickson DJ, Widome R, Perry CL, Forster JL (2008) Adolescent Smoking Trajectories: Results from a Population-Based Cohort Study. Journal of Adolescent Health 43: 334–340.
24. Hoeve M, Blokland A, Dubas J, Loeber R, Gerris J, et al. (2008) Trajectories of Delinquency and Parenting Styles. Journal of Abnormal Child Psychology 36: 223–235.
25. Li C, Goran MI, Kaur H, Nollen N, Ahluwalia JS (2007) Developmental Trajectories of Overweight During Childhood: Role of Early Life Factors[ast]. Obesity 15: 760–771.
26. Broadbent JM, Thomson WM, Poulton R (2008) Trajectory Patterns of Dental Caries Experience in the Permanent Dentition to the Fourth Decade of Life. Journal of Dental Research 87: 69–72.
27. Østbye T, Malhotra R, Landerman LR (2011) Body mass trajectories through adulthood: results from the National Longitudinal Survey of Youth 1979 Cohort (1981–2006). International Journal of Epidemiology 40: 240–250.
28. Nagin DS, Tremblay RE (2005) Developmental trajectory groups: fact or a useful statistical fiction? Criminology 43: 873–904.
29. Nagin DS, Odgers CL (2010) Group-Based Trajectory Modeling in Clinical Research. Annual Review of Clinical Psychology 6: 109–138.
30. Jones BL, Nagin DS, Roeder K (2001) A SAS Procedure Based on Mixture Models for Estimating Developmental Trajectories. Sociological Methods & Research 29: 374–393.
31. Muthe´n B (2004) Latent variable analysis. Growth Mixture Modeling and Related Techniques for Longitudinal Data. In: Kaplan D, editor. Handbook of quantitative methodology for the social sciences Newbury Park: CA: Sage. 345– 368.
32. Nylund KL, Asparouhov T, Muthen BO (2007) Deciding on the Number of Classes in Latent Class Analysis and Growth Mixture Modeling: A Monte Carlo Simulation Study. Structural Equation Modeling: A Multidisciplinary Journal 14: 535–569.
33. Roeder K, Wasserman L (1997) Practical Bayesian density estimation using mixtures of normals. Journal of the American Statistical Association: 894–902. 34. Jedidi K, Jagpal HS, DeSarbo WS (1997) Finite-mixture structural equation
models for response-based segmentation and unobserved heterogeneity. Marketing Science: 39–59.
35. Mora PA, Bennett IM, Elo IT, Mathew L, Coyne JC, et al. (2009) Distinct trajectories of perinatal depressive symptomatology: evidence from growth mixture modeling. American journal of epidemiology 169: 24–32.
36. Van Rheenen P, De Moor L, Eschbach S, Brabin B (2007) A cohort study of haemoglobin and zinc protoporphyrin levels in term Zambian infants: effects of iron stores at birth, complementary food and placental malaria. European journal of clinical nutrition 62: 1379–1387.
38. Barrett J, Whittaker P, Williams J, Lind T (1994) Absorption of non-haem iron from food during normal pregnancy. British Medical Journal 309: 79. 39. Gambling L, Danzeisen R, Gair S, Lea RG, Charania Z, et al. (2001) Effect of
iron deficiency on placental transfer of iron and expression of iron transport proteins in vivo and in vitro. Biochemical Journal 356: 883–889.
40. Yamada M, Steketee R, Abramowsky C, Kida M, Wirima J, et al. (1989) Plasmodium Falciparum Associated Placental Pathology: A Light and Electron Microscopic and Immunohistologic Study. The American journal of tropical medicine and hygiene 41: 161–168.
41. Mutabingwa TK, Bolla MC, Li JL, Domingo GJ, Li X, et al. (2005) Maternal Malaria and Gravidity Interact to Modify Infant Susceptibility to Malaria. PLoS Med 2: e407.
42. Idjradinata P, Pollitt E (1993) Reversal of developmental delays in iron-deficient anaemic infants treated with iron. Lancet 341: 1–4.
43. Williams TN, Mwangi TW, Wambua S, Alexander ND, Kortok M, et al. (2005) Sickle Cell Trait and the Risk of Plasmodium falciparum Malaria and Other Childhood Diseases. Journal of Infectious Diseases 192: 178–186.
44. Gong L, Maiteki-Sebuguzi C, Rosenthal PJ, Hubbard AE, Drakeley CJ, et al. (2012) Evidence for both innate and acquired mechanisms of protection from Plasmodium falciparum in children with sickle cell trait. Blood 119: 3808–3814. 45. Evans RW (1945) Anaemia associated with the sickle cell trait in British West African natives. Transactions of the Royal Society of Tropical Medicine and Hygiene 39: 207–220.
46. Tsaras G, Owusu-Ansah A, Boateng FO, Amoateng-Adjepong Y (2009) Complications Associated with Sickle Cell Trait: A Brief Narrative Review. The American Journal of Medicine 122: 507–512.
47. Sears DA (1978) The morbidity of sickle cell trait: a review of the literature. Am J Med 64: 1021–1036.