A R C H I V E S
o f
F O U N D R Y E N G I N E E R I N G
Published quarterly as the organ of the Foundry Commission of the Polish Academy of Sciences
ISSN (1897-3310)
Volume 7
Issue 3/2007
87 – 92
18/3
Analysis of Carbon Diffusion during
Bainite Transformation in ADI
Z. Ławrynowicz *, S. Dymski
Department of Materials Science and Engineering, Mechanical Engineering Faculty,
University of Technology and Life Sciences, al. Kaliskiego 7, 85-796 Bydgoszcz, Poland
* e-mail: [email protected]
Received on: 17.04.2007; Approved for printing on: 27.04. 2007
Abstract
The paper presents an investigation of the time required for the diffusion of carbon out of supersaturated sub-units of ferrite into the retained austenite. The analytical model estimates the decarburisation time of the sub-units of supersaturated bainitic ferrite. The purpose of the present paper is to demonstrate how a thermodynamic method can be used for solving a problem of the decarburisation of bainite subunits and carbon diffusion distances in the matrix of ADI. This should in principle enable to examine the partitioning of carbon from supersaturated ferrite plates into adjacent austenite and the carbon content in retained austenite using analytical method.
The diffusion coefficient of carbon in austenite is very sensitive to the carbon concentration and this has to be taken into account in treating the large concentration gradients that develop in the austenite. The results are discussed in the context of displacive mechanism of bainite transformation. Experimental measurements of volume fraction of bainitic ferrite and volume of the untransformed austenite indicate that there is a necessity of carbides precipitation from austenite. The necessary carbon diffusion distance in austenite also illustrates that the estimated time is not capable of decarburising the ferrite subunits during the period of austempering. A consequence of the precipitation of cementite from austenite during austempering is that the growth of bainitic ferrite can continue to larger extent and that the resulting microstructure is not an ausferrite but is a mixture of bainitic ferrite, retained austenite and carbides.
Keywords: Carbon diffusion; Decarburisation; Bainite; Ductile iron ADI
1. Austempering process
In 1948 the invention of ductile iron was announced jointly by the British Cast Iron Research Association (BCIRA) and the International Nickel Company (INCO). By the 1950’s, both the material, ductile iron, and the austempering process had been developed. By the 1990’s, ASTM A897-90 and ASTM A897M-90 Specifications for Austempered Ductile Iron Castings were published in the US that consist the five Grades of ADI according to ASTM A897/897M.
In addition, a new term to describe the matrix microstructure of ADI as “ausferrite” was introduced.
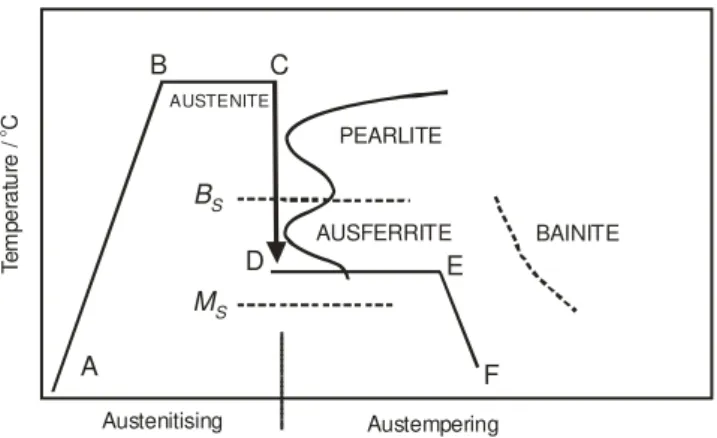
Figure 1 shows a schematic of the austempering process that includes the following major steps:
1. Heating to the austenitising temperature (A to B) 2. Austenitising (B to C)
3. Cooling to the austempering temperature (C to D)
4. Isothermal heat treatment at the austempering temperature (D to E)
5. Cooling to room temperature (E to F)
A
B C
D E
F
BAINITE PEARLITE
AUSFERRITE AUSTENITE
BS
MS
Austenitising Austempering
T
e
m
p
er
at
ur
e /
C
o
Fig. 1. Schematic of the austempering process
The ductile iron should be held at austenitising temperature and for a time sufficient to create an austenite matrix that is saturated with carbon.
The choice of austempering temperature and time is dependent on the final properties desired. The components are held for a sufficient time at temperature for ausferrite to form. Ausferrite consists of ferrite in a high carbon, stabilized austenite. If ADI is held for long time periods, the high carbon austenite will eventually undergo a transformation to bainite, the two phase ferrite and carbide (α + Fe3C). In order for this transformation to
occur, longer periods of time are typically needed – much longer than would be economically feasible for the production of ADI. Once the ausferrite has been produced, the components are cooled to room temperature. The cooling rate will not affect the final microstructure as the carbon content of the austenite is high enough to lower the martensite start temperature to a temperature significantly below room temperature.
Also nodule count in ductile iron to be austempered and its uniform distribution can influence on carbon diffusion distance. Low nodule counts lead to larger spacing between the graphite nodules and larger regions of segregation. In the worst case scenario, these regions can become so heavily segregated that they do not fully transform during austempering, resulting in the formation of low carbon austenite or even martensite. Higher nodule counts will break up the segregated regions.
The purpose of the present paper is to demonstrate how a thermodynamic method can be used for solving a problem of the decarburisation of bainite subunits and carbon diffusion distances in the matrix of ADI. This should in principle enable to examine the partitioning of carbon from supersaturated ferrite plates into adjacent austenite and the carbon content in retained austenite using analytical method.
2. Material and methods
The chemical composition of the experimental ductile iron is listed in Table 1. The concentration of alloying elements in the matrix is obtained from the chemical analysis. Ductile iron blocks were produced in a commercial foundry furnace. The melt was poured into a standard Y block sands molds (ASTM A-395), which ensured sound castings. Specimens austenitised at Tγ=950 and 830oC for 60 minutes were rapidly transferred to a salt bath at
austempering temperatures 250, 300, 350 and 400oC, held for 15, 30, 60, 120 and 240 minutes and then water quenched to room temperature. The microstructure of the as-cast material matrix contains 40% ferrite and 60% pearlite, however graphite nodules in material is 11.5%.
After heat treatment, the samples were prepared for metallographic analysis. The samples were etched using 2% nital. Optical micrographs were taken with a Nikon camera attached to a light microscope.
Table 1.
Chemical composition of ductile cast iron ADI, wt-%
C Si Mn P S Mg Cr Ni Mo 3.21 2.57 0.28 0.06 0.01 0.024 0.036 0.098 0.015
The X-ray investigations were performed on the specimens heat treated after specific time of the isothermal bainite reaction at the given temperature. The total volume fraction of the retained austenite was measured from the integral intensity of he (111)γ and (011)α peaks. The presence of high silicon content in ADI retards the formation of cementite in ferrite and austenite. Then, the measurements of carbon concentration in retained austenite were carried out by using X-ray diffraction. The carbon concentration was calculated from measured lattice parameter of the retained austenite. The 2θ values for austenite peaks were used to calculate the d spacing with Bragg’s law and then the lattice parameters. The lattice parameter of austenite (aγ) is related
to the known relationship between the parameter and the carbon concentration [6]:
aγ (nm)=0.3573 + 0.0033xγ (1)
where xγis the carbon concentration in austenite, in weight %. The matrix carbon concentration,xγm, of the ductile iron was also determined experimentally with Dron 1.5 diffractometer using Co Kαradiation on specimens austenitised at 950 and 8300C for 60 minutes and quenched to ambient temperature. It was found that after quenching from austenitising temperature 9500C the calculated carbon content in matrix is xγm=1.044%C and measured carbon content is xγm=1.05%C, and after quenching from 830oC the calculated carbon content in matrix is
m
xγ =0.659%C and measured carbon content is xγm=0.65%C, thus, the measured values were taken for further calculation.
3. Development of bainitic sheaf
austenite g rain boundary
t
1t
2t
3t < t < t
1 2 3bainite sub-unit bainite sheaves
p a rtitioning of c a rbo n e xc ess into the surround ing a uste nite
next parallel sub-unit of the sa me sheaf has to grow from an adjac ent c arbon enric hed austenite layer
2
3
1 1
1
1 1
1
1 1
2
2
2
2
2
2 2
3
3 3
1
3 3
3
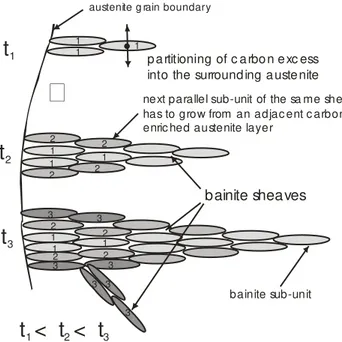
Fig. 2. Schematic of stages of development of bainitic sheaf (t1, t2
and t3 – time of reaction). 1–denotes subunits formed at early
stage of transformation from austenite whose carbon concentration is initially identical to that of bulk alloy (region of
upper bainite), 2 and 3–denotes subunits formed from enriched austenite as a consequence of carbon redistribution occurring after
the growth event (region of lower bainite) [7]
Suppose that the subunit denoted 1 of bainitic ferrite forms without diffusion, but any excess carbon is soon rejected into the residual austenite. Consequently, all the subunits denoted 1 were formed at the early stage of transformation from austenite whose carbon concentration is initially identical to that of bulk alloy (region of upper bainite). The subunits denoted 2 and 3 were formed from enriched austenite as a consequence of carbon redistribution occurring after the growth event (region of lower bainite). The transition between these two regions is not sharply defined. There is then the possibility of the reaction beginning with the growth of upper bainite but decomposing to lower bainite from the enriched austenite at the later stages of reaction. This explains why both upper and lower bainite sometimes can be found in the same temperature.
Figure 3 illustrates this situation in relation to the phase diagram. When the plate of bainite forms without diffusion, but any excess carbon is soon rejected into the residual austenite. The next plate of bainite then has to grow from carbon-enriched austenite (points 2, 3 and 4 in Fig. 3). This process must cease when the austenite carbon concentration reaches the T0 curve. The reaction is said to be incomplete, since the austenite has not achieved its equilibrium composition (given by the Ae3' curve) at the point the reaction stops.
The amount of bainite that forms increases as the transformation temperature is reduced below the BS temperature.
These observations are understood when it is realised that growth must cease if the carbon concentration in the austenite reaches the
T0 curve of the phase diagram. Since this condition is met at ever
increasing carbon concentrations when the transformation temperature is reduced, more bainite can form with greater undercoolings below BS. But the T0 restriction means that
equilibrium, when the austenite has a composition given by the
Ae3' phase boundary, can never be reached, as observed
experimentally [6-9]. Moreover, the carbon concentration of the residual austenite increases during bainitic transformation as a consequence of the increasing volume fraction of bainitic ferrite (Fig. 3).
Fig. 3. Illustration of enrichment in the carbon concentration of untransformed austenite as the bainite reaction proceeds. During
isothermal transformation, a plate of bainite grows without diffusion and after this event excess of carbon is partitioned into the residual austenite. It means that the partitioning of carbon into
the residual austenite occurs subsequent to transformation of subunits of bainitic ferrite. The next plate therefore has to grow
from carbon-enriched austenite (it starts from the bulk carbon concentration
x
and passes through points 1, 2 and 3) [7]4. Method of calculation of the
redistribution of carbon
The time td needed to decarburise the ferrite is intuitively expected at least to be comparable to that required for a subunit to complete its growth. If td is small relative to the time required to relieve the carbon supersaturation by the precipitation of carbides within the ferrite, then upper bainite is obtained, otherwise lower bainite forms [7].
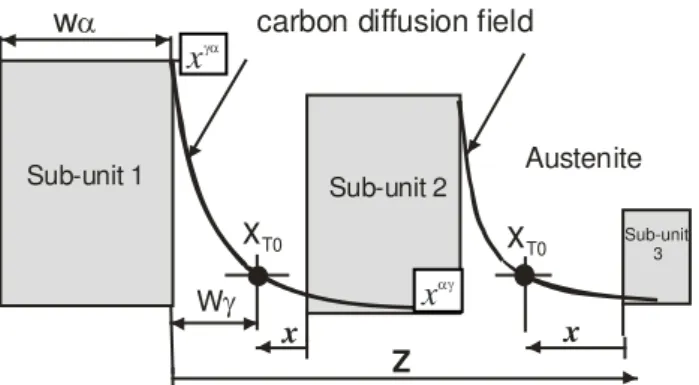
Kinsman and Aaronson [10] first considered the kinetics of the partitioning of carbon from bainitic ferrite of the same composition as the parent phase. For a plate of thickness wα the flux of carbon is defined along a coordinate z normal to the α/γ interface, with origin at the interface and z being positive in the austenite (Fig. 4).
The method used to calculate the time of decarburizing of bainitic ferrite subunits is based on the hypothesis that transformation to bainite can only occur in regions of austenite where
0
T
x
xγ ≤ , where xγis the carbon concentration in austenite and
0
T
x
is the carbon concentration corresponding to theT
0 curve. As a subunit of bainitic ferrite forms it partitions its excess carbon into the retained austenite. This creates a carbonT1
T2
1 2
1 2 3 4
x
'
Ae
30
T
Carbon in Austenite
T
em
per
at
ur
diffusion field around the subunit. Another parallel subunit (of the same sheaf) which forms subsequently can only approach the original subunit to a point where
0
T
x
x
γ≤
. The method assumes that the interval between subunit formations is larger than the time required to decarburise each subunit.Fig. 4. Schematic diagram of method used in estimating the time of decarburising the bainitic ferrite sub-units. Sub-unit 1 forms first and subunit 2 and 3 and next is allowed to approach it to point where
0
T
x
x
γ≤
(distance of this point from subunit 1 is denotedw
γ ). This is in fact the thickness of the retained austenite film. The mean thickness of the retained austenite films is almost tenfold thinner (0.01-0.02µm) than the average thickness of the bainitic ferrite subunits (∼0.2µm).5. Decarburisation of supersaturated
bainitic ferrite laths
The problem therefore becomes a calculation of the sum of the decarburisation times of all bainite subunits that are existing on the coordinate connecting the nearest graphite nodules Fig. 5).
The time needed to decarburize the ferrite matrix between the adjacent nodules of graphite tdz:
∑
=
i di
dz
t
t
(2)where
t
di is the time required to decarburise individual supersaturated bainitic ferrite subunit of specific thicknessw
αi.Because of the inhomogeneous distribution of carbon and other solutes in the matrix after transformation to bainite the retained austenite is enriched to a greater extent in the immediate vicinity to bainite platelets or in the region trapped between the platelets and in the eutectic cell boundary (Fig. 5) while other region contains relatively poor carbon [11]. The above effect can be exaggerated in ADI, since cast iron is usually extremely segregated. Martensite is usually found to be in the cell boundary which solidified last [12]. It indicates that the austenite in cell boundary is less enriched with carbon, and therefore is thermally unstable.
Eutectic cell boundary
Graphite
z
Si, Ni, Cu Si, Ni, Cu Cr, Mn, Mo, C
Graphite
Fig. 5. Schematic of the direction of solute segregation between the adjacent graphite nodules
From the mass balance for carbon it follows that [13]:
∫
∞
=
−
=
−
0 z
d
}
x
]
dz
t
,
z
{
x
[
)
x
x
)(
w
5
.
0
(
α αγ γ (3)where x is the average mole fraction of carbon in the alloy and
αγ
x and xγα are the paraequilibrium carbon concentration in ferrite and austenite respectively. Since the diffusion rate of carbon in austenite is slower than in ferrite the rate of decarburization will be determined by the diffusivity in the austenite and the concentration of carbon in austenite at the interface remains constant for times 0<t<td after which it
steadily decreases as the austenite becomes homogeneous in composition. The equation corrects an error in the original treatment, the error had the effect of allowing td →0 as the upper integration limit →∞. The function xγ is given by:
}
)
Dt
(
2
/
z
{
erfc
)
x
x
(
x
x
γ=
+
γα−
d 0.5 (4)This assumes that for t<td, the concentration of carbon in the
austenite at the interface is given by xγα.
The diffusion coefficient of carbon in austeniteD{x}, is very sensitive to the carbon concentration and this has to be taken into account in treating the large concentration gradients that develop in the austenite. It is clearly necessary to know D{x} at least over a range
x
→
x
γα, although experimental determinations of} x {
D do not extent beyond
x
=
0
.
06
. The value of D was calculated as discussed in Ref. [14]. The good approximation of the dependent diffusivity of carbon in austenite can be a weighted average diffusivity D[15]. Taking into account carbon concentration gradients it has been demonstrated that for most purposes a weighted average diffusivity D can adequately represent the effective diffusivity of carbon [15-17]. Weighted average diffusivity D is calculated by considering the carbon concentration profile in front of the moving ferrite interface as given by the following equation:∫
−
=
γα
γα
x
x
(
x
x
)
Ddx
D
(5)Sub-unit 1 Sub-unit 2
Sub-unit 3
carbon diffusion field
w
α
W
γ
x
T0Austenite
Z
x
T0 γαx
αγ
x
On carrying the integration, the time required to decarburise a supersaturated bainitic ferrite subunit of thickness wα is given by [13]:
) x x ( D 16
) x x ( w t
2 2
d
− −
= α
π
γα αγ (6)where: x is the average carbon concentration in the alloy,
αγ
x and xγαare the carbon concentrations in ferrite and austenite respectively, when the two phases are in paraequilibrium.
6. The calculation of decarburisation
times and carbon diffusion distances
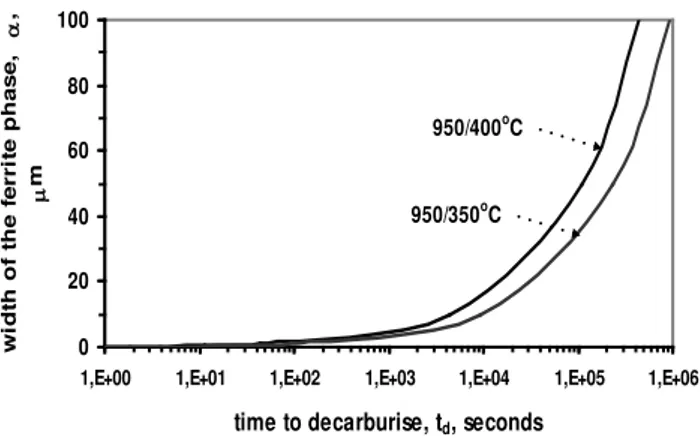
For investigated ductile cast iron ADI our calculations show that td increases sharply as temperature decreases.
The calculated times of partitioning are shown in Fig. 6 and 7 for different thickness of bainitic ferrite phase (for wo=0.1, 0.2,
0.5, 1.0, 10 and 100 µm) and austenitising and austempering temperatures. The decarburisation time td is a function of α phase
width and increases with decreasing austempering temperature because the diffusion coefficient of carbon also decreases with temperature (Table 2). The decarburisation time also increases as the thickness of the ferrite phase increases (Fig. 6 and 7).
The average carbon diffusion distances also depend on the mean spacing among the graphite nodules. Figure 8 shows a photomicrograph that contains graphite nodules with diverse distance among them, changing from about 150 to 50 µm (marked z1 and z2 in Fig. 8). Thus, the average distance among nodules in
examined ADI is assumed about 100 µm. Table 2.
The calculated diffusion coefficients of carbon in austeniteD{x}
and a weighted average diffusivity Dafter austenitisation at 950 and 830 oC and austempering at 400 and 350 oC.
Ti, oC D [m2/s]
D
[m2/s]Austenitisation temperature, Tγ= 950oC 400 0.3574 x 10⁻¹⁵ 0.1672 x 10⁻¹⁴ 350 0.4688 x 10⁻¹⁶ 0.5013 x 10⁻¹⁵ 300 0.4328 x 10-17 *
250 0.2544 x 10⁻¹⁸ *
Austenitisation temperature, Tγ=830oC 400 0.2088 x 10⁻¹⁵ 0.1427 x 10⁻¹⁴ 350 0.2714 x 10⁻¹⁶ 0.4287 x 10⁻¹⁵ 300 0.2482 x 10-17 *
250 0.1445 x 10⁻¹⁸ *
* Diffusion calculation outside of permitted range. Siller-McLellan model
fails at high carbon concentrations evaluateD.
0 20 40 60 80 100
1,E+02 1,E+03 1,E+04 1,E+05 1,E+06
tim e to decarburise, td, seconds
w
id
th
o
f t
h
e
f
e
rr
it
e
p
h
a
s
e
, α
,
µ
m
830/400o
C 830/350o
C
950/400o
C
950/350o
C
Fig. 6. The calculated decarburisation times for a given width of ferrite phase in investigated ADI after austenitisation at 950
and 830 oC and austempering at 400 and 350 oC. The realationship (6) has been used for calculations
0 20 40 60 80 100
1,E+00 1,E+01 1,E+02 1,E+03 1,E+04 1,E+05 1,E+06
time to decarburise, td, seconds
w
id
th
o
f t
h
e f
er
ri
te p
h
ase,
α
,
µ
m
950/400oC
950/350oC
Fig. 7. T
he calculated times for decarburisation of ferrite plateswith different thickness after austenitisation at 950oC
Strukturażeliwa sferoidalnego po hartowaniu z temperatury Tγ= 950oC, podchładzaniu do temperatury Tpi= 350oC i wygrzewaniu w czasieτpi= 240 min. Trawienie nitalem.
Pow. 500x 40 mµ
Z
1Z
2Furthermore, it is generally observed (Fig. 8) that the
width of ferrite laths is highly diverse. This reflect the
possibility that cementite can precipitate in thicker bainite
laths (when
t
dis a long period of time) and in thinner
laths has not during isothermal transformation. It is also
consistent with the fact that upper and lower bainite often
form at the same temperature in a given steel [7,9,18,19].
The calculated average carbon diffusion distances over
specific periods of time (100, 1000 and 10000 s) are
shown in Table 3.
Table 3.
The calculated average carbon diffusion distances z after
100,
1000 and 10000 seconds
during austemperingat 400 and
350
oC after austenitisation at 950 and 830
oC.
Tγ, 950oC
t
D
2
z
=
, m for time, t, secondsTi, oC 100 seconds 1000 seconds 10000 seconds 400 8.178x10⁻⁷ 25.861x10⁻⁷ 81.78x10⁻⁷ 350 44.779x10⁻⁸ 141.605x10⁻⁸ 447.794x10⁻⁸ Tγ,
830oC
t
D
2
z
=
, m for time, t, seconds,Ti, oC 100 1000 10000 400 7.555x10⁻⁷ 23.891x10⁻⁷ 75.551x10⁻⁷ 350 41.410x10⁻⁸ 130.950x10⁻⁸ 414.101x10⁻⁸
7. Conclusions
The paper presents an investigation of the time required for the diffusion of carbon out of supersaturated subunits of ferrite into the retained austenite. This should in principle enable to examine the partitioning of carbon from supersaturated ferrite plates into adjacent austenite and calculate the carbon diffusion distance in ADI matrix using analytical method. The results are discussed in the context of displacive mechanism of bainite transformation. The following conclusions were reached: 1. The bainite transformation in ductile cast iron is essentially
identical to that in steel.
2. Analytical calculations of the time required for the diffusion of carbon out of supersaturated subunits of ferrite into the retained austenite indicate that there is a necessity of carbides precipitation from ferrite.
3. The necessary carbon diffusion distance in austenite also illustrates that the estimated time is not capable of decarburising the ferrite subunits during the period of austempering.
4. A consequence of the precipitation of cementite from ferrite or/and austenite during austempering is that the growth of bainitic ferrite can continue to larger extent and that the resulting microstructure is not an ausferrite but is a mixture of bainitic ferrite, retained austenite and carbides.
References
[1] L.C. Chang, Carbon content of austenite in austempered ductile iron, Scripta Materialia, Vol.39, No 1, (1998) 35-38. [2] S. Pietrowski, Nodular cast iron of bainitic ferrite structure with austenite or bainitic structure, Archives of Materials Science, vol. 18, No.4 (1997) 253-273. (in Polish).
[3] S.E. Guzik, Austempered cast iron as a modern
constructional material, Inżynieria Materiałowa, nr 6
(2003) 677-680. (in Polish).
[4] H.K.D.H. Bhadeshia, D.V. Edmonds, Bainite in silicon steels: new composition-property approach, Metal Science Vol. 17 (1983) 420-425.
[5] O. Eric at al., The austempering study of alloyed ductile iron, Materials & Design, vol. 27 (2006) 617-622.
[6] Z. Ławrynowicz, S. Dymski, Mechanism of bainite
transformation in ductile iron ADI, Archives of Foundry Engineering, PAN, Vol.6, No 19, (2006) 171-176. (in Polish).
[7] Z. Ławrynowicz, Transition from upper to lower bainite in
Fe-C-Cr steel, Materials Science and Technology, Vol.20 (2004) 1447-1454.
[8] Z. Ławrynowicz, S. Dymski, Application of the
mechanism of bainite transformation to modelling of proce-ssing window in ductile iron ADI, Archives of Foundry Engineering, PAN, Vol.6, No 19, (2006) 177-182. (in Polish).
[9] H.K.D.H. Bhadeshia, Bainite in Steels, Institute of Materials, London, 1-458, 1992.
[10]K.R. Kinsman, H.I. Aaronson, The transformation and hardenability in steels, Climax Molybdenum Company, Ann Arbor, MI, p.39, 1967.
[11]G.J. Shiflet, R.E. Hackenberg, Partitioning and the growth of bainite, Scripta Materialia, Vol.47 (2002) 163-167. [12]A. Kutsov at al., Formation of bainite in ductile iron,
Materials Sci. and Engineering A273-275 (1999) 480-484. [13]H.K.D.H. Bhadeshia, J.W. Christian, Bainite in Steels,
Metallurgical Transactions A, 21A (1990) 767-797. [14]H.K.D.H. Bhadeshia, Diffusion of carbon in austenite,
Metal Science, Vol.15 (1981) 477-479.
[15]R.H. Siller, R.B. McLelan, The Application of First Order Mixing Statistics to the Variation of the Diffusivity of Carbon in Austenite, Metallurgical Transactions Vol.1 (1970) 985-988.
[16]Z. Ławrynowicz, Criticism of selected methods for
diffusivity estimation of carbon in austenite, Zeszyty Naukowe ATR nr 216, Mechanika 43, (1998) 283-287. (in Polish).
[17]Z. Ławrynowicz, Bainitic transformation: estimation of
carbon diffusivity in austenite on the basis of measured austenite film thickness, Zeszyty Naukowe ATR nr 216, Mechanika 43, (1998) 289-297. (in Polish).
[18]Z. Ławrynowicz, A discussion on the mechanism of bainite
transformation in steels, Technology and Materials,
Gdańsk, Politechnika Gdańska, No 4, (2006) 149-155. (in
Polish).
[19]Z. Ławrynowicz, Observation of interphase boundary:
bainite-non-pearlitic eutectoid in Cr-Mo-C alloy by TEM,
Technology and Materials, Gdańsk, Politechnika Gdańska,