A Large and Deep Root System Underlies
High Nitrogen-Use Efficiency in Maize
Production
Peng Yu1, Xuexian Li1, Philip J. White2, Chunjian Li1*
1Department of Plant Nutrition, College of Resources and Environmental Science, China Agricultural University, Beijing, 100193, China,2Ecological Sciences, The James Hutton Institute, Invergowrie, Dundee, DD2 5DA, United Kingdom
Abstract
Excessive N fertilization results in low N-use efficiency (NUE) without any yield benefits and can have profound, long-term environmental consequences including soil acidification, N leaching and increased production of greenhouse gases. Improving NUE in crop production has been a longstanding, worldwide challenge. A crucial strategy to improve NUE is to en-hance N uptake by roots. Taking maize as a model crop, we have compared root dry weight (RDW), root/shoot biomass ratio (R/S), and NUE of maize grown in the field in China and in western countries using data from 106 studies published since 1959. Detailed analysis re-vealed that the differences in the RDW and R/S of maize at silking in China and the western countries were not derived from variations in climate, geography, and stress factors. In-stead, NUE was positively correlated with R/S and RDW; R/S and NUE of maize varieties grown in western countries were significantly greater than those grown in China. We then testified this conclusion by conducting field trials with representative maize hybrids in China (ZD958 and XY335) and the US (P32D79). We found that US P32D79 had a better root ar-chitecture for increased N uptake and removed more mineral N than Chinese cultivars from the 0-60 cm soil profile. Reported data and our field results demonstrate that a large and deep root, with an appropriate architecture and higher stress tolerance (higher plant density, drought and N deficiency), underlies high NUE in maize production. We recommend breed-ing for these traits to reduce the N-fertilizer use and thus N-leachbreed-ing in maize production and paying more attention to increase tolerance to stresses in China.
Introduction
Increased crop yields are predicted with the application of nitrogen (N) fertilizers, and it is esti-mated that about half of global food production is increased directly by application of N fertil-izers [1–3]. However, over-use of N fertilizers can have serious environmental consequences, including N enrichment in natural ecosystems such as nitrate contamination in the groundwa-ter and consequent changes in biodiversity and the emission of greenhouse gases, such N2O OPEN ACCESS
Citation:Yu P, Li X, White PJ, Li C (2015) A Large and Deep Root System Underlies High Nitrogen-Use Efficiency in Maize Production. PLoS ONE 10(5): e0126293. doi:10.1371/journal.pone.0126293
Academic Editor:Upendra M. Sainju, Agricultural Research Service, UNITED STATES
Received:December 29, 2014
Accepted:March 31, 2015
Published:May 15, 2015
Copyright:© 2015 Yu et al. This is an open access article distributed under the terms of theCreative Commons Attribution License, which permits unrestricted use, distribution, and reproduction in any medium, provided the original author and source are credited.
Data Availability Statement:All relevant data are within the paper and its Supporting Information files.
Funding:The research is supported by the National Natural Science Foundation of China (No: 31272232), the State Key Basic Research and Development Plan of China (No. 2013CB127402), and Chinese Universities Scientific Fund (No. 2012YJ039).
[4–9]. Increasing N-use efficiency (NUE) has been an important focus of recent agricultural and environmental researches [4,10]. China is a major producer and consumer of N fertilizers. A 271% increase in N fertilizer application from 7.07 to 26.21 MT (million tons) has resulted in a mere 71% increase in annual crop grain production, (from 283 to 484 MT), over the past three decades [11], while NUE decreased from 55 to 20 kg kg-1N [11,12]. For maize, NUE in China decreased from 30.2 to 29.9 kg grain kg-1N between 1980 and 2010. By contrast, maize NUE increased from 39.4 to 53.2 kg grain kg-1N in the US during the same period (FAO 2012). Optimizing the management of N-fertilizer is extremely important for improving NUE. According to data from 66 experiments across thirteen major maize production provinces in China, integrated soil-crop management increased the NUE of maize to 57 kg kg-1N with an average grain yield of 13 t ha-1[13]. Using a similar approach, the average NUE of maize in Ne-braska reached 73 kg kg-1N with an average grain yield of 13.2 t ha-1[14]. Apparently, a gap in NUE of maize production exists between China and western countries.
An essential strategy to improve NUE is to enhance N uptake by crops through breeding for appropriate root traits [15–17]. Efficient N uptake depends on root/shoot ratio (R/S), root size, and root distribution in the soil profile, which not only maximize interception and uptake of N fertilizers but also reduce N losses to deeper soil layers and groundwater, thereby increasing NUE [17,18]. Water and nutrients uptake by crops depends on root branching in the top soil and root growth angle respectively [18]. Axial roots are able to exert greater forces on soil and might have greater ability to penetrate compact soil [19,20] which determine growth directions and spatial distribution of a root system. Higher root length density (RLD) reflects greater abil-ity of the root system [21] for increased water and nutrient uptake.
Although roots can play a significant role in increasing crop yields [22,23], limited attention has been paid to root characteristics in crop breeding, possibly because roots grow below-ground and are difficult to investigate [16,23]. Over the past decades, improvement in maize’s ability to enhance root growth has been the primary driving force for higher yields of newer hy-brids [24]. Plant breeding has contributed to 40–50% increased maize yield in the US [25] and 36% in China [26]. Plant breeders have made considerable gains on‘aboveground’traits, but little attention has been paid on root characteristics. Improvements in root dry weight (RDW) have been negatively reinforced to a certain extent by the high-yielding shoot traits [27]. Root sizes of new wheat cultivars are small compared with local varieties, which may limit water and nutrient uptake [28]. In China, the new varieties have larger RDW at silking [29]. However, the RLD of both old and new varieties in the 0–60 cm soil profile were similar, when grown under the same condition [30].
We investigated the relationships between R/S, root size, root architecture, and NUE in maize and compared the differences in maize varieties bred in China and western countries using data published in the past decades. Comprehensive analysis of the effects of climatic and geographical stress factors on the RDW and R/S, and NUE in maize production at silking in China and western countries was also implemented. To validate conclusions from the litera-ture, a two-year field experiment with three maize varieties from China and US was conducted under the same growth conditions. The aim of this study was to answer the questions: are there differences in RDW and R/S of maize bred in China and western countries, and how these dif-ferences affect maize NUE?
Materials and Methods
Collection of data from previous literature
directly or transformed by calculation from the original figures on RDW and R/S of plants dur-ing the growdur-ing season were obtained from 106 studies (66 performed in China and 40 per-formed in western countries) published since 1959 that reported root characteristics of maize varieties grown in the field (listed in Table A inS1 Information). These studies were published in 53 different journals (35 in Chinese and 18 in English) and two conference proceedings. The field studies in China were performed in five major maize production areas, with different geo-graphical (climatic) conditions and soil types (Fig. A inS1 Information): Region I is northeast China (19 experiments) with the humid climate of the middle latitude temperate zone and typi-cal black or dark brown earth with high soil fertility. The northeast China Plain located be-tween 39–53°N is one of the most important areas for spring maize production. The maize yield produced in this area contributes 35% of the total production in China [31]. Region II is north China Plain (18 experiments) with a humid and semi-humid areas of the warm temper-ate zone where brown earth is widely distributed. The north China Plain is one of the most in-tensive agriculture regions in China [12]. Region III is in Loess Plateau northwest China (13 experiments) with temperate continental climate and aeolian soils or gray-brown desert soils of lower soil fertility. Region IV is southwest China (6 experiments) with the subtropical monsoon climates and red and purplish soil. Specifically, we separated the data of Shandong province from the north China Plain as the Region V (east China, 10 experiments) due to larger amounts of chemical fertilizer application in this province compared with other regions.
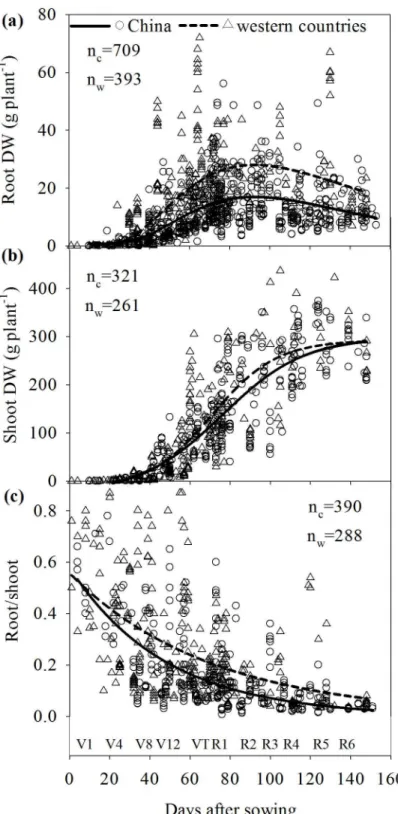
The field studies in western countries were performed in the US Corn Belt, that includes Iowa, Illinois and parts of Indiana and Nebraska (24 studies), Canada (three studies), Mexico (one study), and European countries (six from France, three from Germany and three from other countries). In total, 709 data were used to determine relationships between RDW and days after sowing (DAS) in China and 393 data in western countries (Fig 1A); 321 and 261 data from China and western countries, respectively, were used to determine relationships between shoot dry weight (SDW) and DAS (Fig 1B); 390 and 288 data from China and western coun-tries, respectively, were used to determine relationships between R/S and DAS (Fig 1C).
Data for RDW and R/S at silking and physiological maturity for maize grown in China and western countries were compared (Fig 2) based on data from 106 publications. Also data for RDW at silking for the selected four dominant Chinese maize varieties released in different years, ZD2 (1970s), YD13 (1980s), ZD958 and XY335 (two currently popular varieties) and one US pioneer were compared. Average changes in silking RDW of maize from China and US Corn Belt in response to high planting density, water stress and N deficiency were also com-pared based on the data from publications.
Only data generated from the field experiments were collected; those from glasshouses or growth chambers were excluded. Roots were generally harvested by destructive methods (see below). Data were pulled from experiments on different maize varieties, grown with contrast-ing plantcontrast-ing densities, nutrient regimes, water supplies, tillage systems and other aspects of crop management on different soil types. Thirteen field studies without detailed experimental records or that did not conform to a logistic growth model were excluded from the study.
Fig 1. Comparison of the root and shoot dry weights and root/shoot ratio of maize varieties grown in China and western countries during maize growth.V1-V12: the first—twelfth leaf emerged with ligule visible; VT: tasselling; R1: silking; R2: grain‘blister’stage; R3: milk; R4: dough; R5: dent visible; R6: physiological maturity. Unpaired data in the scatter plots were collected from 106 publications studying maize root growth in field experiments over the last 50 years.
were considered as stress factors to compare the differences in RDW and R/S between China and the US Corn Belt.
Field experiments to validate conclusions from literature analysis
The field experiments were conducted in two consecutive years (2011 and 2012) at the Shang-zhuang Experimental Station (40o8020@N, 116o10047@E), China Agricultural University, Beijing. The soil type at the study site was a calcareous alluvial soil with a silt loam texture (FAO) typi-cal of the region. The characteristics of the soil were analyzed prior to sowing. The chemitypi-cal properties of the 0–30 cm soil layer were as follows: extracted mineral N (Nmin= NH4++ NO3-) 14.8 mg kg-1, pH (H2O) 8.0, soil bulk density 1.33 g cm-3, Olsen-P 17.5 mg kg-1, NH4OAc-extracted K 157.5 mg kg-1, and organic matter 21 g kg-1in 2011; extracted mineral N (Nmin) 12.6 mg kg-1, pH (H2O) 8.0, soil bulk density 1.33 g cm-3, Olsen-P 18.5 mg kg-1, NH4OAc-extracted K 164.3 mg kg-1, and organic matter 20 g kg-1in 2012. Three maize varie-ties (ZD 958 and XY 335 from China and Pioneer 32D79 from the US) were sown on 29 April in 2011 and 25 April in 2012. The amount of rainfall during the maize growing season and ad-ditional data from 2007 to 2010 were shown in Table B inS1 Information. In addition, 12 and 15 mm of irrigation were applied on 19 and 30 June 2011 and 44 mm on 15 June 2012.
Before sowing in 2011 and 2012, 60 kg N ha-1as urea, 59 kg P ha-1as triple superphosphate (Ca(H2PO4)2H2O), 66 kg K ha-1as potassium sulfate (K2SO4) and 7 kg Zn ha-1as ZnSO4 7H2O were broadcast and incorporated into the top 0–15 cm soil layer with rotary tillage. In 2011, 100 kg N ha-1at V8 and 40 kg N ha-1plus 40 kg K ha-1at VT (tasselling) were applied by hand as topdressing. In 2012, 60 kg N ha-1at V8 and 80 kg N ha-1plus 40 kg K ha-1at V12 were applied by hand as topdressing. Weed growth on plots was controlled by pre-emergence herbicides and cultivation.
Plant harvest and measurements of dry weight and nitrogen content
Maize was harvested at silking (76 DAS in 2011 and 82 DAS in 2012) and at physiological ma-turity (148 DAS in 2011 and 153 DAS in 2012 when over 50% of plants showed a visible black layer at the base of the kernel). At each harvest, five consecutive plants were cut at the stem base in each plot. The shoot was divided into five parts: middle leaves (3 leaves, one ear leaf and one leaf above and one leaf below ear leaf), upper leaves (all the leaves above middle leaves), lower leaves (all the leaves below the middle leaves), stalks and ears. To determine the grain yield, ears in an area of 15.7 m2(4.9 × 3.2 m) in each plot were hand-harvested at physio-logical maturity in both years. Kernels from six randomly selected ears were harvested individ-ually by hand, and weighed to calculate grain yield at 15.5% moisture.
After shoot excision, roots from three plants were excavated from each plot. Roots from each plant were excavated with a soil volume of 20 cm (10 cm on each side of the plant base in the intra-row direction) × 70 cm (35 cm on each side of the plant base in the inter-row direc-tion) × 40 cm in depth in 2011, and with a soil volume of 28 cm (14 cm on each side of the plant base in the intra-row direction) × 50 cm (25 cm on each side of the plant base in the inter-row direction) × 40 cm in depth in 2012. The sampling depth for RDW was determined according to the reports which suggested that 80–90% of the total RDW is distributed in the top 0 to 20 cm soil layer [33,34]. The area of 20 cm × 70 cm in 2011 and 28 cm × 50 cm in 2012 was the soil surface occupied by each plant at the planting density of 70,000 plants ha-1. All of the visible roots in each excavated soil volume were picked out in the field by hand and washed with water to remove soil particles. All shoot and root samples were dried at 70°C for at least three days until constant weight was obtained. Dried samples were ground to 1 mm and 0.2 g of the ground plant material was used to determine the N concentration using a mod-ified Kjeldahl digestion method [35]. Nitrogen content in aboveground plant sample was deter-mined by multiplying N concentration by their dry weights and total N uptake was calculated as the sum of N content in all aboveground plant parts. NUE was determined by dividing the grain yield by N fertilizer input.
Root and soil sampling using the monolith method
In order to study the spatial distribution of maize roots of the three varieties in the soil, the monolith method was used to obtain root and soil samples after shoot excision at silking when the maize had largest root system [36,37]. Three replicates for each variety in each year were used for the study.
washed free of the soil. Remaining soil materials on the sieve were removed by hand. The sepa-rated root fractions were scanned immediately, or kept at -20°C for subsequent scanning, with a scanner (Epson 1680, Indonesia). The scanned images were analyzed using WinRHIZO V5.0 (Regent Instruments Inc., Quebec City, Canada) [38]. RLD was the ratio of total root length to soil volume in each soil monolith. The RLD and soil Nminwere presented as contour diagrams generated using Surfer 7.0 (Golden Software Inc., USA, 2000).
After picking visible roots, the soil in each monolith was crushed by hand and sieved through a 3 mm mesh sieve in the field, grinded using mortar and pestle in the lab to determine mineral nitrogen concentration (Nmin). A portion of the mixed soil was taken and placed in a marked plastic bag, and extracted immediately after transfer to the laboratory by shaking for 1 h at 25°C with 0.01 mol L-1CaCl2(1: 20, soil: water). Soil Nmin(NH4+-N + NO3−N) was ana-lyzed by continuous flow analysis (TRACS 2000 system, Bran and Luebbe, Norderstedt, Ger-many). The RLD and soil Nminwere presented as contour diagrams generated using Surfer 7.0 (Golden Software Inc., USA, 2000).
Statistical analysis
Data-mining analysis. Temporal variation of collected data in RDW, SDW, and R/S over the maize growing season (0–160 DAS) followed a nonlinear trend. Therefore, a nonlinear re-gression model (Sigmaplot 12.0, Systat Software Inc., Chicago, USA) was adopted to analyze the data (Fig 1). Coefficients were generated andPvalues were calculated at the significant level 0.05 using the Sigmaplot 12.0.
The equation used to describe the relationship between RDW and DAS was:
RDW¼y0þae 0:5ðDAS x0
b Þ
2
The coefficients were significant withPvalues<0.0001 for parameters a, b and x0. The coef-ficients y0, a, b, and x0were -10.3, 27.5, 57.2, 80.5 and standard errors of coefficients were 7.4, 7.2, 11.5 and 1.7 for China. For western countries, coefficients y0, a, b, and x0were -11.6, 41.6, 50.4, 80 and standard errors were 7.5, 6.8, 8.7, 2.4. Results for the overall best-fit solution were R2= 0.32 for China and R2= 0.40 for western countries respectively.
The equation used to describe the relationship between SDW and DAS was:
SDW¼y0þa 1þe
DAS x0
b
ð Þ
h i
The coefficients were significant withPvalues<0.0001 for parameters a, b and x0. The coef-ficients y0, a, b, x0, were -23.4, 322.5, 20.4, 76.3 and standard errors of coefficients were 18.4, 30.9, 3.4 and 2.7 for China. For western countries, coefficients y0, a, b, and x0were -18.2, 310.9, 16.2, 71 and standard errors of coefficients were 11.5, 23.1, 2.5 and 2.3. Results for the overall best-fit solution were R2= 0.75 for both China and western countries.
The R/S was fitted to an exponential decay curve:
R=S¼ae bDAS
The RDW and R/S ratio of maize grown in China and western countries were compared at silking and maturity using unpaired two-tail Student’st-test (Sigmaplot 12.0, Systat Software Inc., Chicago, USA) (Fig 2). The difference was significant at aPvalue<0.05.
Detailed analyses were performed to compare the differences in silking RDW and R/S ratio of varieties, planting regions and responses to different stress factors of maize from China and US pioneers.
Statistical analysis of field experiments. Field data on RDW, R/S, N uptake, yield and NUE were analyzed using one-way PROC ANOVA using the SAS package (SAS-Institute-Inc., Cary, NC, USA, 2004). Genotype treatments were treated as fixed effects and replication as ran-dom effect. Means of different genotype treatments were compared based on least significant difference (LSD) at the significance level of 0.05. Year was treated as repeated measure of analy-sis for data analyanaly-sis on parameters shown inTable 1.
Results
Differences in the root dry weight and root/shoot ratio of maize from
China and western countries
Root dry weight increased with DAS until silking and then declined (Fig 1A). During the initial growth period (V1-V8), the difference in RDW of maize from China and western countries was not apparent (Fig 1A). After the elongation stage (V8), the difference in RDW of maize from China and western countries increased and reached the peak value when silking ap-proached. Afterwards, RDW decreased dramatically. Compared with RDW, shoot DW in-creased continuously until harvest (Fig 1B). Nonlinear regression analysis indicated that maize varieties grown in western countries had larger RDW and R/S over the whole growth period and, especially, after the elongation stage (linear growth phase, V8-VT inFig 1A and 1C). Larg-er R/S of maize from westLarg-ern countries was apparently dLarg-erived from the largLarg-er RDW ovLarg-er the whole growth period (Fig 1).
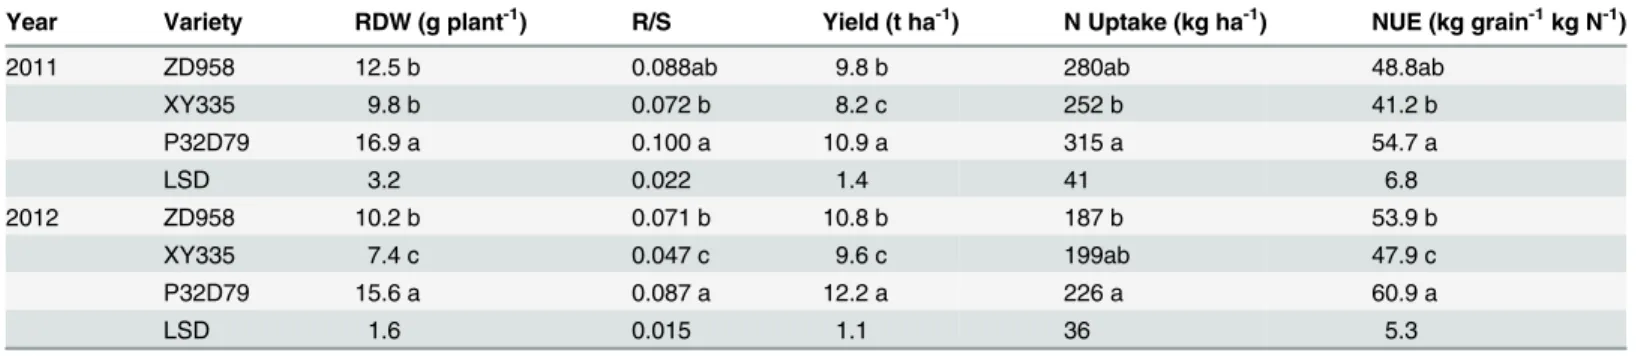
The RDW and R/S of maize varieties grown in China and western countries were compared especially at silking when root growth was higher (Fig 1A), and at maturity when plants were harvested (Fig 2). Unpairedttests showed that the average RDWs of maize grown in western countries were 25.3 g per plant at silking and 23.7 g per plant at maturity, which were signifi-cantly (P<0.05) higher than those of maize grown in China at silking and maturity, which were 16.3 g and 13.2 g per plant, respectively. The average R/S of maize grown in western Table 1. Root dry weight (RDW) and root/shoot ratio (R/S) at silking (76 DAS in 2011 and 82 DAS in 2012), and grain yield, total N uptake and N-use efficiency (NUE) at physiological maturity (148 DAS in 2011 and 153 DAS in 2012) of maize varieties from China (ZD 958 and XY 335) and US (P32D79).
Year Variety RDW (g plant-1) R/S Yield (t ha-1) N Uptake (kg ha-1) NUE (kg grain-1kg N-1)
2011 ZD958 12.5 b 0.088ab 9.8 b 280ab 48.8ab
XY335 9.8 b 0.072 b 8.2 c 252 b 41.2 b
P32D79 16.9 a 0.100 a 10.9 a 315 a 54.7 a
LSD 3.2 0.022 1.4 41 6.8
2012 ZD958 10.2 b 0.071 b 10.8 b 187 b 53.9 b
XY335 7.4 c 0.047 c 9.6 c 199ab 47.9 c
P32D79 15.6 a 0.087 a 12.2 a 226 a 60.9 a
LSD 1.6 0.015 1.1 36 5.3
Field trials were performed at the Shangzhuang Experimental Station of the China Agricultural University, Beijing in 2011 and 2012. Values in the column in each year followed by different letters had significant difference between varieties (P<0.05).
countries was 0.203 at silking and 0.176 at maturity, which were also significantly (P<0.05) greater than those of maize grown in China at silking and maturity, which were 0.114 and 0.044, respectively (Fig 2).
The correlation analysis of R/S and NUE showed that the NUE of maize was positively cor-related to R/S at silking no matter where the crop was grown. The maize with smaller R/S val-ues (Chinese varieties) had lower NUE, while the maize with larger R/S valval-ues (Western counties) had higher NUE (Fig 3).
The influence of stress factors on the root dry weight and root/shoot ratio
of maize
It was found that RDW at silking of maize from the US pioneer varieties were significantly larg-er than those of dominant maize varieties from China (Fig 4;P<0.05). Results showed that silk-ing RDW and R/S of maize from the US Corn Belt were significantly larger than those of maize in all five regions in China (Fig 5;P<0.05).
Three stress factors, e.g. high plant density, drought and N deficiency, were selected to com-pare the responses of maize grown in China and US Corn Belt. Regardless of the overall root size, the reduction of the silking RDW of Chinese maize was more than that from the US Corn Belt, when they were subjected to these stresses, except for the drought (Fig 6).
Fig 3. Correlation between the maize root/shoot ratio and nitrogen use efficiency (NUE) at silking.Only data published with root/shoot ratio at silking, grain yield at maturity and total N fertilizer were used in this analysis. Open circles indicate the results from Chinese farmlands and closed circles indicate data from western countries.
Field experiments with the selected varieties from China and US
US maize variety P32D79 accumulated more biomass in the root with higher R/S than two Chi-nese varieties at silking. The average yield and N uptake of P32D79 was 21% and 18% more than Chinese varieties, respectively. As a result, the NUE of P32D79 was significantly higher than those of two Chinese varieties in both years (Table 1). The results confirmed that the US maize variety had larger RDW and R/S at silking, take up more N and had a greater NUE than Chinese varieties (Table 1;Fig. B inS1 Information).
The results of the concentration of soil mineral N and the three-dimensional distributions of roots in the soil at silking showed that P32D79 had higher root length density (RLD) and lower Nminthroughout the 0–60 cm soil profile compared with the two Chinese maize varieties (Fig 7; Fig. C inS1 Information). When comparing the two Chinese varieties ZD958 and XY335, ZD958 had higher RLD in the topsoil (<30 cm) whereas XY335 had greater RLD in the subsoil (>30 cm). This was accompanied by lower soil Nminin the 0–30 cm horizon and higher in the 30–60 cm horizon with ZD958 than XY335 (Fig 7; Fig. C inS1 Information). It was observed that a strong wind in 2011 resulted in lodging of XY335 with lower RLD in the 0–30 cm soil layers (Fig. D inS1 Information).
Fig 4. Comparisons of root dry weight at silking (silking RDW) between four dominant Chinese maize varieties and US pioneer variety.The solid line and square within the box represents the median and mean values of all data, the top and bottom edges of the box represent 75 and 25 percentiles and the top and bottom bars represent 95 and 5 percentiles of all data, respectively.
Fig 5. Comparisons of root dry weight at silking (silking RDW) (a) from 217 unpaired data and root/shoot ratio at silking (b) from 100 unpaired data of maize grown in US corn belt and five Chinese major maize planting regions (Regions I to V).Regions (I to V) were classified according to
geographical (climatic) distinctions and soil types in China (S1 Fig). The solid line and square within the box represents the median and mean values of all data, the top and bottom edges of the box represent 75 and 25 percentiles and the top and bottom bars represent 95 and 5 percentiles of all
data, respectively.
Fig 6. Average changes in root dry weight at silking of maize from China (a, high planting density; b, water stress; c, N deficiency) and US Corn Belt (d, high planting density; e, water stress; f, N deficiency) in response to various stresses.The data derived from individual experiments from China and US Corn Belt were used. The values above columns indicate the reduction (%) under stresses compared with the optimum conditions. The solid line and square within the box represents the median and mean values of all data, the top and bottom edges of the box represent 75 and 25 percentiles and the top and bottom bars represent 95 and 5 percentiles of all data, respectively.
Discussions
The differences in the RDW and R/S of maize from China and western
countries were independent of stress factors
The R/S is frequently used to estimate relative biomass allocation to the root. New maize varie-ties with greater RDW and R/S are likely to be more resistant to stresses factors, and, therefore, yield more grain and have a greater NUE than traditional varieties [24]. The NUE of maize was positively correlated to R/S at silking (Fig 3). The question was that what is the determining factor for the differences in RDW and R/S of maize from China and western countries at silk-ing? RDW and R/S ratio can be a consequence of carbon allocation within plants and are influ-enced by environmental conditions [39–42]. Maize RDW and R/S display considerable plasticity in response to stress factors [42]. It was necessary to unravel whether stress factors contributed to major differences in RDW and R/S of maize from China and western countries.
The results demonstrated that RDW and R/S of maize at silking were greater from the US Corn Belt than those from all five regions (Figs4and5) in China, including the maize in Re-gion I (northeast China Plain) where the soil and climatic conditions are almost similar to those in the US Corn Belt [43,44]. Therefore, the larger RDW and R/S of the maize from western countries than those from China are independent of the differences in the growing en-vironments. Greater RDW and R/S in maize from western countries are largely due to differ-ences in genetic composition (Figs4and5). This conclusion was also supported by the present field experiments with two Chinese and one American varieties under the same conditions (Table 1; Fig. B inS1 Information). Shandong province (Region V) is an intensive agricultural and economically developed region in China, with large amount of chemical fertilizer input in agricultural production. The maize in this region had higher grain yield [45,46]; however, the average R/S of maize at silking was the smallest among the five regions (Fig 5B), because the over-use of chemical N fertilizer probably inhibits root growth [47].
Different stresses influence maize RDW and R/S differently. Nutrient deficiency generally results in an increase in the overall maize R/S, while water stress, high plant density, shading, and soil compaction lead to a decrease in maize R/S [42]. Comparative analyses indicated that the reduction in the RDW of differently stressed Chinese maize at silking was more than that Fig 7. Contour maps of root length density (left) and soil mineral N (Nmin, right) concentration of three
maize varieties from China (ZD 958 and XY 335) and US (P32D79) in a soil volume of 70 cm × 30 cm to a depth of 60 cm.The combined charts represented the distribution of root length density or soil Nmin
concentration in each soil layer, and grey scale legends indicated the relative value range. The soil samples were taken using the monolith method (Böhm, 1979) with 10 cm3soil block at silking in 2011. Each soil layer
contained 21 soil blocks (7 × 3, the value of each soil block was the mean of three replicates) and each root system was harvested in 126 soil blocks.
of the maize from the US Corn Belt (Fig 6), the values of the RDW reductions were similar to the reported average maize RDW reduction of 30.1% in response to high population, 44.2% in response to drought, and markedly lower than the reduction of 6.5% in response to N deficien-cy reviewed by Amos and Walters 2006 [42]. The maize from the US Corn Belt had less reduc-tion in RDW at silking under high planting density and N deficiency, implying that maize bred in the US is more stress tolerance than those bred in China. Genetic improvement of enhanced maize grain yield is largely dependent on the improved stress tolerance in the US maize breed-ing practices [25,48,49]. In China, however, recently released varieties do not show improve-ment in tolerance to high plant density [29,50–53].
Ideal root distribution is beneficial for higher grain yield and nitrogen-use
efficiency
Field experiments with two widely used maize varieties bred in China (ZD958 and XY335) and one bred in the US (P32D79) under the same growth conditions confirmed that the P32D79 with larger RDW and R/S at silking acquired more N and had a greater NUE (Table 1; Fig. B in
S1 Information). The results validated the relationships between R/S at silking and maize NUE (Fig 3).
Efficient N uptake depends not only on root size but also on the root distribution in the soil profile [16,17,54]. Detailed studies on the three-dimensional distributions of roots in the soil and the concentration of soil mineral N at silking revealed a negative correlation (0.5<R2<0.7) between RLD and soil Nmin. Greater RLD in 0–60 cm soil profile resulted in P32D79 acquiring more N, leaving less Nminin the soil, and having a higher NUE than the two Chinese varieties (Table 1;Fig 7; Fig. B and C inS1 Information). Maize varieties with greater RLD in the top soil depleted more soil mineral N and reduced the movement of water and nitrate-N towards deeper soil layers [16,17,55]. In addition, maize varieties with large RDW and RLD in the top soil ensure that plants remain upright and do not suffer from the dramatic yield loss associated with lodging [56] (Fig. D inS1 Information). Varieties with greater RLD in the subsoil can re-duce N leaching by absorbing N. Additionally, deep roots enable plants to access water in deeper soil horizons thereby reducing the risk of drought stress [54,57,58].
An ideal root architecture for N uptake includes large RLD in both the top soil and subsoil [16,17,54]. This result suggests that high RLD is beneficial for the better uptake of nutrients, such as phosphorus [59] and N. It is possible that Chinese farmers might have over-applied N fertilizers to compensate for the small root systems and low tolerance to the stresses. Unfortu-nately, excess N can inhibit root growth, especially at early growth stages of maize plants [18] which can reduce NUE with increased environmental consequences of groundwater N con-tamination and greenhouse gas (N2O) emissions.
Optimal management of mineral nutrient inputs has become one of the most urgent re-quirements for sustaining intensive agriculture in China [16,17,54]. Most reports suggest that the excessive use of N fertilizers leads to low NUE in intensive Chinese agriculture and have se-rious environmental consequences [11,13,18,60]. China is taking steps towards increasing grain yield and NUE by integrated agronomic and nutrient management approaches [13,60–
Supporting Information
S1 Information. Detailed materials and methods.
(DOC)
Author Contributions
Conceived and designed the experiments: CL. Performed the experiments: PY. Analyzed the data: PY CL. Contributed reagents/materials/analysis tools: CL. Wrote the paper: PY XL PJW CL.
References
1. Erisman JW, Sutton MA, Galloway J, Klimont Z, Winiwarter W (2008) How a century of ammonia syn-thesis changed the world. Nat Geosci 1: 636–639.
2. Dawson CJ, Hilton J (2011) Fertiliser availability in a resource-limited world: production and recycling of nitrogen and phosphorus. Food Policy 36: S14–S22.
3. Mueller ND, Gerber JS, Johnston M, Ray DK, Ramankutty N, et al. (2012) Closing yield gaps through nutrient and water management. Nature 490: 254–257. doi:10.1038/nature11420PMID:22932270 4. Tilman D, Cassman KG, Matson PA, Naylor R, Polasky S (2002) Agricultural sustainability and
inten-sive production practices. Nature 418: 671–677. PMID:12167873
5. Galloway JN, Townsend AR, Erisman JW, Bekunda M, Cai Z, et al. (2008) Transformation of the nitro-gen cycle: recent trends, questions, and potential solutions. Science 320: 889–892. doi:10.1126/ science.1136674PMID:18487183
6. Conley DJ, Paerl HW, Howarth RW, Boesch DF, Seitzinger SP, et al. (2009) Controlling eutrophication: nitrogen and phosphorus. Science 323: 1014–1015. doi:10.1126/science.1167755PMID:19229022 7. Canfield DE, Glazer AN, Falkowski PG (2010) The evolution and future of Earth’s nitrogen cycle.
Sci-ence 330: 192–196. doi:10.1126/science.1186120PMID:20929768
8. Guo J, Liu X, Zhang Y, Shen J, Han W, et al. (2010) Significant acidification in major Chinese croplands. Science 327: 1008–1010. doi:10.1126/science.1182570PMID:20150447
9. Liu X, Zhang Y, Han W, Tang A, Shen J, et al. (2013) Enhanced nitrogen deposition over China. Nature 494: 459–463. doi:10.1038/nature11917PMID:23426264
10. Cassman KG, Dobermann A, Walters DT, Yang H (2003) Meeting cereal demand while protecting natu-ral resources and improving environmental quality. Annu Rev Env Resour 28: 315–358.
11. Ju X, Xing G, Chen X, Zhang S, Zhang L, et al. (2009) Reducing environmental risk by improving N management in intensive Chinese agricultural systems. P Natl Acad Sci USA 106: 3041–3046. doi:10. 1073/pnas.0813417106PMID:19223587
12. Zhu ZL, Chen DL (2002) Nitrogen fertilizer use in China—contributions to food production, impacts on the environment and best management strategies. Nutr Cycl Agroecosys 63: 117–127.
13. Chen XP, Cui ZL, Vitousek P, Cassman KG, Matson PA, et al. (2011) Integrated soil-crop system man-agement for food security. P Natl Acad Sci USA 108: 6399–6404. doi:10.1073/pnas.1101419108 PMID:21444818
14. Grassini P, Cassman KG (2012) High-yield maize with large net energy yield and small global warming intensity. P Natl Acad Sci USA 109: 1074–1079. doi:10.1073/pnas.1116364109PMID:22232684 15. White PJ, Broadley MR, Gregory PJ (2012) Managing the nutrition of plants and people. Appl Environ
Soil Sci article 104826.
16. White PJ, George TS, Gregory PJ, Bengough AG, Hallett PD, et al. (2013) Matching roots to their envi-ronment. Ann Bot 112: 207–222. doi:10.1093/aob/mct123PMID:23821619
17. Lynch JP (2013) Steep, cheap and deep: an ideotype to optimize water and N acquisition by maize root systems. Ann Bot 112: 347–357. doi:10.1093/aob/mcs293PMID:23328767
18. Peng YF, Li XX, Li CJ (2012) Temporal and spatial profiling of root growth revealed novel response of maize roots under various nitrogen supplies in the field. PLoS ONE 7: 1–11.
19. McCully ME, Canny MJ (1988) Pathways and processes of water and nutrient movements in roots. Plant Soil 111: 159–170.
21. Varney GT, Canny MJ, Wang XL, McCully ME (1991) The branch roots ofZea. First order branches, their number, sizes and division into classes. Anna Bot 67: 357–364.
22. Lynch JP (2007) Roots of the second green revolution. Aust J Bot 55: 493–512. 23. Gewin V (2012) An underground revolution. Nature 466: 552–553.
24. Duvick DN (2005) The contribution of breeding to yield advances in maize (Zea maysL.). Adv Agron 86: 83–145.
25. Tollenaar M, Lee EA (2002) Yield potential, yield stability and stress tolerance in maize. Field Crops Res 75: 161–169.
26. Wu YC, Ma ZY, Wang DY (1998) Analyses of contribution of maize improvement to yield increment in China. Acta Agron Sin 24: 595–600 (In Chinese).
27. Siddique KHM, Belford RK, Tennant D (1990) Root: shoot ratios of old and modern, tall and semi-dwarf wheats in a mediterranean environment. Plant Soil 121: 89–98.
28. Waines JG, Ehdaie B (2007) Domestication and crop physiology: roots of green-revolution wheat. Ann Bot 100: 991–998. PMID:17940075
29. Wang K, Zheng H, Liu K, Zhang J, Dong S, et al. (2001) Evolution of maize root distribution in space-time during varieties replacing in China. Acta Phytoecol Sin 25: 472–475 (In Chinese).
30. Ning P, Li S, Li XX, Li CJ (2014) New maize hybrids had larger and deeper post-silking root than old ones. Field Crops Res 166: 66–71.
31. Yang X, Lin E, Ma S, Ju H, Guo L, et al. (2007) Adaptation of agriculture to warming in Northeast China. Climatic Change 84: 45–58.
32. Ma BL, Dwyer LM, Costa C (2003) Row spacing and fertilizer nitrogen effects on plant growth and grain yield of maize. Can J Plant Sci 83: 241–247.
33. Osaki M, Shinano T, Matsumoto M, Ushiki J, Shinano MM, et al. (1995) Productivity of high-yielding crops. V. Root growth and specific absorption rate of nitrogen. Soil Sci Plant Nutr 41, 635–647. 34. Dwyer LM, Ma BL, Stewart DW, Hayhoe HN, Balchin D, et al. (1996) Root mass distribution under
con-ventional and conservation tillage. Can J Soil Sci 76: 23–28.
35. Nelson DW, Somers LE (1973) Determination of total nitrogen in plant material. Agron J 65: 109–112. 36. Böhm W (1979) Methods of Studying Root Systems. Berlin: Springer-Berlag Press.
37. Li L, Sun JH, Zhang FS, Guo TW, Bao XG, et al. (2006) Root distribution and interactions between inter-cropped species. Oecologia 147: 280–290. PMID:16211394
38. Peng YF, Niu JF, Peng ZP, Zhang FS, Li CJ (2010) Shoot growth potential drives N uptake in maize plants and correlates with root growth in the soil. Field Crops Res 115: 85–93.J
39. Hilbert DW (1990) Optimization of plant root: shoot ratios and internal nitrogen concentration. Ann Bot 66: 91–99.
40. Gedroc JJ, McConnaughay KDM, Coleman JS (1996) Plasticity in root/shoot partitioning: optimal, onto-genetic, or both? Funct Ecol 10: 44–50.
41. Aikio S, Markkola AM (2002) Optimality and phenotypic plasticity of shoot-to-root ratio under variable light and nutrient availabilities. Evol Ecol 16: 67–76.
42. Amos B, Walters DT (2006) Maize root biomass and net rhizodeposited carbon. Soil Sci Soc Am J 70: 1489–1503.
43. Grassini P, Thorburn J, Burr C, Cassman KG (2011) High-yield irrigated maize in the Western US Corn Belt: I. On-farm yield, yield potential, and impact of agronomic practices. Field Crops Res 120: 142– 150.
44. Chen X, Chen F, Chen Y, Gao Q, Yang X, et al. (2013) Modern maize hybrids in Northeast China exhibit increased yield potential and resource use efficiency despite adverse climate change. Global Change Biol 19: 923–936. doi:10.1111/gcb.12093PMID:23504848
45. Chen GP, Wang HR, Zhao JR (2009) Analysis on yield structural model and key factors of maize high-yield plots. J Maize Sci 17: 89–93 (In Chinese).
46. Li SK, Wang CT (2009) Evolution and development of maize production techniques in China. Sci Agric Sin 42: 1941–1951 (In Chinese).
47. Marschner P (2012) Marschner’s Mineral Nutrition of Higher Plants. ( 3rd edition). London: Academic Press.
48. Duvick DN, Cassman KG (1999) Post-green revolution trends in yield potential of temperate maize in the north central United States. Crop Sci 39: 1622–1630.
50. Sun Q, Hu C, Dong S, Wang K (2003) Evolution of root characters during all growth stage of maize culti-vars in different eras in China. Acta Agron Sin 29: 641–645 (In Chinese).
51. Wang T, Ma X, Li Y, Bai D, Liu C, et al. (2011) Changes in yield and yield components of single-cross maize hybrids released in China between 1964 and 2001. Crop Sci 51: 512–525.
52. Ci X, Li M, Liang X, Xie Z, Zhang D, et al. (2011) Genetic contribution to advanced yield for maize hy-brids released from 1970 to 2000 in China. Crop Sci 51: 1–8.
53. Chen Y, Wu Q, Chen X, Chen F, Zhang Y, et al. (2012) Root growth and its response to increasing planting density in different maize hybrids. Plant Nutr Fert Sci 18: 52–59 (In Chinese).
54. Dunbabin VM, Diggle AJ, Rengel Z (2003) Is there an optimal root architecture for nitrate capture in leaching environments? Plant Cell Environ 26: 835–844. PMID:12803611
55. Dunbabin VM, Diggle AJ, Rengel Z (2002) Simulation of field data by a basic three-dimensional model of interactive root growth. Plant Soil 239: 39–54.
56. Carter PR, Hudelson KD (1988) Influence of simulated wind lodging on corn growth and grain yield. J Prod Agric 1: 295–299.
57. Hamblin AP, Hamblin J (1985) Root characteristics of some temperate legume species and varieties on deep, free-draining entisols. Aust J Agric Res 36: 63–72.
58. Hammer GL, Dong Z, McLean G, Doherty A, Messina C, et al. (2009) Can changes in canopy and/or root system architecture explain historical maize yield trends in the U.S. Corn Belt? Crop Sci 49: 299– 312.
59. Marschner H (1998) Role of root growth, arbuscular mycorrhiza, and root exudates for the efficiency in nutrient acquisition. Field Crops Res 56: 203–207.
60. Zhang FS, Chen XP, Vitousek P (2013) Chinese agriculture: An experiment for the world. Nature 497: 33–35. doi:10.1038/497033aPMID:23636381
61. Zhang F, Cui Z, Fan M, Zhang W, Chen X, et al. (2011) Integrated soil–crop system management: re-ducing environmental risk while increasing crop productivity and improving nutrient use efficiency in China. J Environ Qual 40: 1051–1057. doi:10.2134/jeq2010.0292PMID:21712573
62. Zhang F, Cui Z, Chen X, Ju X, Shen J, et al. (2012) Integrated Nutrient Management for Food Security and Environmental Quality in China. Adv Agron 116: 1–38.
63. Herder GD, Isterdael GV, Beeckman T, De Smet I (2010) The roots of a new green revolution. Trends Plant Sci 15: 600–607. doi:10.1016/j.tplants.2010.08.009PMID:20851036