(4) Israel, RA. et al. Analytical potential for multiple cause-of-death data.Am JEpidemiol 124: 161-179, 1986.
(5) Pan American Health Organization. Regional Meeting on Guidelines and Procedures for Mortality Analysis. EpidemiolBull
9(2): 3-6, 1988.
(6) Becker, RA. et al. Health profiles, Brazil, 1984. Epidemiol Bull 9(2): 6-12, 1988.
(7) Giacomini, HF. et al. Health profiles, Argentina, 1980-1982. Epidemiol Bull 9(3): 2-9, 1988.
(8) Pan American Health Organization. Health Conditions in theAmericas, 1981-1984. Scientific Publication No. 500,
Washing-ton, D.C., 1986.
(9) Behm, H. Mortalidad infantil y nivel de vida. Santiago, Ediciones Universidad de Chile, 1962.
(10) Taucher, E. Chile: mortalidad desde 1955 a 1975. Ten-denciasy causas. CELADE, Serie A, No. 162, Septemberl978.
(11) Becker, RA. et al. Years of potential life lost -Brazil, 1980.
Epidemiol Bull 5(5): 3-7, 1984.
(12) Buck, C. and Bull, S. Preventable causes of death versus infant mortality as an indicator of the quality of health services. Int JHealth Serv 16(4): 553-563, 1986.
(13) Buck, C. Beyond Lalonde: Creating health. Can J Public Health 76, Supplement 1, May/June, 1985.
(14) Lalonde, M. A new perspective on the health of Canadians: A working document. Ottawa, Information Canada,
1985.
(15) Dever, GE Allen. Epidemiological model for health policy analysis. Social Indicators Research 2: 453-466, 1976.
(16) Rose, G. Sick individuals and sick populations. Int J Epidemiol 14: 32-38, 1985.
(17) Rothman, KJ. Modern epidemiology. Boston/Toronto, Little, Brown and Company, pp 45-49,1986.
(18) Centers for Disease Control. Premature mortality in the United States: public health issues in the use of years of potential life lost. MMWR 35 (Suppl No. 2S), 1986.
(Source: Health Situation and Trend Assessment Program, PAHO. Based on Plaut, R. and Roberts, E. Preventable mortality: indicator or target? Applica-tions in developing countries. Wld hlth statist. quart. 42(1): 4-15, 1989.)
);1
Preventable Mortality Criteria. Cuba
Editor's Note:
This article ispart of a study on health profiles and evaluation of mortality in Cuba in a three-yearperiod of each decade of the revolutionaryperiod prepared with the support of the PAHO/WHO Research Grants Program and presented at the Regional Meetingon Guidelines and ProceduresforMortalityAnalysis, held in Washington, D. C., from 22 to 26 February 1988. The original document consists of thefollowing chapters: determiningfactors of the state of health of thepopulation;population andfertility; mortality (printarypurpose of thepaper); morbidity, human growth and development, and nutritional surveillance; and organi-zation of the health system. The chapter on Mortality discusses the coverage and quality of the data, includingmedical certification of death. The methodology used in the research is described, together with the results of the study in terms of the evolution of mortality and analysis of the leading causes of death, both for the country as a whole and in four provincial capital cities. The periods analyzed, the information on mortality and the methodology employed in this article are the same as those used in the original study.
The publication of this article has been considered of interest to the readers of the Bulletin because it constitutes another illustration of how mortality analysis can be enriched by the complementary use of different indicators and classification criteria. However, the selection of which to use will depend on the objectives and circumstances of each particular case.
The purpose of this article is to analyze mortality in terms of the criterion of preventable death. This criteria is defined in accordance with current scien-tific knowledge and the medical progress achieved to date, and it was considered appropriate to use the classification employed in a similar study published by the Latin American Demography Center (CELADE)(1) as a point of departure. The analysis presented in the paper is expanded with an estimate of the potential years of life lost (YPLL).
The assignment of some causes of death to one group or another according to their preventability has a subjective component and, as such, is dependent on different criteria; however, if the same criterion is
used for different periods the results are comparable and provide an acceptable approach to reality. It should also be borne in mind that this type of work is founded on the idea of preventing early death, that is, of prolonging life, which at times is achieved by preventing disease and at others by treating it ade-quately once it occurs.
The criteria for prevention and health education are applicable to all groups, since even with regard to diseases considered to be unpreventable or prevent-able with difficulty it is being demonstrated that the control of risk factors, the change of habits harmful to health, and other preventive measures are capable of mitigating or preventing chronic and degenerative
diseases, and of prolonging socially active life for human beings. Accordingly, the words prevention, education, preventable, and unpreventable are used to label or to give short titles to the groups, not to restrict to a mere formula the broad concepts they represent in reality.
In grouping diseases according to this criterion the first step is a preliminary division of deaths into pre-ventable and unprepre-ventable, followed by the group-ing of preventable deaths in 4 groups, accordgroup-ing to the various measures that can be taken to prevent them. This grouping differs slightly from the group-ing used in the study mentioned as a reference. Six groups are thus formed:
1. Deaths preventable by vaccination orpreventive treatment: anthrax, diphtheria, whooping cough, tet-anus, acute poliomyelitis and its sequelae, smallpox, measles, human rabies, and venereal diseases.
2. Deathspreventable through early diagnosis and timely treatment: plague; meningococcal infections;
malignant tumors of the skin, breast, cervix, and pros-tate; diabetes mellitus; avitaminosis and other nutri-tional deficiencies; anemias; meningitis; epilepsy; active rheumatic fever and chronic rheumatic dis-eases of the heart; bronchitis, emphysema, and asthma; peptic ulcer; gastritis and duodenitis; appen-dicitis, intestinal obstruction, and hernia; cholelithi-asis and cholecystitis, acute nephritis, and other forms of nephritis; infection of the kidney and calcu-lus of the urinary tract.
3. Deathspreventable by the application of hygienic measures and environmental sanitation, and health education: cholera, typhoid fever, paratyphoid fever and other salmonellosis infections; bacillary dysen-tery and amebiasis, enteritis, and other diarrheal dis-eases; yellow fever; infectious hepatitis, typhus and other rickettsiae infections; ancylostomiasis and other helminthiasis infections.
4. Deaths preventable by the application of mixed measures: all types of tuberculosis, brucellosis, strep-tococcal angina, and scarlatina; erysipelas and other bacterial diseases; malaria; schistosomiasis; hydatid-osis and filariasis; acute respiratory infections; viral pneumonia and other pneumonias; cirrhosis of the liver; complications of pregnancy, childbirth, and the puerperium; diseases of newborns; and violent causes.
5. Deaths difflcult toprevent with current knowledge and technological development: malignant tumors, except cancer of the skin, breast, cervix and prostate; multiple sclerosis; other diseases of the nervous sys-tem and of the sense organs; cardiovascular diseases; cerebrovascular diseases; diseases of the arteries, ar-terioles, and capillaries; influenza; and birth defects.
6. Remainder ofdeaths: the distribution of deaths in the various groups includes all causes of deaths. All deaths whose cause has a logical reason for inclusion are assigned to one of the first five groups, and the remaining deaths that cannot be identified with any of the previous groups are left for the group Other causes of death (in this paper such deaths accounted for between 4% and 6% of the total number of deaths analyzed).
Results
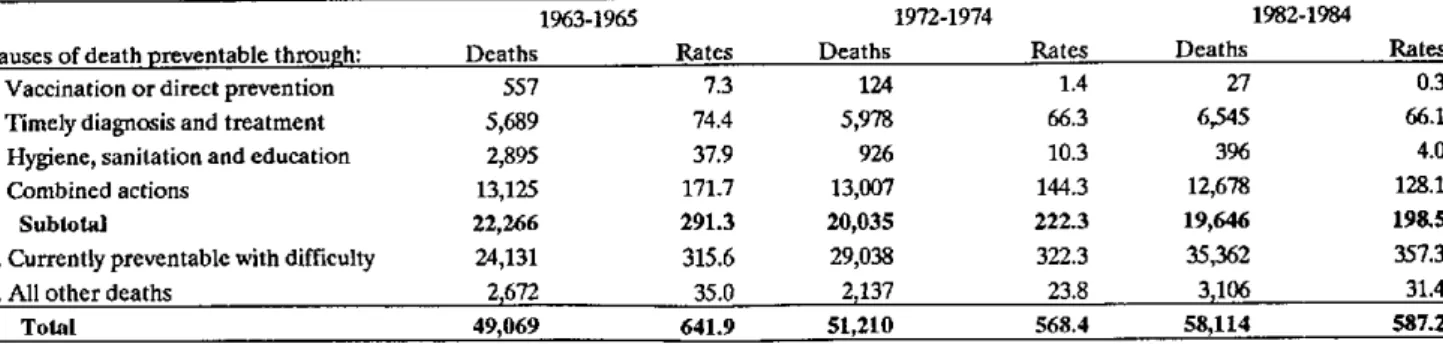
In Table 1 an evaluation is made of the constant decline in the rates in the four groups of causes in which applicable preventive measures act in the short and medium term. The decline of deaths from dis-eases preventable by vaccination or direct preventive measures is very marked, as are deaths from causes able to be prevented through hygiene, health educa-tion, and sanitation. In this last group nutrition also plays a fundamental role, since it includes deaths from acute diarrheal diseases whose substratum, as a social problem, is undernutrition. The rates of the four groups of preventable causes decline by 24% from the first three-year period to the second and by 32% from the first to the third. This trend is inverted with regard to diseases difficult to prevent, whose rates rise from the first to the second three-year period by 2% and by 13% from the first to the last.
The specific rates according to age groups (Table 2) show that although infants under 1 year old have benefited markedly from vaccination and other measures, this effect is also observed in other ages. The rates of the group of diseases difficult to prevent are high for persons 75 years of age and older, but they are also high for infants under 1 year old, in which birth defects are included.
In light of the changes in the age structure of the population in the period studied, the crude rates should be standardized in order to estimate, for the population as a whole, what would have occurred if the death rates obtained according to the groups of causes for the three-year period 1963-1965 had been maintained for the population structure of the three-year period 1982-1984. In Table 3 it may be observed that, in light of this assumption, mortality would have been extraordinarily greater for all groups of causes without changing the relative order of the groups, although the percentage structure of the expected results would have varied if the population of 1982-1984 had been exposed to the death rates registered 20 years before.
Table 1. Deaths and crude mortality rates per 100,000 population, annual averages in three-year periods 1963-1965, 1972-1974 and 1982-1984.
1963-1965 1972-1974 1982-1984 Causes of death preventable through: Deaths Rates Deaths Rates Deaths Rates 1. Vaccination or direct prevention 557 7.3 124 1.4 27 0.3 2. Timely diagnosis and treatment 5,689 74.4 5,978 66.3 6,545 66.1 3. Hygiene, sanitation and education 2,895 37.9 926 10.3 396 4.0 4. Combined actions 13,125 171.7 13,007 144.3 12,678 128.1
Subtotal 22,266 291.3 20,035 222.3 19,646 198.5
5. Currently preventable with difficulty 24,131 315.6 29,038 322.3 35,362 357.3 6. All other deaths 2,672 35.0 2,137 23.8 3,106 31.4
Total 49,069 641.9 51,210 568.4 58,114 587.2
This percentage is equivalent to the standardized mortality ratio (SMR), and it may be calculated either from the number of the deaths (as in the present instance) or from the death rates observed and expected.
The SMR, that is, the percentage of deaths ob-served as compared with the percentage expected, is high in diseases preventable with difficulty, a total of 78.7% and even more in deaths preventable through mixed measures, which account for 86.5% of the total number of deaths expected. The small gain observed in this last group is related to the causes of neonatal death, pneumonias, and cirrhosis of the liver, whose preventability presents complexities similar to those of the group of diseases preventable with difficulty. The last column of Table 3 estimates at 20,960 the annual average number of lives saved in the three-year period 1982-1984 as compared with 20 three-years before, when certain causes affected young ages more severely and life expectancy was 8.5 years less. To complement the preceding analysis we have used the indicators of years of potential life lost (YPLL) in the groups of causes according to criteria for prevent-ability (2,3).
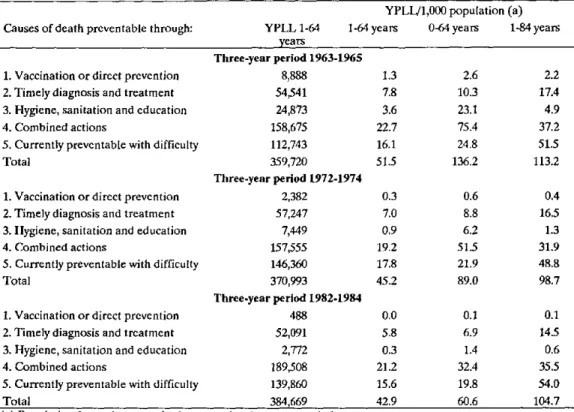
In Table 4 it may be observed that although the total number of YPLL in the 1 to 64-years age group increases as a consequence of the increase in deaths by virtue of the growth of the population, the rate of YPLL from all causes declines from 51.5 years per 1,000 population in the 1 to 64-years group in the first three-year period to 42.9 years in the last.
Although groups 1 and 3 constitute a small per-centage of overall mortality, its decline is such that the YPLL in the last three-year period are almost negligible. If, for instance, we take the 488 YPLL from deaths preventable by vaccination or other very effective measures in the three-year period 1982-1984 and we estimate what this means for each iso-lated individual in the population between 1 and 64
years of age, we see that what is lost at the present time represents only two and a half minutes per person.
In the early diagnosis and timely treatment group, which accounts for between 11% and 12% of deaths, a significant decline is observed between the first and the third three-year period. In the groups of diseases preventable by mixed measures and of diseases pre-ventable with difficulty there is a minor decline, al-though by virtue of the great volume of deaths they both include, the gains noted are very significant.
Table 2. Deaths and crude mortality rates per 100,000 population, annual averages in three-year periods 1963-1965, 1972-1974 and 1982-1984.
1963-1965 1972-1974 1982-1984 Causes of death preventable through: Deaths Rates Deaths Rates Deaths Rates 1. Vaccination or direct prevention 60.0 3.6 3.7 0.0 48.5 1.8 2. Timely diagnosis and treatment 116.7 94.4 32.0 24.3 1,512.9 789.0 3. Hygiene, sanitation and education 830.6 96.2 2.7 0.5 99.7 39.3 4. Combined actions 2,263.3 992.2 83.7 82.4 1,137.1 1,215.3 5. Currently preventable with difficulty 389.8 385.4 56.0 56.3 8,756.3 5,664.3
Table 3. Deaths and crude mortality rates per 100,000 population, annual averages in three-year periods 1963-1965, 1972-1974 and 1982-1984.
1963-1965 1972-1974 1982-1984 Causes of death preventable through: Deaths Rates Deaths Rates Deaths Rates 1. Vaccination or direct prevention 27 675 0.0 0.9 4.4 648 2. Timely diagnosis and treatment 6,545 9,711 11.3 12.3 67.4 3,166 3. Hygiene, sanitation and education 396 4,690 0.7 5.9 8.6 4,294 4. Combined actions 12,678 14,664 21.8 18.5 86.5 1,986
Subtotal 19,646 29,740 33.8 37.6 66.1 10,094
5. Currently preventable with difficulty 35,362 44,925 60.8 56.8 78.7 9,563 6. All other deaths 3,106 4,409 5.4 5.6 70.4 1,303
Total 58,114 79,074 100.0 100.0 73.5 20,960
Table 4. Years of potential life lost in age groups 1-64, 0-64 and 1-84,
according to causal categories for three-year periods 1963-1965, 1972-1974 and 1982-1984.
YPLL/1,000 population (a) Causes of death preventable through: YPLL 1-64 1-64 years 0-64 years 1-84 years
years
Three-year period 1963-1965
1. Vaccination or direct prevention 8,888 1.3 2.6 2.2 2. Timely diagnosis and treatment 54,541 7.8 10.3 17.4 3. Hygiene, sanitation and education 24,873 3.6 23.1 4.9 4. Combined actions 158,675 22.7 75.4 37.2 5. Currently preventable with difficulty 112,743 16.1 24.8 51.5
Total 359,720 51.5 136.2 113.2
Three-year period 1972-1974
1. Vaccination or direct prevention 2,382 0.3 0.6 0.4 2. Timely diagnosis and treatment 57,247 7.0 8.8 16.5 3. Hygiene, sanitation and education 7,449 0.9 6.2 1.3 4. Combined actions 157,555 19.2 51.5 31.9 5. Currently preventable with difficulty 146,360 17.8 21.9 48.8 Total 370,993 45.2 89.0 98.7
Three-year period 1982-1984
If the 0 to 1-year age group is eliminated and the upper age limit increased, analysis of the situation in the 1 to 84-year age group, shows that in group 2--diseases preventable through early diagnosis and timely treatment--the number of years lost with re-spect to the 1 to 64-year age group doubles, and that a similar situation occurs with causes preventable by mixed measures, although less markedly. On the other hand, and as might be expected, the YPLL from causes preventable with difficulty triple in number, since this group includes the chronic and degenera-tive diseases of advanced age.
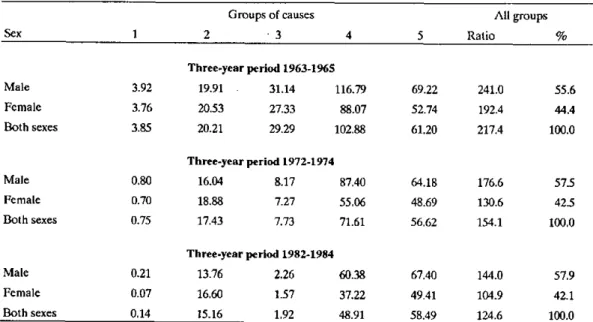
Table 5 presents the extreme age limits analyzed, from 0 to 84 years, and it may be observed that the loss of years of life is not equal for both sexes. For males the greatest loss of years of life increases from 55.6% in the first three-year period to 57.9% of the losses in the last. This excess male mortality appears constantly for all the age groups studied, with the sole exception of excess female mortality in disease group 2. This group includes prostate cancer and bronchial asthma, but also breast and uterus cancer, in addition to diabetes, anemia, and other diseases known as predominant causes of female deaths. Al-though the loss of years of life in this group has declined, it has done so to a lesser extent than in
males. This group, however, offsets excess male mor-tality by less than 2%.
Table 6 summarizes the changes in the proportion of deaths by age groups from one three-year period to another and clarifies Table 4, since the number of deaths of infants under 1 year old has declined by 73.3% between the extreme three-year periods, while the number of deaths among those 65 years of age and older has increased by 67.3%. This is re-flected in the YPLL, which are very directly related to age at death.
If we add the percentage of deaths corresponding to extreme age-groups, that is to say of infants under 1 year old and of those 65 years of age and older for each three-year period--although their percentages in relation to the total are very different--we find that two-thirds of the population have always died in age groups below one year old and 65 years of age and over, that is, 69%, 66.7%, and 66.1% for each three-year period respectively. This reflects that the occur-rence of deaths has shifted rapidly toward increasingly higher ages.
Few global indicators other than these figures could better synthesize the significance of social change, including the health care of the population. However, preventive orientation demands care as
Table 5. Ratio of years of potential life lost per 1,000 population under 85 years of age, by sex, in five groups of causes, three-year periods.
Groups of causes All groups
Sex 1 2 3 4 5 Ratio %
Three-year period 1963-1965
Male 3.92 19.91 31.14 116.79 69.22 241.0 55.6 Female 3.76 20.53 27.33 88.07 52.74 192.4 44.4 Both sexes 3.85 20.21 29.29 102.88 61.20 217.4 100.0
Three-year period 1972-1974
Male 0.80 16.04 8.17 87.40 64.18 176.6 57.5 Female 0.70 18.88 7.27 55.06 48.69 130.6 42.5 Both sexes 0.75 17.43 7.73 71.61 56.62 154.1 100.0
Three-year period 1982-1984
Table 6. Deaths of infants under 1 year old and of those 65 years and older, and percentage of total number of deaths at all ages.
Under 1 year old 65 years of age and older Three-year period Deaths % Deaths %
1963 - 1965 10,033 20.4 21,373 4.6 1972 - 1974 6,583 12.9 27,558 5.8 1982 - 1984 2,677 4.6 35,749 6.5
the fundamental line of development of public health, so that together with the trend of increasing life expectancy, we may continue to bring about the full expansion of faculties and of socially active life up to the end.
References
(1) Latin American Demography Center. Algunos factores relacionados con los cambios de la mortalidad, Series A, No. 162,
pp. 48-57, September 1978.
(2) Centers for Disease Control. Surveillance of the leading causes of premature death. Epidemiol Bull 4(5)11-13, 1983.
(3) Becker, Roberto A.Años potenciales de vida perdidos en Brasil, 1980. Personal Communication, 1986.
(Source: Adapted from Ríos Massabot, PIE. and A. Tejeiro Fernández: Perfiles de salud; investigación de mortalidad, 1988.)
Calendar of Courses
Summer Courses in Epidemiology in the United States
* The Johns Hopkins University School of Hygiene and Public Health is sponsoring the Eighth Annual Graduate Summer Program in Epidemiology, to be conducted from 18 June to 6 July 1990. The program includes: applied multivariate statistics; cancer risk and prevention; design and conduct of clinical trials; epidemiologic methods for evaluating health ser-vices; epidemiology and the law; epidemiology of AIDS; epidemiology of mental disorders, alcohol and drug problems; infectious disease epidemiology; methods of health risk assessment; nutritional epide-miology; principles of epidemiology, and use of mi-crocomputers in epidemiology. Proficiency in the English language is required.
Further information is available from Helen Wal-ters, Program Coordinator, Graduate Summer Pro-gram in Epidemiology, The Johns Hopkins University, School of Hygiene and Public Health, 615 North Wolfe Street, Baltimore, Maryland 21205.
* Tufts University at Medford, Massachusetts, The New England Epidemiology Institute and the Post-graduate Medical Institute are sponsoring the Tenth Annual New England Epidemiology Summer Pro-gram, to be conducted from 15 July to 3 August, 1990. The course will cover the theory and practice of epidemiology; causal inference; biostatistics for epi-demiologists; regression and categorical data meth-ods; logistic regression and survival analysis; ecologycal analysis; statistical inference; conducting epidemiological research; the biology and epidemiol-ogy of cancer; nutritional epidemiolepidemiol-ogy; clinical epi-demiology, and environmental epidemiology. Proficiency in English is essential.
For more information contact The New England Epidemiology Institute, 826 Boylston Street, Chesnut Hill, Massachusetts 02167.